Home > Comparison > Technology > ALAB vs STM
The strategic rivalry between Astera Labs, Inc. and STMicroelectronics N.V. defines the current trajectory of the semiconductor sector. Astera Labs operates as a nimble innovator focused on cloud and AI connectivity solutions, while STMicroelectronics stands as a diversified semiconductor heavyweight with broad industry applications. This head-to-head hinges on innovation velocity versus scale and diversification. This analysis will reveal which corporate path offers superior risk-adjusted potential for a balanced portfolio.
Table of contents
Companies Overview
Astera Labs and STMicroelectronics stand as pivotal players in the global semiconductor industry.
Astera Labs, Inc. Common Stock: Cloud Connectivity Specialist
Astera Labs defines itself by delivering semiconductor-based connectivity solutions tailored for cloud and AI infrastructure. Its revenue stems from the Intelligent Connectivity Platform, blending data, network, and memory products under a software-defined architecture. In 2026, the firm sharpens its focus on scaling high-performance cloud infrastructure deployments, leveraging its Santa Clara base and 440 employees.
STMicroelectronics N.V.: Broad-Spectrum Semiconductor Innovator
STMicroelectronics operates as a diversified semiconductor manufacturer with a global reach across multiple segments, including automotive, analog, and microcontrollers. Its revenue engine is rooted in supplying integrated circuits and sensors to various markets, from automotive to personal electronics. The company’s 2026 strategy centers on expanding its product portfolio and strengthening its presence across Europe, Asia, and the Americas with nearly 50K employees.
Strategic Collision: Similarities & Divergences
Astera Labs concentrates on niche, high-growth cloud infrastructure connectivity, while STMicroelectronics embraces a broad product portfolio targeting diverse markets. Their primary battleground is innovation in semiconductor components that enable next-generation technologies. Astera Labs offers a focused growth story with a lean team, contrasting with ST’s sprawling scale and diversified risk exposure, defining their distinct investment profiles.
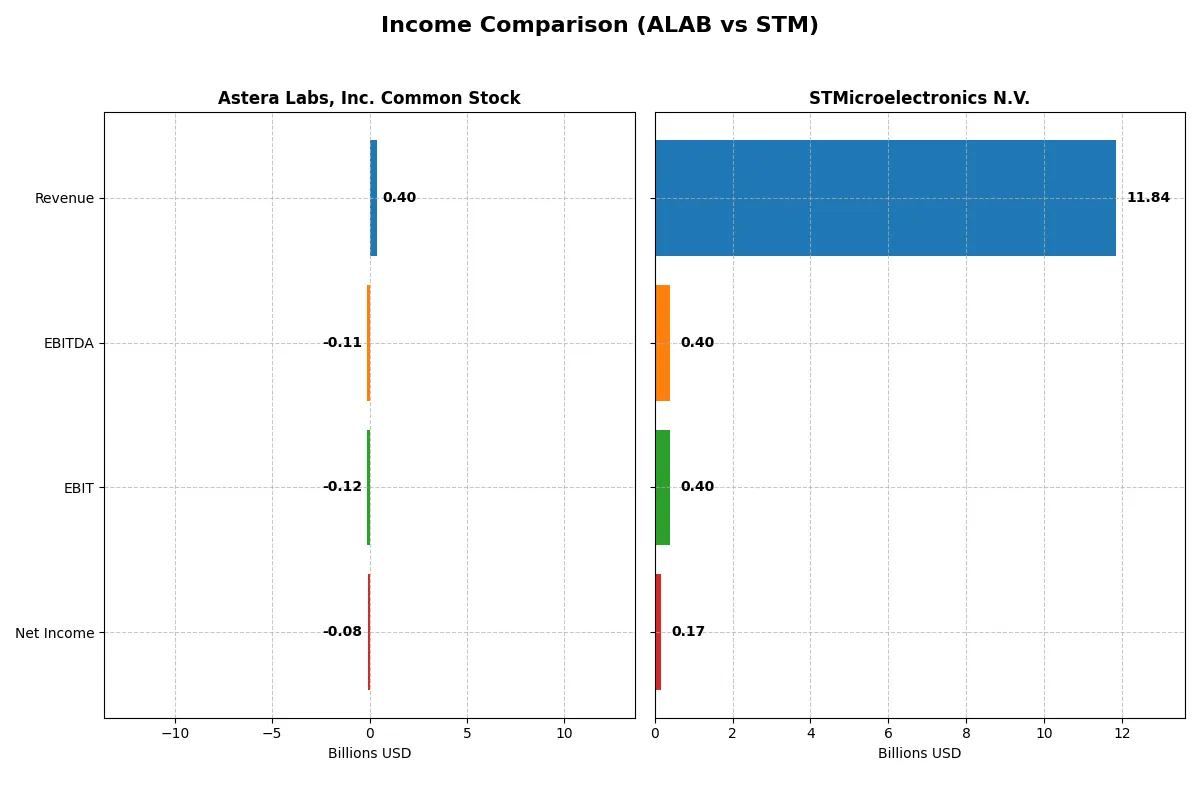
Income Statement Comparison
This data dissects the core profitability and scalability of both corporate engines to reveal who dominates the bottom line:
| Metric | Astera Labs, Inc. (ALAB) | STMicroelectronics N.V. (STM) |
|---|---|---|
| Revenue | 396M | 13.3B |
| Cost of Revenue | 94M | 8.05B |
| Operating Expenses | 419M | 3.54B |
| Gross Profit | 303M | 5.22B |
| EBITDA | -113M | 3.72B |
| EBIT | -116M | 1.96B |
| Interest Expense | 0 | 85M |
| Net Income | -83M | 1.56B |
| EPS | -0.64 | 1.73 |
| Fiscal Year | 2024 | 2024 |
Income Statement Analysis: The Bottom-Line Duel
This Income Statement comparison reveals which company runs a more efficient and sustainable corporate engine through its revenue and profitability trends.
Astera Labs, Inc. Common Stock Analysis
Astera Labs’ revenue surged from $80M in 2022 to $396M in 2024, a remarkable growth of 396%. Despite a healthy gross margin of 76%, it posted negative EBIT and net margins around -29% and -21%, respectively. The net loss widened to -$83M in 2024 as operating expenses scaled with revenue growth, signaling ongoing investment phases and limited operational efficiency.
STMicroelectronics N.V. Analysis
STMicroelectronics’ revenue declined from $17.3B in 2023 to $11.8B in 2025, reflecting a 7% drop over four years. Gross margin slipped to 34%, while EBIT and net margins hovered near 3.4% and 1.4%, respectively. Profitability eroded sharply in 2025 with EBIT falling 80% year-on-year, highlighting margin pressure and weaker cost control amid revenue contraction.
Margin Resilience vs. Scale Pressures
Astera Labs excels in top-line momentum and superior gross margin but struggles to convert growth into profits due to high operating expenses. STMicroelectronics boasts scale and positive net income but faces declining revenue and shrinking profitability. For investors, Astera’s high-growth, high-burn profile contrasts with STM’s mature but pressured margin structure, reflecting distinct risk-reward trade-offs.
Financial Ratios Comparison
These vital ratios act as a diagnostic tool to expose the underlying fiscal health, valuation premiums, and capital efficiency of the companies compared below:
| Ratios | Astera Labs (ALAB) | STMicroelectronics (STM) |
|---|---|---|
| ROE | -8.65% | 8.92% |
| ROIC | -11.97% | 6.34% |
| P/E | -208.41 | 14.43 |
| P/B | 18.02 | 1.29 |
| Current Ratio | 11.71 | 3.11 |
| Quick Ratio | 11.21 | 2.37 |
| D/E | 0.0013 | 0.18 |
| Debt-to-Assets | 0.12% | 13.00% |
| Interest Coverage | 0 | 19.72 |
| Asset Turnover | 0.38 | 0.54 |
| Fixed Asset Turnover | 11.12 | 1.22 |
| Payout ratio | 0 | 18.50% |
| Dividend yield | 0 | 1.28% |
| Fiscal Year | 2024 | 2024 |
Efficiency & Valuation Duel: The Vital Signs
Financial ratios serve as a company’s DNA, unveiling hidden risks and operational strengths that numbers alone cannot disclose.
Astera Labs, Inc. Common Stock
Astera Labs shows weak profitability with a negative ROE of -8.65% and a net margin of -21.05%. Its valuation appears stretched, reflected by a high P/B of 18.02 despite a favorable negative P/E. The company does not pay dividends, instead investing heavily in R&D, with over 50% of revenue devoted to innovation.
STMicroelectronics N.V.
STMicroelectronics posts modest profitability with a ROE of 0.93% and a slim net margin of 1.41%. Its valuation looks reasonable, supported by favorable P/E and P/B statuses. The firm maintains a solid capital structure and reinvests earnings into growth, although it currently offers no dividend yield to shareholders.
Operational Efficiency vs. Valuation Stretch
STMicroelectronics balances moderate returns and valuation with fewer red flags than Astera Labs, which struggles with profitability and stretched valuation multiples. Investors seeking operational steadiness may prefer STMicroelectronics, while those comfortable with innovation risk might consider Astera Labs’ growth profile.
Which one offers the Superior Shareholder Reward?
Astera Labs (ALAB) pays no dividends and posts negative earnings, focusing on reinvestment for growth. STMicroelectronics (STM) delivers a modest 1.28% dividend yield with a conservative 18% payout ratio and consistent buybacks. STM’s distribution is sustainable and balances income with growth, offering a superior total return profile in 2026.
Comparative Score Analysis: The Strategic Profile
The radar chart reveals the fundamental DNA and trade-offs of Astera Labs, Inc. and STMicroelectronics N.V., highlighting their financial strengths and weaknesses:
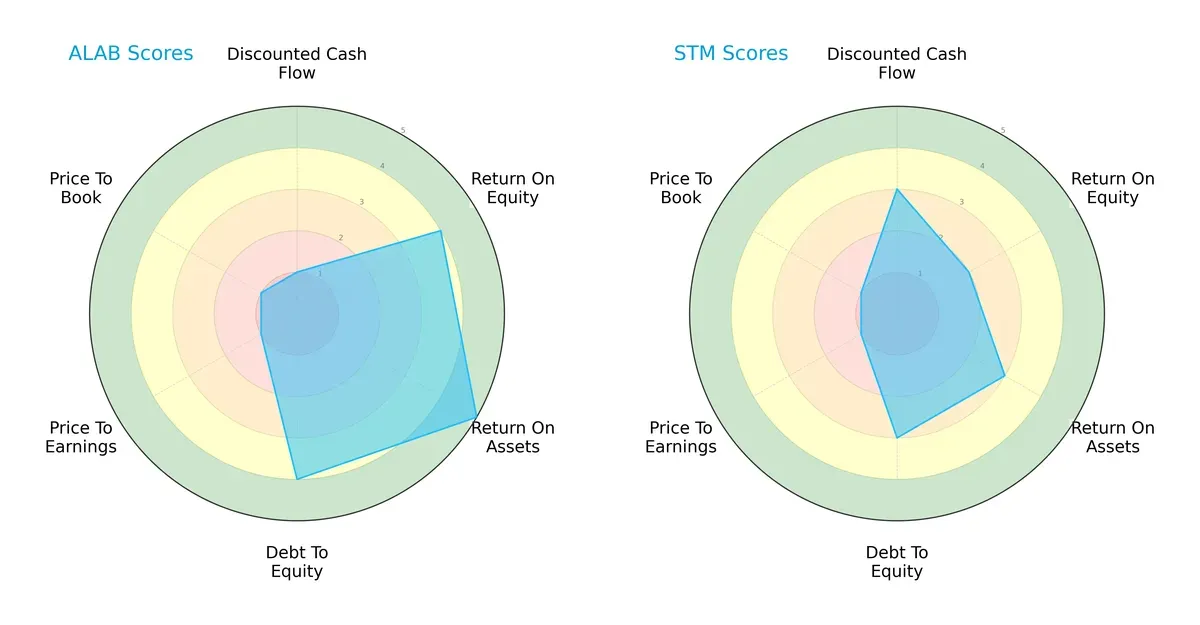
Astera Labs shows superior operational efficiency with higher ROE (4 vs. 2) and ROA (5 vs. 3) scores, reflecting stronger asset utilization. It also manages leverage better, scoring 4 in Debt/Equity versus STM’s 3. However, Astera Labs suffers from valuation concerns, with very unfavorable P/E and P/B scores (both 1), matching STM’s weak valuation. STM relies on a more balanced DCF score (3 vs. 1) but lags in profitability metrics. Overall, Astera Labs displays a sharper edge in profitability and balance sheet strength, while STM maintains moderate consistency without a standout advantage.
Bankruptcy Risk: Solvency Showdown
Astera Labs and STMicroelectronics both reside comfortably in the safe zone for bankruptcy risk, but Astera Labs’ Altman Z-Score is extraordinarily high, signaling exceptional solvency strength relative to STM:
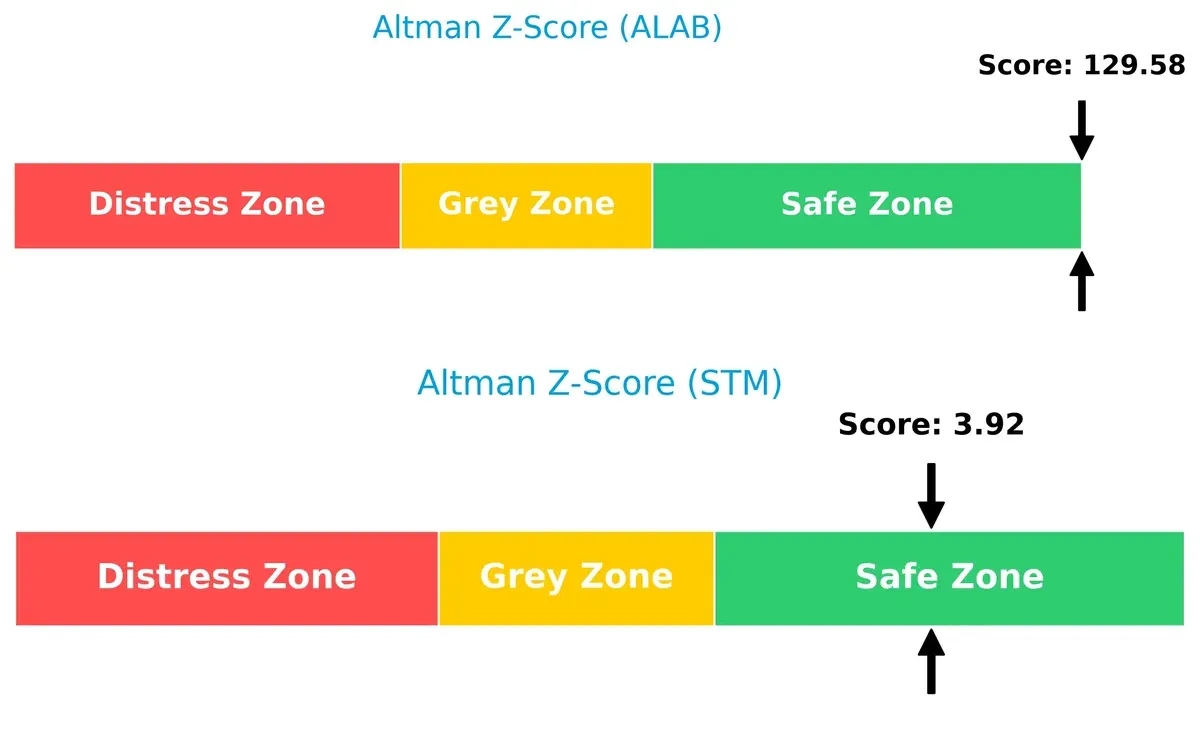
This vast difference implies that Astera Labs holds an almost unassailable buffer against financial distress in this cycle, while STM, with its solid 3.9 score, remains stable but less fortified for unexpected shocks.
Financial Health: Quality of Operations
STMicroelectronics scores an 8, indicating very strong internal financial health, outperforming Astera Labs, which registers a decent but average 6:

Astera Labs anchors 393M USD in Products with minimal 3.2M USD from Technology Service, signaling high concentration. STMicroelectronics dwarfs with 13.2B USD Product revenue plus 196M USD Service and 52M USD in Other segments, showing a broader mix. ST’s diversified base mitigates concentration risk and leverages infrastructure dominance, while Astera’s narrow focus suggests vulnerability to market shifts in a single segment.
Strengths and Weaknesses Comparison
This table compares the strengths and weaknesses of Astera Labs (ALAB) and STMicroelectronics (STM):
ALAB Strengths
- High quick ratio at 11.21 indicates strong short-term liquidity
- Zero debt-to-equity ratio shows conservative leverage
- Low debt-to-assets ratio at 0.12 supports financial stability
- Strong fixed asset turnover at 11.12 reflects efficient asset use
STM Strengths
- Diverse global presence including US, France, Italy, Japan, Singapore, Switzerland
- Favorable debt metrics with DE at 0.12 and low debt-to-assets at 8.6%
- Interest coverage is infinite, indicating no difficulty in servicing debt
- Consistent favorable PE and PB ratios suggest market confidence
ALAB Weaknesses
- Negative profitability ratios with net margin -21%, ROE -8.65%, ROIC -11.97%
- Unfavorable current ratio at 11.71 may signal excess current assets tied up
- Negative asset turnover at 0.38 implies less efficient revenue generation
- Zero interest coverage indicates inability to cover interest expenses
- High PB ratio of 18.02 suggests potential overvaluation
STM Weaknesses
- Low profitability with net margin at 1.41%, ROE at 0.93%, ROIC at 0.67%
- Unfavorable current ratio of 3.36 indicates weaker liquidity compared to peers
- Asset turnover at 0.48 is low, signaling less efficient asset use
- Dividend yield at zero could deter income-focused investors
Overall, ALAB shows strengths in liquidity and low leverage but struggles with profitability and asset efficiency. STM benefits from broad geographic diversification and solid debt management but faces challenges in profitability and operational efficiency. These factors shape each company’s strategic priorities going forward.
The Moat Duel: Analyzing Competitive Defensibility
A structural moat is the only reliable barrier protecting long-term profits from relentless competitive pressure in the semiconductor sector:
Astera Labs, Inc. Common Stock: Emerging Connectivity Innovator
Astera Labs’ moat stems from its Intangible Assets—patented Intelligent Connectivity Platform. This drives high gross margins (76%) despite negative EBIT. Growth in AI/cloud markets may deepen this moat by 2026.
STMicroelectronics N.V.: Diversified Analog & Automotive Powerhouse
STM’s moat relies on Cost Advantage and broad product portfolio, contrasting Astera’s niche focus. Margins are lower (34%) but stable. However, declining ROIC and shrinking revenue signal rising risks to its competitive edge.
Emerging Innovation vs. Established Scale: Who Holds the Moat Advantage?
Astera Labs’ growing ROIC trend and innovation-driven moat offer a deeper competitive edge than STM’s declining profitability and scale-dependent cost advantage. Astera appears better positioned to defend and expand its market share.
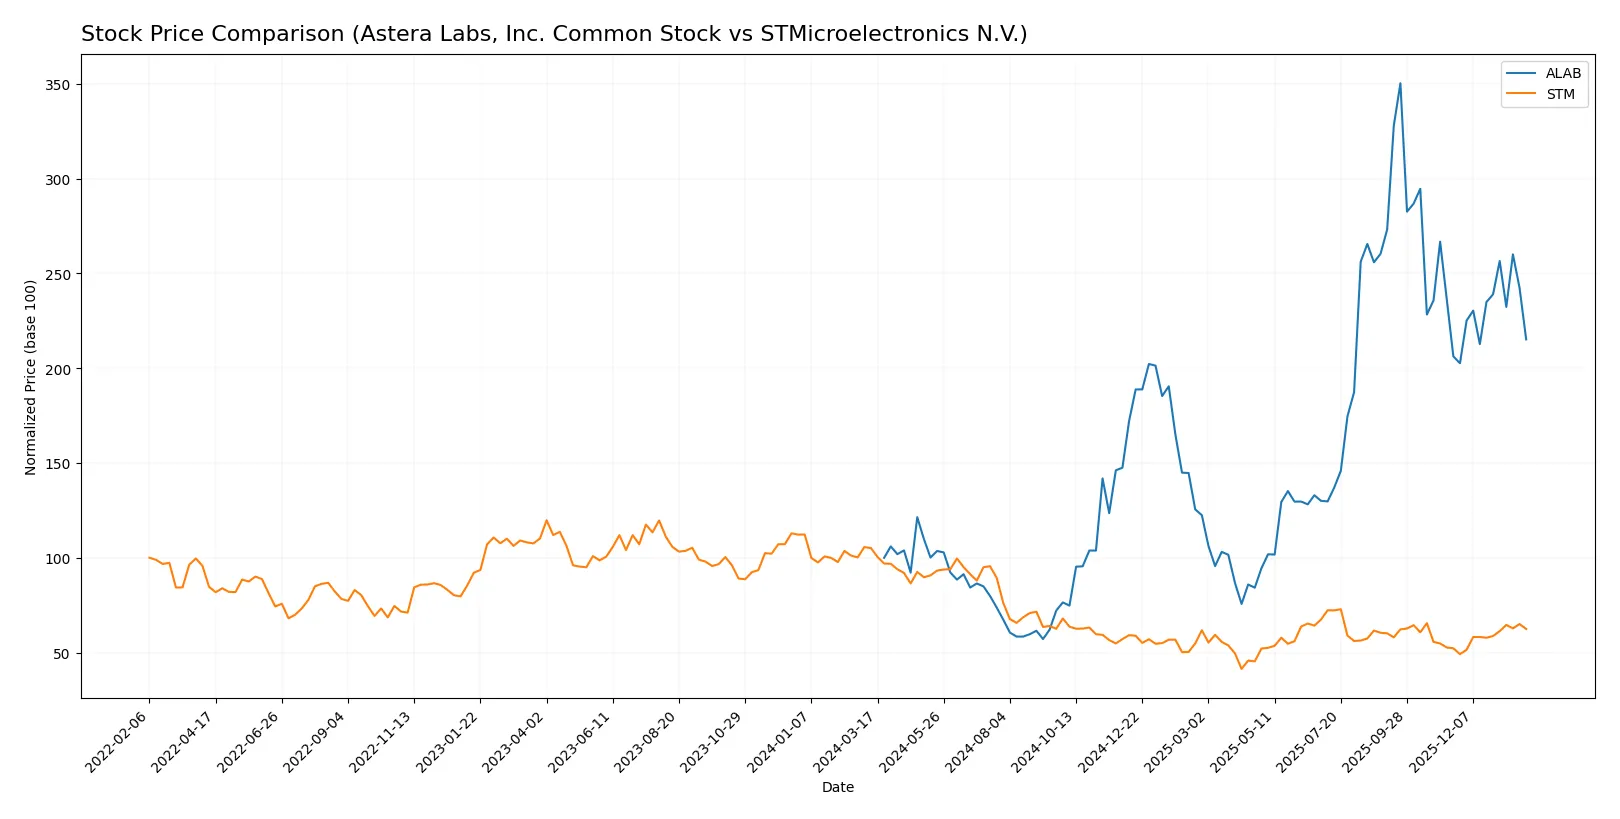
Which stock offers better returns?
The past year showed stark divergence in price dynamics: Astera Labs surged sharply, while STMicroelectronics declined significantly before showing signs of recovery.
Trend Comparison
Astera Labs (ALAB) posted a 115.17% price increase over 12 months, signaling a strong bullish trend with accelerating momentum and notable volatility (std dev 50.39). The stock reached a high of 245.2 and a low of 40.0.
STMicroelectronics (STM) experienced a 40.6% price decline over the same period, marking a bearish trend despite accelerating movement. Recent gains of 19.49% suggest a mild recovery, with lower volatility (std dev 6.77).
Comparing trends, ALAB delivered the highest market performance, outperforming STM’s negative 40.6% return by a wide margin over the last year.
Target Prices
Analysts present a cautiously optimistic target consensus for both Astera Labs and STMicroelectronics.
| Company | Target Low | Target High | Consensus |
|---|---|---|---|
| Astera Labs, Inc. | 165 | 225 | 202.14 |
| STMicroelectronics N.V. | 28 | 45 | 37.67 |
Astera Labs’ consensus target of 202.14 exceeds its current price of 150.62 by 34%, indicating growth potential. STMicroelectronics’ target consensus of 37.67 also surpasses its 27.89 price by 35%, suggesting room for appreciation.

Don’t Let Luck Decide Your Entry Point
Optimize your entry points with our advanced ProRealTime indicators. You’ll get efficient buy signals with precise price targets for maximum performance. Start outperforming now!
How do institutions grade them?
Here is a comparison of the latest institutional grades for both companies:
Astera Labs, Inc. Common Stock Grades
The table below summarizes recent grades from notable grading firms for Astera Labs:
| Grading Company | Action | New Grade | Date |
|---|---|---|---|
| Northland Capital Markets | Maintain | Outperform | 2025-12-09 |
| Northland Capital Markets | Upgrade | Outperform | 2025-11-17 |
| Needham | Maintain | Buy | 2025-11-05 |
| JP Morgan | Maintain | Overweight | 2025-11-05 |
| TD Cowen | Maintain | Hold | 2025-11-05 |
| Morgan Stanley | Maintain | Overweight | 2025-11-05 |
| Roth Capital | Maintain | Buy | 2025-11-05 |
| Stifel | Maintain | Buy | 2025-11-05 |
| Barclays | Downgrade | Equal Weight | 2025-10-20 |
| Stifel | Maintain | Buy | 2025-10-17 |
STMicroelectronics N.V. Grades
Below are the recent grades issued by recognized firms for STMicroelectronics:
| Grading Company | Action | New Grade | Date |
|---|---|---|---|
| TD Cowen | Maintain | Buy | 2025-10-24 |
| Susquehanna | Maintain | Positive | 2025-10-22 |
| Susquehanna | Maintain | Positive | 2025-07-25 |
| Susquehanna | Maintain | Positive | 2025-07-22 |
| Baird | Upgrade | Outperform | 2025-07-22 |
| Jefferies | Upgrade | Buy | 2025-02-19 |
| Bernstein | Downgrade | Market Perform | 2025-02-05 |
| Susquehanna | Maintain | Positive | 2025-01-31 |
| Barclays | Downgrade | Underweight | 2025-01-22 |
| JP Morgan | Downgrade | Neutral | 2024-12-09 |
Which company has the best grades?
Astera Labs holds more consistent Buy and Outperform ratings from top firms, whereas STMicroelectronics shows mixed grades with recent downgrades. This may influence investor sentiment towards greater confidence in Astera Labs.
Risks specific to each company
The following categories identify critical pressure points and systemic threats facing Astera Labs, Inc. and STMicroelectronics N.V. in the 2026 market environment:
1. Market & Competition
Astera Labs, Inc. Common Stock
- Faces intense competition as a newer player in AI infrastructure connectivity. High innovation pressure.
STMicroelectronics N.V.
- Established with diverse semiconductor segments; faces strong global competitors, especially in automotive and industrial markets.
2. Capital Structure & Debt
Astera Labs, Inc. Common Stock
- Zero debt level reduces financial risk but limits leverage benefits. Interest coverage at zero signals no earnings cover interest.
STMicroelectronics N.V.
- Moderate debt (D/E 0.12) manageable; strong interest coverage and healthier capital structure.
3. Stock Volatility
Astera Labs, Inc. Common Stock
- High beta (1.51) and wide price range indicate elevated stock volatility and risk.
STMicroelectronics N.V.
- Lower beta (1.29) and narrower trading range reflect more stable stock behavior.
4. Regulatory & Legal
Astera Labs, Inc. Common Stock
- US-based exposure to evolving tech regulations may increase compliance costs.
STMicroelectronics N.V.
- Global footprint exposes it to complex regulations across multiple jurisdictions, adding compliance complexity.
5. Supply Chain & Operations
Astera Labs, Inc. Common Stock
- Smaller scale (440 employees) may face supply chain fragility and scale inefficiencies.
STMicroelectronics N.V.
- Large global operations (49,600+ employees) provide resilience but complexities in supply chain management.
6. ESG & Climate Transition
Astera Labs, Inc. Common Stock
- Limited ESG disclosures increase uncertainty; needs to adapt rapidly to climate-related regulations.
STMicroelectronics N.V.
- More established ESG programs but faces ongoing pressure to meet stringent European climate mandates.
7. Geopolitical Exposure
Astera Labs, Inc. Common Stock
- Primarily US exposure; geopolitical tensions could impact semiconductor supply and demand.
STMicroelectronics N.V.
- Extensive international exposure, including Europe and Asia, heightening risks from trade wars and regional conflicts.
Which company shows a better risk-adjusted profile?
Astera Labs’ most impactful risk is its high stock volatility combined with negative profitability metrics. STMicroelectronics faces greater geopolitical and regulatory complexity but benefits from a stable capital structure and stronger operational scale. STMicroelectronics’ higher Piotroski score (8 vs. 6) and Altman Z-Score in the safe zone confirm a more balanced risk-adjusted profile. Recent data shows Astera Labs’ zero interest coverage despite zero debt, signaling operational strains that amplify risk.
Final Verdict: Which stock to choose?
Astera Labs (ALAB) impresses with its rapid top-line growth and strong cash position, showcasing a superpower in capital efficiency and innovation. However, its persistent losses and value destruction remain points of vigilance. ALAB fits portfolios targeting aggressive growth with a tolerance for volatility and recovery potential.
STMicroelectronics (STM) benefits from a strategic moat rooted in diversified semiconductor markets and steady operational cash flow. Its financial stability and stronger income quality offer better downside protection relative to ALAB. STM suits investors seeking growth at a reasonable price with moderate risk appetite.
If you prioritize aggressive growth and innovation capture, Astera Labs stands out despite its financial headwinds. However, if you seek more stability and a proven operational moat, STMicroelectronics offers better resilience and consistent cash generation, even if growth momentum has slowed. Each scenario aligns with distinct investor profiles balancing opportunity and risk.
Disclaimer: Investment carries a risk of loss of initial capital. The past performance is not a reliable indicator of future results. Be sure to understand risks before making an investment decision.
Go Further
I encourage you to read the complete analyses of Astera Labs, Inc. Common Stock and STMicroelectronics N.V. to enhance your investment decisions: