Astera Labs, Inc. (ALAB) and Qnity Electronics, Inc. (Q) are two emerging players in the semiconductor industry, a critical sector powering the future of technology. Both companies focus on innovative solutions within chip connectivity and materials, targeting high-growth markets like cloud infrastructure and advanced electronics. This comparison explores their strategies and market positions to help you identify which stock could be a more compelling addition to your investment portfolio.

Table of contents
Companies Overview
I will begin the comparison between Astera Labs, Inc. and Qnity Electronics, Inc. by providing an overview of these two companies and their main differences.
Astera Labs Overview
Astera Labs, Inc. designs and manufactures semiconductor-based connectivity solutions aimed at cloud and AI infrastructure. Its Intelligent Connectivity Platform integrates data, network, and memory connectivity products on a software-defined architecture. Founded in 2017 and based in Santa Clara, California, Astera Labs positions itself as a provider of scalable, high-performance infrastructure components in the semiconductor industry.
Qnity Electronics Overview
Qnity Electronics, Inc. specializes in electronic solutions and advanced materials used in semiconductor chip manufacturing. Formerly Novus SpinCo 1, Inc., it rebranded in April 2025 and is headquartered in Wilmington, Delaware. Qnity focuses on supplying critical materials and components essential for semiconductor production, operating within the technology sector with a distinct emphasis on manufacturing inputs.
Key similarities and differences
Both companies operate in the semiconductor industry within the technology sector and are publicly traded in the US. Astera Labs centers on connectivity solutions for cloud and AI infrastructure, emphasizing integrated platforms, while Qnity Electronics concentrates on providing materials and solutions for the chip manufacturing process. Their business models differ in product focus and market application, with Astera leaning toward infrastructure performance and Qnity targeting manufacturing supply chain needs.
Income Statement Comparison
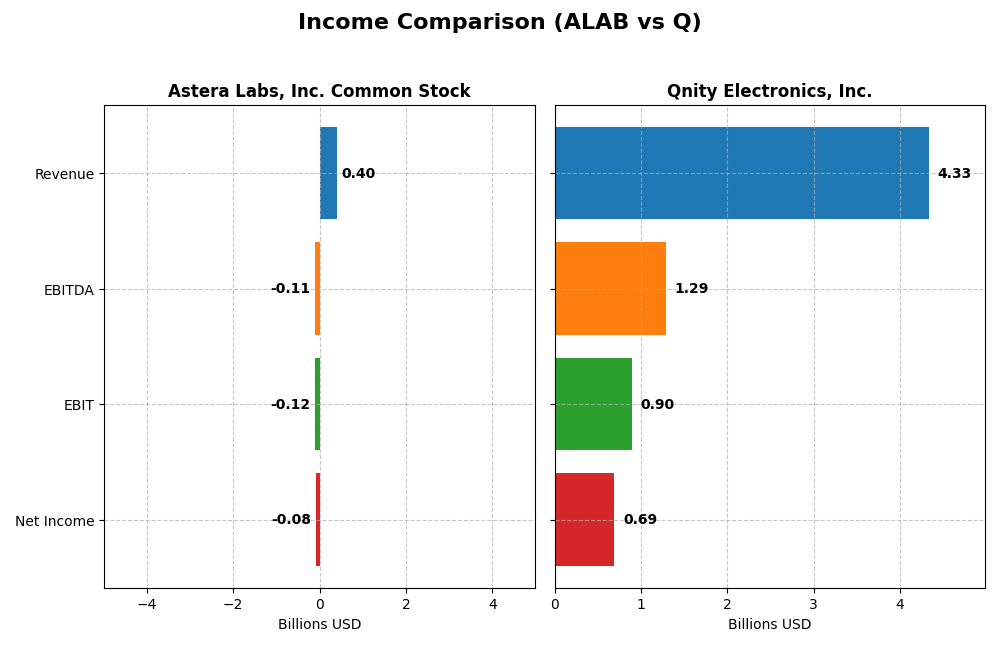
The table below presents a side-by-side comparison of key income statement metrics for Astera Labs, Inc. Common Stock (ALAB) and Qnity Electronics, Inc. (Q) for the fiscal year 2024.
| Metric | Astera Labs, Inc. Common Stock (ALAB) | Qnity Electronics, Inc. (Q) |
|---|---|---|
| Market Cap | 29.5B | 19.5B |
| Revenue | 396.3M | 4.34B |
| EBITDA | -113M | 1.29B |
| EBIT | -116.1M | 898M |
| Net Income | -83.4M | 693M |
| EPS | -0.64 | 3.31 |
| Fiscal Year | 2024 | 2024 |
Income Statement Interpretations
Astera Labs, Inc. Common Stock
Astera Labs experienced strong revenue growth from 2022 to 2024, increasing from $79.9M to $396.3M, a 396% jump, with a stable favorable gross margin around 76%. However, net income remained negative, widening to -$83.4M in 2024 despite a slight improvement in net margin. Operating losses deepened as expenses grew in line with revenue, reflecting investment in growth.
Qnity Electronics, Inc.
Qnity Electronics showed moderate revenue decline over three years, falling from $4.76B in 2022 to $4.34B in 2024. Gross margin remained favorable near 46%, with improving EBIT margin reaching 20.7% in 2024. Net income rose to $693M in 2024, supported by controlled operating expenses and a solid net margin near 16%, signaling operational efficiency gains despite revenue softness.
Which one has the stronger fundamentals?
Qnity Electronics demonstrates stronger fundamentals with positive EBIT and net margins, consistent profitability, and favorable margin growth in 2024. In contrast, Astera Labs shows impressive top-line growth but sustained net losses and negative EBIT margin, indicating higher risk. Overall, Qnity’s profitability and margin stability favor a stronger income statement foundation.
Financial Ratios Comparison
The table below compares key financial ratios for Astera Labs, Inc. Common Stock (ALAB) and Qnity Electronics, Inc. (Q) based on their most recent fiscal year data for 2024.
| Ratios | Astera Labs, Inc. (ALAB) | Qnity Electronics, Inc. (Q) |
|---|---|---|
| ROE | -8.6% | 6.5% |
| ROIC | -12.0% | 5.9% |
| P/E | -208.4 | 28.8 |
| P/B | 18.0 | 1.88 |
| Current Ratio | 11.7 | 1.77 |
| Quick Ratio | 11.2 | 1.06 |
| D/E (Debt-to-Equity) | 0.0013 | 0.018 |
| Debt-to-Assets | 0.0012 | 0.016 |
| Interest Coverage | 0 | 3.03 |
| Asset Turnover | 0.38 | 0.35 |
| Fixed Asset Turnover | 11.1 | 2.59 |
| Payout Ratio | 0 | 0 |
| Dividend Yield | 0 | 0 |
Interpretation of the Ratios
Astera Labs, Inc. Common Stock (ALAB)
Astera Labs shows predominantly unfavorable financial ratios, including negative net margin (-21.05%) and return on equity (-8.65%), indicating profitability challenges. Despite a high current ratio (11.71), this is viewed negatively, possibly implying inefficient asset use. The company does not pay dividends, consistent with its negative earnings and focus on reinvestment and R&D, as reflected by elevated research expenditure.
Qnity Electronics, Inc. (Q)
Qnity Electronics displays generally more favorable ratios, with a positive net margin of 15.99% and a slightly favorable overall ratio assessment. The company’s current and quick ratios indicate reasonable liquidity, while its debt levels remain low. Qnity pays a small dividend, but the yield is negligible, suggesting limited immediate shareholder returns amid ongoing growth and capital allocation priorities.
Which one has the best ratios?
Qnity Electronics has a more balanced and slightly favorable ratio profile, with profitability and liquidity metrics mostly positive. Astera Labs faces significant profitability and efficiency issues, reflected in many unfavorable ratios and a lack of dividend payments. Therefore, Qnity Electronics currently holds the more robust financial ratio standing between the two.
Strategic Positioning
This section compares the strategic positioning of Astera Labs and Qnity Electronics, focusing on Market position, Key segments, and Exposure to technological disruption:
Astera Labs, Inc. Common Stock
- Larger market cap of 29.5B with NASDAQ listing, facing semiconductor industry competition.
- Focuses on semiconductor connectivity solutions for cloud and AI infrastructure, with product revenue of 393M USD.
- Operates with software-defined architecture enabling scalable cloud and AI infrastructure connectivity.
Qnity Electronics, Inc.
- Market cap of 19.5B, listed on NYSE, competes in semiconductor materials and solutions.
- Provides electronic solutions and materials for semiconductor chip manufacturing, no segmented revenue disclosed.
- Exposure to advanced electronic materials for chips, no explicit mention of technology disruption strategy.
Astera Labs vs Qnity Electronics Positioning
Astera Labs has a concentrated focus on cloud and AI semiconductor connectivity, leveraging software-defined architecture, while Qnity Electronics offers broader electronic materials for chip manufacturing. Astera’s clear product revenue contrasts with Qnity’s less detailed segmentation.
Which has the best competitive advantage?
Astera Labs shows a slightly unfavorable moat due to value destruction but improving ROIC, indicating growing profitability. Qnity Electronics holds a neutral moat with stable profitability but no evident competitive moat advantage.
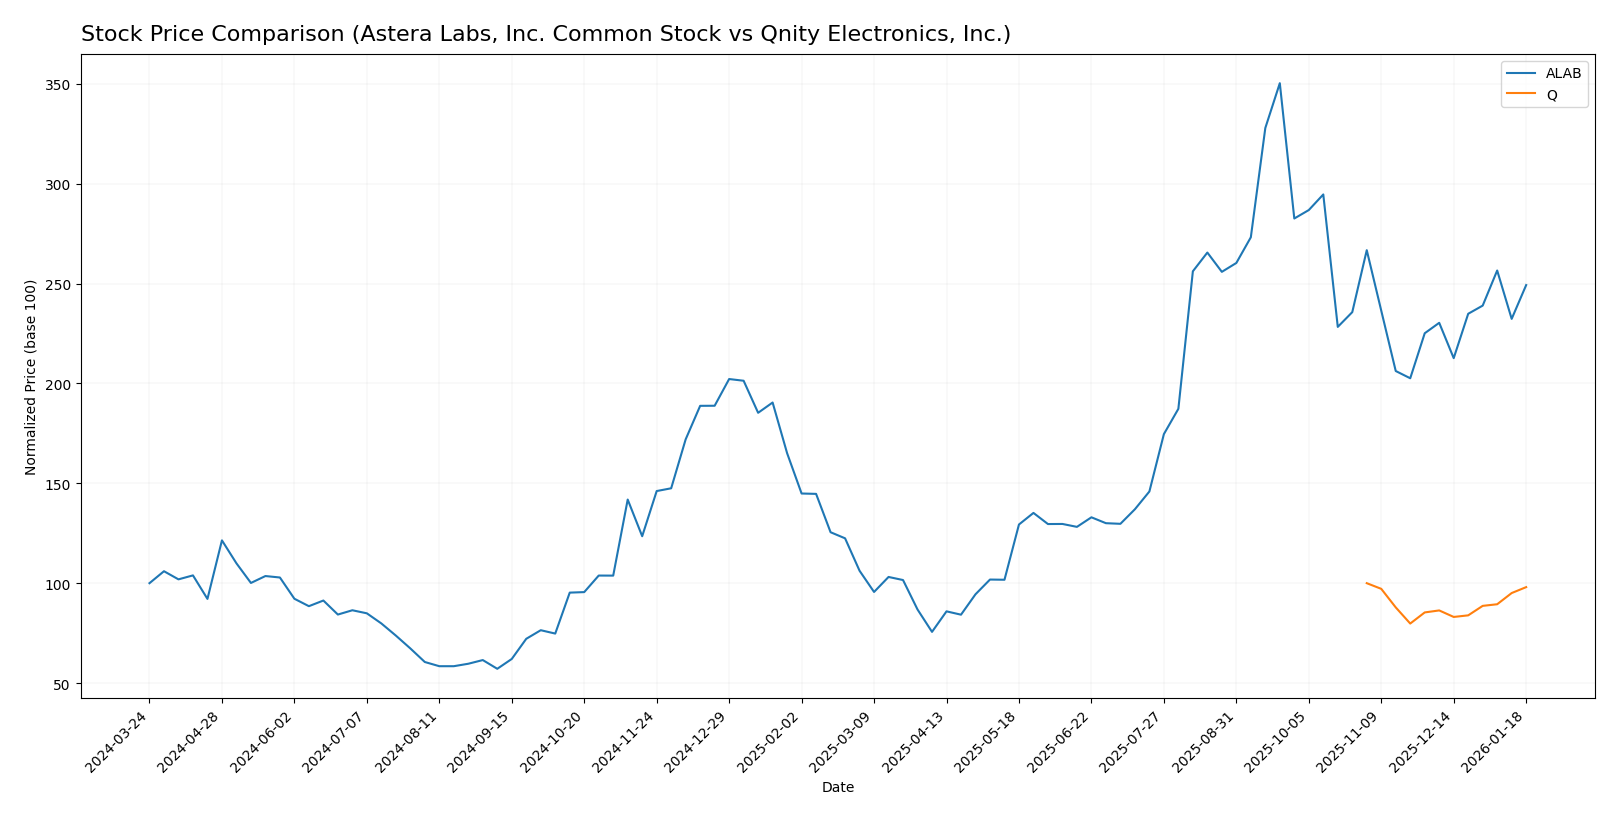
Stock Comparison
The stock price chart highlights significant divergence in performance over the past 12 months, with Astera Labs showing a strong bullish trend despite recent deceleration, while Qnity Electronics exhibits a stable but slightly bearish trajectory.
Trend Analysis
Astera Labs, Inc. Common Stock experienced a 149.21% price increase over the past year, indicating a bullish trend with deceleration. The stock reached a high of 245.2 and a low of 40.0, with notable volatility at a 50.14 standard deviation.
Qnity Electronics, Inc. showed a -1.98% price change over the same period, representing a neutral-to-bearish trend with stable acceleration. Its price fluctuated between 75.8 and 95.0, with lower volatility at a 5.94 standard deviation.
Comparatively, Astera Labs delivered the highest market performance, outperforming Qnity Electronics by a wide margin in total price appreciation and volatility over the past year.
Target Prices
The current analyst consensus indicates promising upside potential for both Astera Labs, Inc. and Qnity Electronics, Inc.
| Company | Target High | Target Low | Consensus |
|---|---|---|---|
| Astera Labs, Inc. Common Stock | 225 | 165 | 202.14 |
| Qnity Electronics, Inc. | 117 | 92 | 105.89 |
Analyst targets for Astera Labs suggest a significant upside from the current price of $174.45, while Qnity Electronics shows potential gains above its $93.12 market price, reflecting generally optimistic market expectations.
Analyst Opinions Comparison
This section compares analysts’ ratings and grades for Astera Labs, Inc. Common Stock (ALAB) and Qnity Electronics, Inc. (Q):
Rating Comparison
ALAB Rating
- Rating B, considered very favorable overall.
- Discounted Cash Flow Score of 1, indicating very unfavorable valuation outlook.
- Return on Equity Score of 4, showing favorable profit generation efficiency.
- Return on Assets Score of 5, very favorable asset utilization.
- Debt To Equity Score of 4, reflecting favorable financial stability.
- Overall Score of 3, representing a moderate overall financial standing.
Q Rating
- Rating B+, also rated very favorable overall.
- Discounted Cash Flow Score of 4, indicating a favorable valuation outlook.
- Return on Equity Score of 3, indicating moderate profit generation.
- Return on Assets Score of 4, considered favorable asset utilization.
- Debt To Equity Score of 3, showing moderate financial stability.
- Overall Score of 3, also indicating a moderate overall financial standing.
Which one is the best rated?
Q holds a slightly higher overall rating (B+ versus B) and scores better on discounted cash flow, suggesting a more favorable valuation. ALAB outperforms in return on equity, assets, and debt management, but both share a moderate overall score of 3.
Scores Comparison
Here is a comparison of the Altman Z-Score and Piotroski Score for the two companies:
ALAB Scores
- Altman Z-Score: 136.88, indicating a safe zone.
- Piotroski Score: 6, considered average.
Q Scores
- Data not available.
- Data not available.
Which company has the best scores?
Based on the provided data, only ALAB has available scores showing a very high Altman Z-Score in the safe zone and an average Piotroski Score. Q lacks score data for comparison.
Grades Comparison
The following is a summary of the recent grades and rating actions for both companies:
Astera Labs, Inc. Common Stock Grades
This table shows the latest grades and rating changes by major financial institutions for Astera Labs, Inc.:
| Grading Company | Action | New Grade | Date |
|---|---|---|---|
| Northland Capital Markets | Maintain | Outperform | 2025-12-09 |
| Northland Capital Markets | Upgrade | Outperform | 2025-11-17 |
| Stifel | Maintain | Buy | 2025-11-05 |
| Morgan Stanley | Maintain | Overweight | 2025-11-05 |
| Roth Capital | Maintain | Buy | 2025-11-05 |
| Needham | Maintain | Buy | 2025-11-05 |
| JP Morgan | Maintain | Overweight | 2025-11-05 |
| TD Cowen | Maintain | Hold | 2025-11-05 |
| Barclays | Downgrade | Equal Weight | 2025-10-20 |
| Stifel | Maintain | Buy | 2025-10-17 |
Astera Labs has a strong consensus with predominantly buy and outperform ratings, showing positive stability with few downgrades.
Qnity Electronics, Inc. Grades
This table presents the recent grades and rating actions for Qnity Electronics, Inc.:
| Grading Company | Action | New Grade | Date |
|---|---|---|---|
| RBC Capital | Maintain | Outperform | 2025-11-25 |
| Mizuho | Maintain | Outperform | 2025-11-20 |
Qnity Electronics holds consistent outperform ratings with no changes, indicating steady analyst confidence.
Which company has the best grades?
Astera Labs, Inc. has a broader range of analyst coverage with a strong buy consensus and multiple upgrades, while Qnity Electronics shows stable outperform ratings but fewer total reviews. Astera Labs’ diverse buy and outperform ratings could offer investors more confidence in growth potential compared to Qnity’s more limited but positive outlook.
Strengths and Weaknesses
Below is a comparison of key strengths and weaknesses for Astera Labs, Inc. (ALAB) and Qnity Electronics, Inc. (Q) based on the latest financial and competitive data.
| Criterion | Astera Labs, Inc. (ALAB) | Qnity Electronics, Inc. (Q) |
|---|---|---|
| Diversification | Moderate reliance on product sales (393M USD) with minor tech services (3.2M USD) | Limited data on product diversification |
| Profitability | Negative net margin (-21.05%), ROIC negative (-11.97%), shedding value overall | Positive net margin (15.99%), stable ROIC (5.92%), neutral moat status |
| Innovation | ROIC trend improving (+65.5%), indicating growing profitability potential | Stable profitability, no significant ROIC growth |
| Global presence | Not explicitly detailed, but high current and quick ratios suggest strong liquidity | Moderate liquidity, favorable debt ratios, likely stable presence |
| Market Share | Low asset turnover (0.38) suggests underutilization of assets | Similar low asset turnover (0.35), but better overall financial health |
Key takeaway: Astera Labs currently struggles with profitability and value creation despite improving returns, while Qnity Electronics exhibits stable profitability and a neutral competitive moat, making Q a relatively safer choice for investors seeking steady performance.
Risk Analysis
Below is a comparative risk overview for Astera Labs, Inc. (ALAB) and Qnity Electronics, Inc. (Q) based on the most recent 2024 data.
| Metric | Astera Labs, Inc. (ALAB) | Qnity Electronics, Inc. (Q) |
|---|---|---|
| Market Risk | High beta (1.51) indicates higher volatility | Beta 0, implying lower market sensitivity |
| Debt level | Very low debt (Debt/Equity = 0.0), low debt-to-assets (12%) | Low debt (Debt/Equity = 0.02), very low debt-to-assets (1.56%) |
| Regulatory Risk | Moderate – Semiconductor industry sensitive to export controls and IP laws | Moderate – Similar industry risks, plus recent rebranding could attract scrutiny |
| Operational Risk | Unfavorable margins and returns, operational efficiency concerns | Favorable margins but moderate ROE and asset turnover suggest operational caution |
| Environmental Risk | Standard industry exposure, no dividend yield may reflect reinvestment in sustainability | Similar exposure, no dividend yield, possible reinvestment in compliance |
| Geopolitical Risk | US-based with global supply chain exposure, potential impacts from trade tensions | US-based, likewise exposed to global semiconductor supply chain disruptions |
Astera Labs faces higher market risk due to volatility and operational challenges, despite strong liquidity and negligible debt. Qnity shows healthier profitability and lower market risk but must manage moderate operational efficiency and geopolitical dependencies. Investors should weigh ALAB’s growth potential against its financial instability and Q’s steadier but less dynamic profile.
Which Stock to Choose?
Astera Labs, Inc. Common Stock (ALAB) shows a strong revenue growth of 242% in 2024 with a gross margin of 76.38%, but suffers from negative profitability ratios including an ROE of -8.65% and a net margin of -21.05%. Its debt levels are low, and the rating is very favorable (B), though financial ratios are mostly unfavorable.
Qnity Electronics, Inc. (Q) displays moderate revenue growth of 7.43% in 2024 and a positive net margin of 15.99%, with an ROE of 6.51%. Debt is well managed with a low net debt to EBITDA of 0.02, and its overall rating is very favorable (B+) with a slightly favorable global financial ratios evaluation.
Investors seeking growth might find ALAB’s strong revenue expansion appealing despite its current unprofitable status and unfavorable ratios, while those prioritizing stable profitability and balanced financial ratios may view Q as more favorable due to its consistent positive income and neutral to favorable ratios.
Disclaimer: Investment carries a risk of loss of initial capital. The past performance is not a reliable indicator of future results. Be sure to understand risks before making an investment decision.
Go Further
I encourage you to read the complete analyses of Astera Labs, Inc. Common Stock and Qnity Electronics, Inc. to enhance your investment decisions: