Home > Comparison > Technology > NXPI vs ALAB
The strategic rivalry between NXP Semiconductors N.V. and Astera Labs, Inc. shapes the semiconductor industry’s evolution. NXP operates as a capital-intensive semiconductor giant with a broad product portfolio spanning automotive and IoT applications. In contrast, Astera Labs focuses on specialized, software-defined connectivity solutions for cloud and AI infrastructure. This analysis will assess which firm’s operational model and growth trajectory provide superior risk-adjusted returns for a diversified technology portfolio.
Table of contents
Companies Overview
NXP Semiconductors and Astera Labs are pivotal players in the semiconductor sector, shaping technology’s future.
NXP Semiconductors N.V.: Global Semiconductor Powerhouse
NXP Semiconductors dominates with a broad product portfolio spanning microcontrollers, application processors, and wireless connectivity solutions. It generates revenue by serving automotive, industrial, IoT, and communication infrastructure sectors. In 2026, NXP focuses on advancing integrated semiconductor solutions to sustain its leadership in diverse end markets.
Astera Labs, Inc. Common Stock: AI and Cloud Connectivity Innovator
Astera Labs specializes in semiconductor-based connectivity solutions for cloud and AI infrastructure. Its Intelligent Connectivity Platform leverages software-defined architecture to enable scalable, high-performance deployments. The company’s 2026 strategy emphasizes expanding its footprint in AI-driven data center connectivity with cutting-edge product innovation.
Strategic Collision: Similarities & Divergences
Both firms operate in semiconductors but diverge sharply: NXP pursues a broad market approach with diversified products, while Astera Labs targets niche AI-cloud connectivity with a software-centric model. Their competition centers on data transmission and processing efficiency in expanding tech ecosystems. Investors will find distinct risk-reward profiles shaped by scale and innovation focus.
Income Statement Comparison
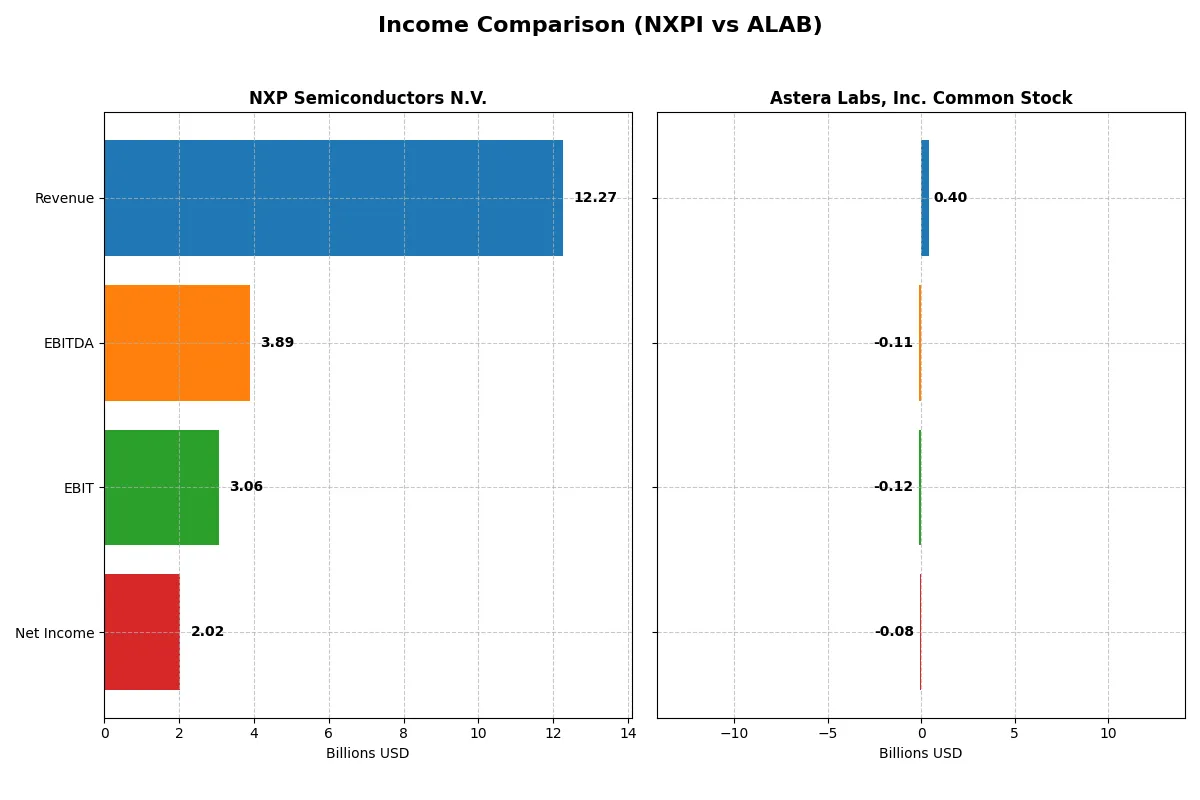
This data dissects the core profitability and scalability of both corporate engines to reveal who dominates the bottom line:
| Metric | NXP Semiconductors N.V. (NXPI) | Astera Labs, Inc. Common Stock (ALAB) |
|---|---|---|
| Revenue | 12.3B | 396M |
| Cost of Revenue | 5.6B | 93.6M |
| Operating Expenses | 3.4B | 419M |
| Gross Profit | 6.7B | 303M |
| EBITDA | 3.9B | -113M |
| EBIT | 3.1B | -116M |
| Interest Expense | 384M | 0 |
| Net Income | 2.0B | -83.4M |
| EPS | 8.00 | -0.64 |
| Fiscal Year | 2025 | 2024 |
Income Statement Analysis: The Bottom-Line Duel
This income statement comparison reveals which company converts revenue into profits most efficiently in challenging market conditions.
NXP Semiconductors N.V. Analysis
NXP’s revenue edged down 2.7% to $12.3B in 2025, with net income falling 19% to $2.0B. Despite this, it sustains robust gross (54.4%) and net margins (16.5%). The company’s disciplined expense control preserves a healthy EBIT margin near 25%, highlighting operational efficiency amid revenue pressure.
Astera Labs, Inc. Common Stock Analysis
Astera Labs tripled revenue to $396M in 2024, driven by aggressive top-line growth. However, it reported a net loss of $83M, reflecting a negative net margin of -21%. High operating expenses erode profitability despite an impressive gross margin of 76.4%. The widening EBIT loss signals ongoing challenges in scaling profitably.
Margin Strength vs. Growth Struggles
NXP delivers consistent profitability with strong margins despite slight revenue decline, demonstrating fundamental earnings resilience. Astera Labs shows dynamic revenue expansion but remains unprofitable with heavy operating losses. Investors seeking stable earnings will favor NXP’s efficient profit engine, while Astera’s profile suits those prioritizing high growth potential with risk tolerance.
Financial Ratios Comparison
These vital ratios act as a diagnostic tool to expose the underlying fiscal health, valuation premiums, and capital efficiency of the companies analyzed below:
| Ratios | NXP Semiconductors N.V. (NXPI) | Astera Labs, Inc. Common Stock (ALAB) |
|---|---|---|
| ROE | 20.1% | -8.6% |
| ROIC | 11.0% | -12.0% |
| P/E | 27.1 | -208.4 |
| P/B | 5.45 | 18.0 |
| Current Ratio | 2.05 | 11.7 |
| Quick Ratio | 1.38 | 11.2 |
| D/E | 1.22 | 0.0013 |
| Debt-to-Assets | 46.0% | 0.12% |
| Interest Coverage | 8.62 | 0 |
| Asset Turnover | 0.46 | 0.38 |
| Fixed Asset Turnover | 4.12 | 11.1 |
| Payout ratio | 50.7% | 0 |
| Dividend yield | 1.87% | 0 |
| Fiscal Year | 2025 | 2024 |
Efficiency & Valuation Duel: The Vital Signs
Financial ratios act as a company’s DNA, unveiling hidden risks and operational excellence that raw numbers alone cannot reveal.
NXP Semiconductors N.V.
NXP Semiconductors delivers robust profitability with a 20.1% ROE and a strong 16.47% net margin, reflecting effective capital use. However, its valuation appears stretched with a P/E of 27.14 and P/B of 5.45. The company offers a modest 1.87% dividend yield, balancing shareholder returns with steady reinvestment in R&D for growth.
Astera Labs, Inc. Common Stock
Astera Labs suffers from weak profitability, posting negative returns: ROE at -8.65% and net margin at -21.05%. Its valuation metrics are extreme, with a negative P/E but an elevated P/B of 18.02, indicating market skepticism. The firm pays no dividends, focusing capital on heavy R&D investment, though operational efficiency remains poor.
Balanced Strength vs. Growth Risk
NXP Semiconductors offers a better risk-reward balance with solid profitability and disciplined capital allocation despite a premium valuation. Astera Labs faces significant operational challenges and valuation concerns, fitting investors seeking high-risk growth plays rather than stable income.
Which one offers the Superior Shareholder Reward?
I compare NXP Semiconductors (NXPI) and Astera Labs (ALAB) on dividends, buybacks, and sustainability. NXPI yields 1.9%, with a 41% payout ratio, supported by strong free cash flow of 8B. It maintains steady buybacks, enhancing total returns. ALAB pays no dividends, focusing instead on reinvestment through R&D and growth, reflected in negative margins. Its buyback activity is negligible, given its early-stage losses. NXPI’s balanced distribution and cash generation offer more sustainable, attractive shareholder rewards in 2026. ALAB’s model suits risk-tolerant growth investors but lacks immediate shareholder returns.
Comparative Score Analysis: The Strategic Profile
The radar chart reveals the fundamental DNA and trade-offs of both firms, highlighting their financial strengths and vulnerabilities:
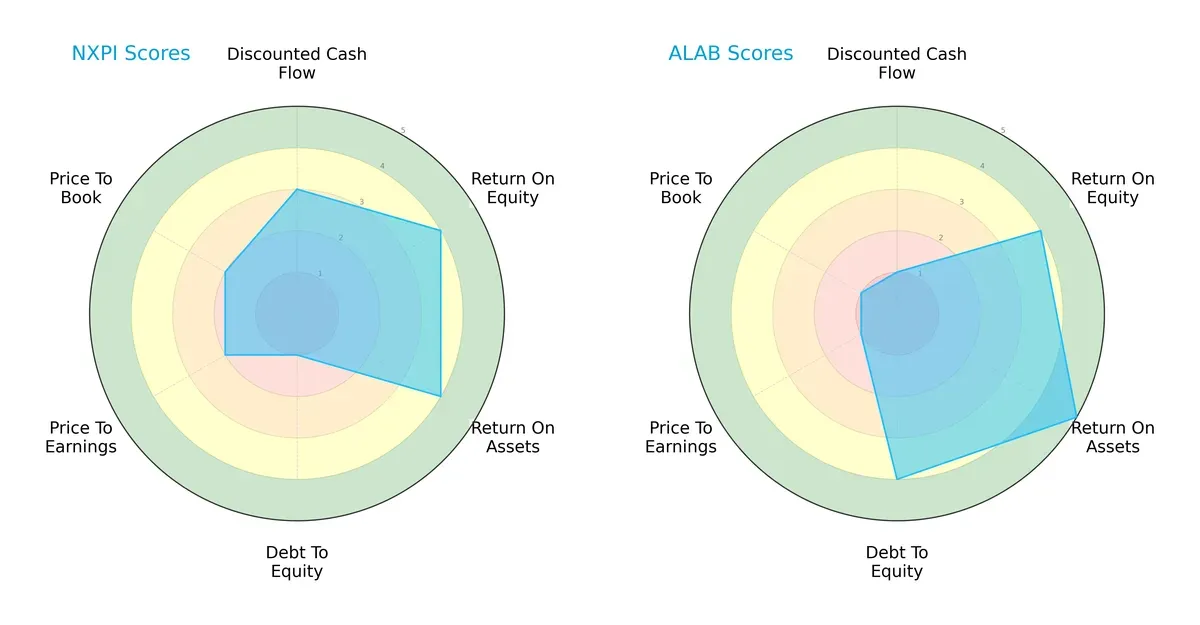
NXP Semiconductors (NXPI) shows balanced scores in ROE (4) and ROA (4), but struggles with a weak debt-to-equity score (1), indicating high leverage risk. Astera Labs (ALAB) excels in asset efficiency (ROA 5) and maintains stronger balance sheet health (debt-to-equity 4) but suffers from poor valuation scores (P/E and P/B both 1), reflecting potential overvaluation or market skepticism. NXPI relies on operational efficiency but carries financial risk. ALAB’s profile favors stability but comes with valuation red flags.
Bankruptcy Risk: Solvency Showdown
Astera Labs’ Altman Z-Score (121.1) far exceeds NXP Semiconductors’ (3.1), placing both in the safe zone but showing a massive solvency gap:
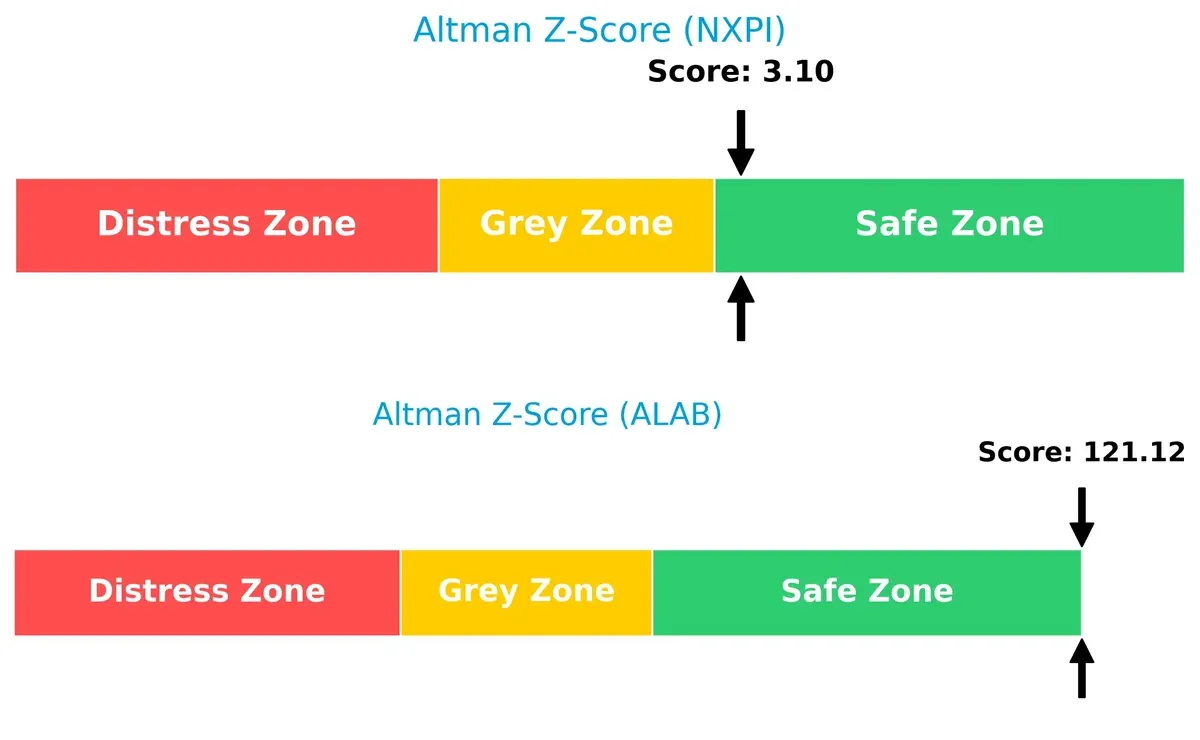
ALAB’s extremely high score signals robust long-term survival and negligible bankruptcy risk. NXPI’s score, while safe, suggests closer monitoring is prudent due to its higher leverage. In this cycle, ALAB’s financial footing stands out decisively.
Financial Health: Quality of Operations
Astera Labs scores a 6 on the Piotroski F-Score, slightly better than NXP’s 5, indicating marginally superior financial health:
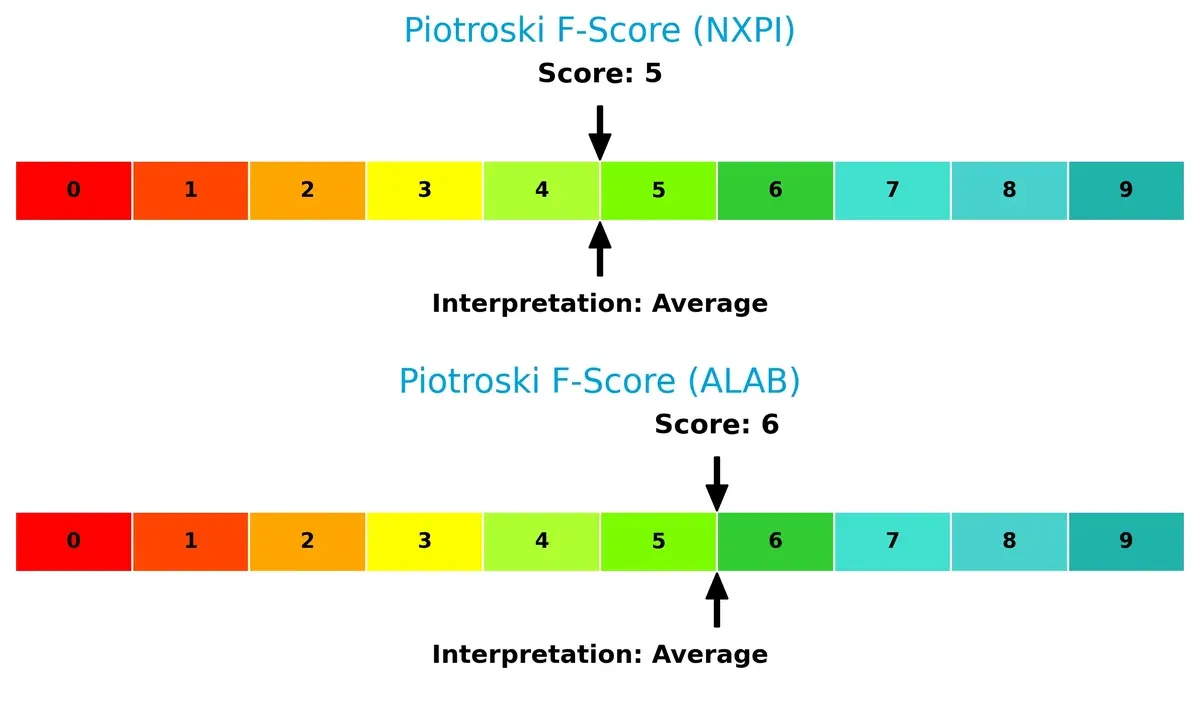
Both firms register average operational quality without red flags. ALAB’s stronger internal metrics suggest a steadier balance of profitability, leverage, and liquidity. NXPI’s score signals room for improvement but no immediate warning signs. Investors should watch for operational shifts impacting these fundamentals.
How are the two companies positioned?
This section dissects the operational DNA of NXP and Astera Labs by comparing their revenue distribution and internal dynamics. The goal is to confront their economic moats to reveal which model offers the most resilient competitive advantage today.
Revenue Segmentation: The Strategic Mix
This comparison dissects how NXP Semiconductors and Astera Labs diversify income streams and highlights their primary sector bets:
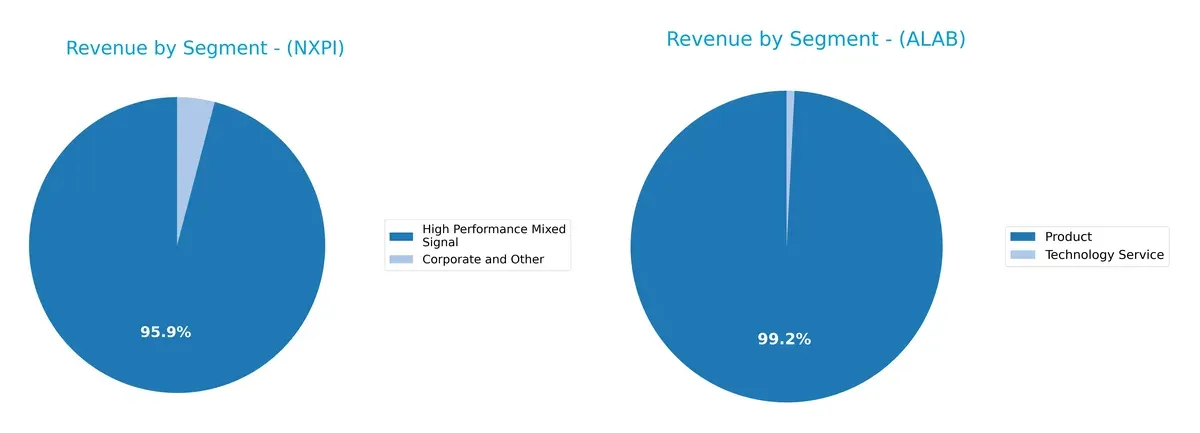
NXP Semiconductors anchors its revenue in High Performance Mixed Signal, generating $9B in 2018, dwarfing other segments like Corporate and Other at $385M. It shows moderate diversification with a minor Standard Products stream in earlier years. Astera Labs relies almost exclusively on its Product segment, with $393M in 2024, exposing it to concentration risk. NXP’s mix suggests ecosystem lock-in, while Astera Labs pivots on a narrower tech-service model.
Strengths and Weaknesses Comparison
This table compares the Strengths and Weaknesses of NXP Semiconductors N.V. (NXPI) and Astera Labs, Inc. Common Stock (ALAB):
NXPI Strengths
- Strong profitability with 16.47% net margin and 20.1% ROE
- Favorable liquidity ratios (current 2.05, quick 1.38)
- Global presence with diversified revenue across China, US, Germany, and others
- High fixed asset turnover at 4.12 indicates efficient capital use
ALAB Strengths
- Zero debt and low debt-to-assets at 0.12
- Outstanding fixed asset turnover at 11.12 reflecting asset efficiency
- Quick ratio of 11.21 indicates excellent short-term liquidity
- Favorable PE ratio despite negative earnings
NXPI Weaknesses
- High price multiples with PE 27.14 and PB 5.45 signal expensive valuation
- Elevated debt-to-equity at 1.22 raises leverage concerns
- Below-par asset turnover at 0.46 limits revenue generation from assets
- Neutral WACC at 9.36% restricts capital cost advantage
ALAB Weaknesses
- Negative profitability metrics including -21.05% net margin and -8.65% ROE
- Zero interest coverage ratio reflects inability to service debt interest
- Negative ROIC at -11.97% indicates value destruction
- Unfavorable PB at 18.02 and dividend yield at 0% highlight valuation and return weaknesses
- Current ratio of 11.71 flagged as unfavorable, suggesting balance sheet distortion
Overall, NXPI displays a robust profitability profile and diversified global footprint, though high valuation and leverage warrant caution. ALAB shows strong asset efficiency and liquidity but suffers from persistent unprofitability and valuation concerns, which complicate its strategic outlook. Investors should weigh these factors relative to sector benchmarks and risk tolerance.
The Moat Duel: Analyzing Competitive Defensibility
A structural moat is the only barrier protecting long-term profits from competition’s relentless erosion. Let’s examine these firms’ moats closely:
NXP Semiconductors N.V.: Diversified Product Portfolio & Scale Advantage
NXP’s moat stems from broad product diversification and scale, reflected in stable 54% gross margins and 16% net margins. However, its ROIC lags WACC, signaling margin pressure amid slowing revenue growth in 2025. New IoT and automotive markets offer growth, but competition tightens.
Astera Labs, Inc.: Emerging Network Effects in Cloud Connectivity
Astera Labs relies on network effects in cloud infrastructure connectivity, shown by rapid 240% revenue growth but negative margins. Its ROIC is deeply below WACC but improving, suggesting early-stage moat build. Expansion into AI hardware markets could strengthen its position if it controls scale.
Scale & Diversification vs. Growth & Network Effects
NXP’s more established, diversified moat is deeper, supported by high margins despite slightly declining ROIC. Astera’s moat is narrower but growing, hinging on future network effects and market penetration. NXP is better positioned today to defend share, while Astera must prove sustainability under competitive pressure.
Which stock offers better returns?
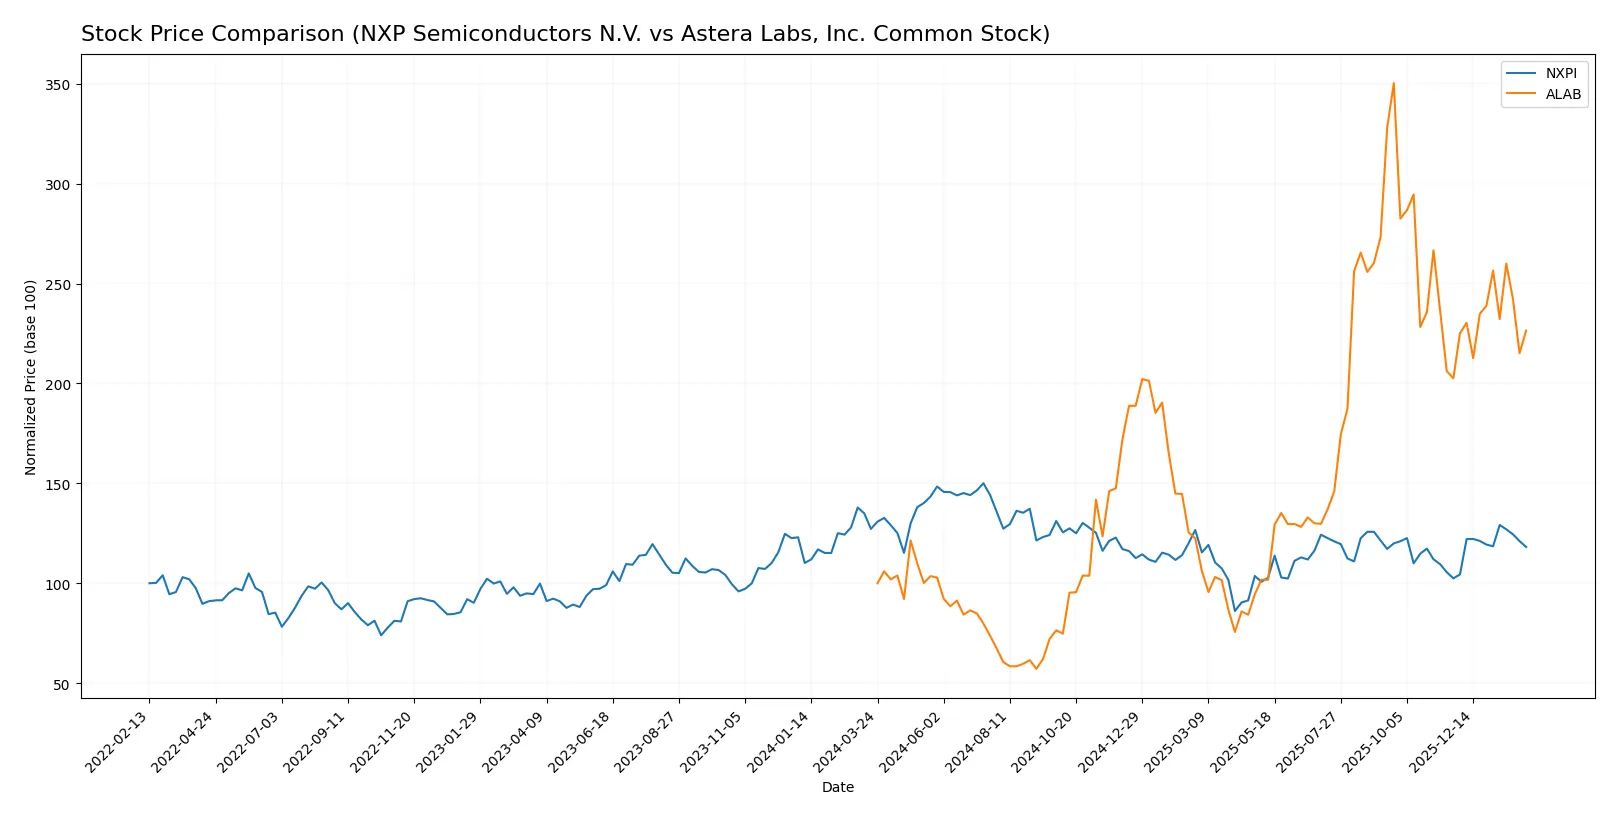
Over the past 12 months, the stocks of NXP Semiconductors N.V. and Astera Labs, Inc. showed contrasting price movements and trading dynamics, reflecting divergent market sentiment and momentum.
Trend Comparison
NXP Semiconductors experienced a 7.11% price decline over the past year, signaling a bearish trend with accelerating downside momentum and a high volatility level of 24.1. The recent period shows a 15.32% rebound, indicating a short-term recovery.
Astera Labs posted a robust 126.46% price increase, marking a strong bullish trend with decelerating gains and elevated volatility at 50.42. Its recent 11.79% gain reflects continued but slowing upward momentum.
Astera Labs clearly outperformed NXP Semiconductors, delivering the highest market returns over the past year amid strong buyer interest and expanding trading volumes.
Target Prices
Analysts present a bullish consensus for both NXP Semiconductors N.V. and Astera Labs, Inc. based on solid growth prospects.
| Company | Target Low | Target High | Consensus |
|---|---|---|---|
| NXP Semiconductors N.V. | 215 | 280 | 245 |
| Astera Labs, Inc. Common Stock | 165 | 225 | 202.14 |
The target consensus for NXP Semiconductors sits roughly 11% above the current price of 220.66 USD, indicating moderate upside. Astera Labs’ consensus price at 202.14 USD exceeds its current 158.52 USD by nearly 27%, reflecting strong growth expectations in semiconductor connectivity solutions.

Don’t Let Luck Decide Your Entry Point
Optimize your entry points with our advanced ProRealTime indicators. You’ll get efficient buy signals with precise price targets for maximum performance. Start outperforming now!
How do institutions grade them?
NXP Semiconductors N.V. Grades
The following table summarizes recent institutional grades for NXP Semiconductors N.V.:
| Grading Company | Action | New Grade | Date |
|---|---|---|---|
| Citigroup | Maintain | Buy | 2026-01-15 |
| Wells Fargo | Maintain | Overweight | 2026-01-15 |
| Truist Securities | Maintain | Buy | 2025-12-19 |
| JP Morgan | Maintain | Neutral | 2025-10-29 |
| Truist Securities | Maintain | Buy | 2025-10-29 |
| Susquehanna | Maintain | Neutral | 2025-07-23 |
| Truist Securities | Maintain | Buy | 2025-07-23 |
| JP Morgan | Maintain | Neutral | 2025-07-23 |
| Wells Fargo | Maintain | Overweight | 2025-07-23 |
| Barclays | Maintain | Overweight | 2025-07-22 |
Astera Labs, Inc. Common Stock Grades
The following table summarizes recent institutional grades for Astera Labs, Inc. Common Stock:
| Grading Company | Action | New Grade | Date |
|---|---|---|---|
| Northland Capital Markets | Maintain | Outperform | 2025-12-09 |
| Northland Capital Markets | Upgrade | Outperform | 2025-11-17 |
| Needham | Maintain | Buy | 2025-11-05 |
| JP Morgan | Maintain | Overweight | 2025-11-05 |
| TD Cowen | Maintain | Hold | 2025-11-05 |
| Morgan Stanley | Maintain | Overweight | 2025-11-05 |
| Roth Capital | Maintain | Buy | 2025-11-05 |
| Stifel | Maintain | Buy | 2025-11-05 |
| Barclays | Downgrade | Equal Weight | 2025-10-20 |
| Stifel | Maintain | Buy | 2025-10-17 |
Which company has the best grades?
NXP Semiconductors consistently receives Buy and Overweight ratings from several top-tier firms. Astera Labs shows a mix of Outperform, Buy, and Overweight but also includes a downgrade to Equal Weight. NXP’s more stable and higher-grade consensus may indicate stronger institutional confidence, potentially influencing investor sentiment positively.
Risks specific to each company
The following categories identify the critical pressure points and systemic threats facing both firms in the 2026 market environment:
1. Market & Competition
NXP Semiconductors N.V.
- Operates globally with diversified semiconductor products across automotive and IoT, facing intense competition from established conglomerates.
Astera Labs, Inc. Common Stock
- Focuses on niche connectivity solutions for cloud and AI infrastructure, competing in a fast-evolving, innovation-driven segment.
2. Capital Structure & Debt
NXP Semiconductors N.V.
- Moderate debt-to-equity ratio at 1.22 signals leverage risk, despite strong interest coverage (7.97).
Astera Labs, Inc. Common Stock
- Virtually no debt, excellent debt-to-assets ratio (0.12), but zero interest coverage hints at no current earnings to service debt.
3. Stock Volatility
NXP Semiconductors N.V.
- Beta at 1.458 indicates above-market volatility; price range relatively stable between $148-$255.
Astera Labs, Inc. Common Stock
- Higher beta at 1.51 shows more susceptibility to market swings; price fluctuates widely from $47 to $263.
4. Regulatory & Legal
NXP Semiconductors N.V.
- Large multinational footprint exposes firm to complex international regulations and export controls.
Astera Labs, Inc. Common Stock
- Early-stage US-based firm faces evolving regulatory scrutiny typical for emerging tech companies.
5. Supply Chain & Operations
NXP Semiconductors N.V.
- Global operations with extensive supply chains vulnerable to geopolitical tensions and semiconductor shortages.
Astera Labs, Inc. Common Stock
- Smaller scale with more agile supply chains; however, dependence on cloud infrastructure partners poses operational risks.
6. ESG & Climate Transition
NXP Semiconductors N.V.
- Established ESG policies needed to address environmental impact across multiple manufacturing sites.
Astera Labs, Inc. Common Stock
- Newer company with limited ESG track record; must build sustainable practices to meet investor expectations.
7. Geopolitical Exposure
NXP Semiconductors N.V.
- Significant exposure to China and Europe increases risk from trade conflicts and regional disruptions.
Astera Labs, Inc. Common Stock
- Primarily US-focused, reducing direct geopolitical risks but still vulnerable to global tech supply chain shifts.
Which company shows a better risk-adjusted profile?
NXP’s largest risk stems from its significant geopolitical exposure and leverage. Astera’s critical risk is its negative profitability and unproven cash flow amid high stock volatility. Despite NXP’s leverage, its diversified operations and positive cash flow create a more balanced risk profile. Astera’s nascent financials and extreme valuation volatility raise caution. Recent data show NXP’s Altman Z-score in the safe zone (3.1), while Astera’s incredibly high Z-score is misleading due to its startup nature. Thus, NXP offers a superior risk-adjusted profile in 2026.
Final Verdict: Which stock to choose?
NXP Semiconductors N.V. (NXPI) wields a superpower in operational efficiency and consistent value creation, underpinned by solid cash flow generation. Its main point of vigilance is the declining return on invested capital, signaling potential pressure on future profitability. NXPI suits portfolios seeking stable, yet growth-oriented semiconductor exposure.
Astera Labs, Inc. (ALAB) commands a strategic moat with its rapid revenue growth and asset-light model, offering a compelling innovation play in emerging tech infrastructure. Compared to NXPI, ALAB carries higher operational risks and negative profitability but benefits from a very strong liquidity position. It fits portfolios targeting high-risk, high-reward growth opportunities.
If you prioritize steady value creation and operational resilience, NXPI outshines as the compelling choice due to its robust cash flow and established market position. However, if you seek aggressive growth and can tolerate volatility, ALAB offers superior upside potential through its rapid expansion and improving profitability trends. Both scenarios demand careful risk management given their distinct financial dynamics.
Disclaimer: Investment carries a risk of loss of initial capital. The past performance is not a reliable indicator of future results. Be sure to understand risks before making an investment decision.
Go Further
I encourage you to read the complete analyses of NXP Semiconductors N.V. and Astera Labs, Inc. Common Stock to enhance your investment decisions: