In the dynamic semiconductor industry, NVIDIA Corporation and Astera Labs, Inc. represent two compelling but distinct investment opportunities. NVIDIA, a global leader in graphics and AI computing, contrasts with Astera Labs, a younger company specializing in semiconductor connectivity solutions for cloud and AI infrastructure. Their shared focus on innovation and technology makes them intriguing to compare. Join me as we explore which company holds the most promise for your investment portfolio.
Table of contents
Companies Overview
I will begin the comparison between NVIDIA Corporation and Astera Labs, Inc. Common Stock by providing an overview of these two companies and their main differences.
NVIDIA Overview
NVIDIA Corporation focuses on providing graphics, compute, and networking solutions worldwide, serving sectors like gaming, professional visualization, datacenter, and automotive markets. Their product lineup includes GeForce GPUs, AI platforms, and automotive AI solutions. Founded in 1993 and headquartered in Santa Clara, California, NVIDIA is a major player in semiconductors with a market cap of approximately 4.46T USD and employs around 36,000 people.
Astera Labs Overview
Astera Labs, Inc. specializes in semiconductor-based connectivity solutions tailored for cloud and AI infrastructure, emphasizing a software-defined architecture for high-performance deployments at scale. Established in 2017 and also based in Santa Clara, California, Astera Labs operates with a smaller workforce of 440 employees. The company’s market cap stands near 29.1B USD, reflecting its emerging role within the semiconductor industry.
Key similarities and differences
Both NVIDIA and Astera Labs operate in the semiconductor industry and are headquartered in Santa Clara, California, focusing on technology solutions for AI and cloud infrastructure. However, NVIDIA’s broader product range spans gaming, professional visualization, and automotive markets, whereas Astera Labs concentrates exclusively on connectivity solutions for cloud and AI systems. Additionally, NVIDIA’s scale and market capitalization vastly exceed those of Astera Labs, reflecting their different market positions and maturity levels.
Income Statement Comparison
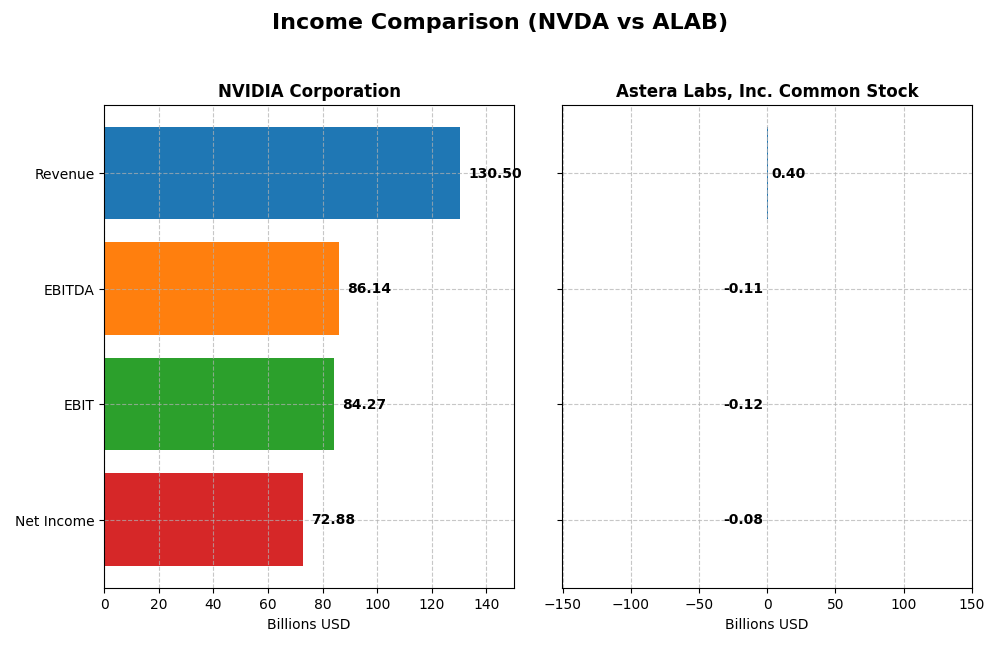
This table presents a side-by-side comparison of the latest fiscal year income statement metrics for NVIDIA Corporation and Astera Labs, Inc. Common Stock, highlighting key financial figures.
| Metric | NVIDIA Corporation | Astera Labs, Inc. Common Stock |
|---|---|---|
| Market Cap | 4.46T | 29.1B |
| Revenue | 130.5B | 396M |
| EBITDA | 86.1B | -113M |
| EBIT | 84.3B | -116M |
| Net Income | 72.9B | -83.4M |
| EPS | 2.97 | -0.64 |
| Fiscal Year | 2025 | 2024 |
Income Statement Interpretations
NVIDIA Corporation
NVIDIA demonstrated strong growth from 2021 to 2025, with revenue soaring from $16.7B to $130.5B and net income climbing from $4.3B to $72.9B. Margins improved markedly, with the net margin reaching 55.85% in 2025. The latest year saw revenue and net income more than double, reflecting robust operational efficiency and margin expansion.
Astera Labs, Inc. Common Stock
Astera Labs showed rapid revenue growth from $80M in 2022 to $396M in 2024, but net income remained negative, at -$83.4M in 2024. While gross margin stayed high at 76.38%, EBIT and net margins were unfavorable, reflecting ongoing operating losses. The most recent year featured accelerated revenue growth but worsening EBIT and EPS trends.
Which one has the stronger fundamentals?
NVIDIA’s income statement exhibits favorable metrics across margins, growth, and profitability, supporting strong fundamentals. Astera Labs, despite revenue growth and solid gross margins, suffers from persistent operating losses and negative net income, resulting in a neutral overall income statement evaluation. Thus, NVIDIA’s fundamentals appear more robust based on the income data provided.
Financial Ratios Comparison
The table below compares key financial ratios for NVIDIA Corporation and Astera Labs, Inc. based on their latest available fiscal year data, providing a snapshot of profitability, liquidity, valuation, and leverage.
| Ratios | NVIDIA Corporation (2025) | Astera Labs, Inc. Common Stock (2024) |
|---|---|---|
| ROE | 91.87% | -8.65% |
| ROIC | 75.28% | -11.97% |
| P/E | 39.90 | -208.41 |
| P/B | 36.66 | 18.02 |
| Current Ratio | 4.44 | 11.71 |
| Quick Ratio | 3.88 | 11.21 |
| D/E | 0.13 | 0.0013 |
| Debt-to-Assets | 9.20% | 0.12% |
| Interest Coverage | 329.77 | 0 |
| Asset Turnover | 1.17 | 0.38 |
| Fixed Asset Turnover | 16.16 | 11.12 |
| Payout ratio | 1.14% | 0% |
| Dividend yield | 0.029% | 0% |
Interpretation of the Ratios
NVIDIA Corporation
NVIDIA shows strong profitability with a net margin of 55.85%, ROE at 91.87%, and ROIC at 75.28%, all favorable. However, valuation ratios like PE (39.9) and PB (36.66) are high and unfavorable. The company maintains a low debt level and solid interest coverage. NVIDIA pays a small dividend with a yield of 0.03%, indicating modest shareholder returns and limited payout risk.
Astera Labs, Inc. Common Stock
Astera Labs exhibits weak financial health, with negative net margin (-21.05%), ROE (-8.65%), and ROIC (-11.97%). Despite a favorable PE ratio due to losses, most ratios, including asset turnover and interest coverage, are unfavorable. The company does not pay dividends, likely reflecting its early growth phase and focus on reinvestment and development.
Which one has the best ratios?
NVIDIA’s ratios are predominantly favorable, reflecting strong profitability, efficient asset use, and low leverage, despite some valuation concerns. Astera Labs’ ratios indicate financial challenges with sustained losses and weak returns. Overall, NVIDIA presents a more robust financial profile compared to Astera Labs based solely on ratio analysis.
Strategic Positioning
This section compares the strategic positioning of NVIDIA and Astera Labs, focusing on market position, key segments, and exposure to technological disruption:
NVIDIA Corporation
- Leading global semiconductor firm with intense competition in GPUs and AI solutions.
- Diverse segments: Data Center, Gaming, Automotive, Professional Visualization.
- High exposure through innovation in AI, HPC, autonomous vehicles, and cloud software.
Astera Labs, Inc. Common Stock
- Smaller semiconductor company focused on cloud and AI infrastructure connectivity.
- Concentrated on Intelligent Connectivity Platform for cloud and AI infrastructure.
- Exposure centered on software-defined architectures for high-performance connectivity.
NVIDIA vs Astera Labs Positioning
NVIDIA adopts a diversified approach across multiple high-growth segments, offering broad market reach and innovation potential. Astera Labs is concentrated on connectivity solutions for cloud and AI infrastructure, with a narrower focus and specialized product portfolio.
Which has the best competitive advantage?
NVIDIA demonstrates a very favorable moat with strong value creation and growing profitability, while Astera Labs shows a slightly unfavorable moat, shedding value despite improving profitability. This indicates NVIDIA has a stronger sustainable competitive advantage.
Stock Comparison
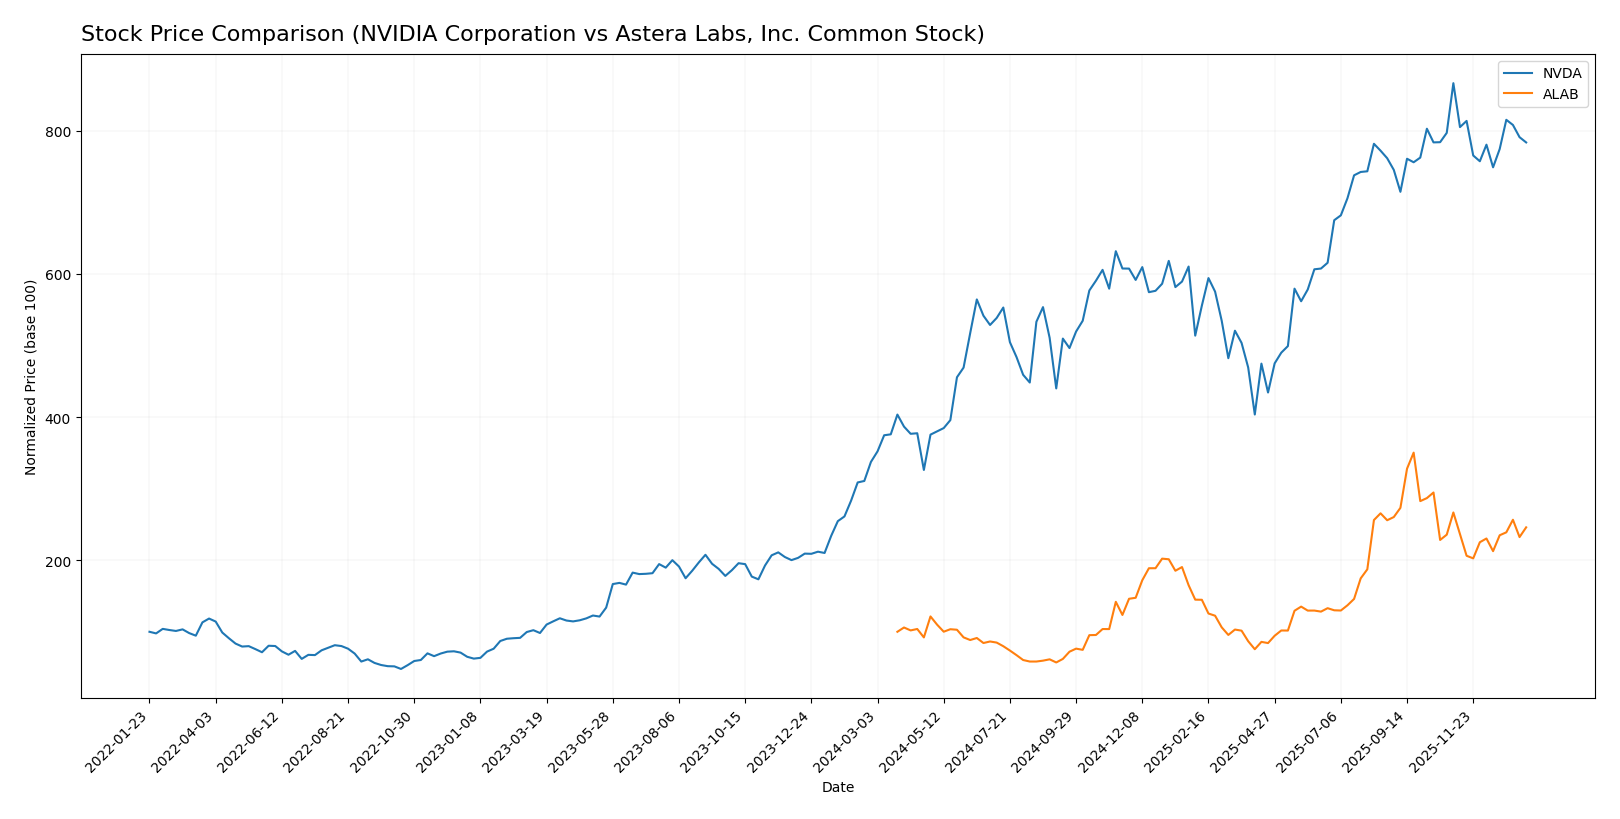
The stock price movements of NVIDIA Corporation and Astera Labs, Inc. Common Stock over the past year reveal significant bullish trends with notable deceleration in momentum and varying recent trading dynamics.
Trend Analysis
NVIDIA Corporation’s stock showed a strong bullish trend over the past 12 months with a 132.35% increase, decelerating towards the end, and a high volatility level marked by a 32.46 standard deviation. The recent three-month period saw a -9.56% decline with a slight negative slope.
Astera Labs, Inc. recorded a 145.91% bullish trend over the same year with higher volatility at 50.11 standard deviation and decelerating acceleration. Its recent trend shows a -7.79% price change but a slight positive slope, indicating some recovery.
Comparing both, Astera Labs delivered the highest market performance with a 145.91% increase versus NVIDIA’s 132.35%, despite both experiencing recent short-term pullbacks.
Target Prices
Analysts present a clear target consensus for NVIDIA Corporation and Astera Labs, Inc., reflecting strong growth expectations.
| Company | Target High | Target Low | Consensus |
|---|---|---|---|
| NVIDIA Corporation | 352 | 140 | 264.34 |
| Astera Labs, Inc. | 225 | 155 | 200.71 |
The target consensus for NVIDIA at 264.34 suggests significant upside from the current price of 183.14, indicating bullish analyst sentiment. Astera Labs’ consensus target of 200.71 also implies potential appreciation from its current price of 172.14, signaling positive outlooks despite recent volatility.
Analyst Opinions Comparison
This section compares analysts’ ratings and grades for NVIDIA Corporation and Astera Labs, Inc. Common Stock:
Rating Comparison
NVIDIA Corporation Rating
- Rating: B+, rated very favorable reflecting strong overall status.
- Discounted Cash Flow Score: Moderate at 3, indicating balanced valuation.
- ROE Score: Very favorable at 5, showing excellent profit generation from equity.
- ROA Score: Very favorable at 5, demonstrating effective asset utilization.
- Debt To Equity Score: Moderate at 3, reflecting average financial risk.
- Overall Score: Moderate at 3, summarizing a balanced financial standing.
Astera Labs, Inc. Common Stock Rating
- Rating: B, also very favorable but slightly lower than NVIDIA.
- Discounted Cash Flow Score: Very unfavorable at 1, suggesting potential overvaluation concerns.
- ROE Score: Favorable at 4, indicating solid but less efficient profit generation.
- ROA Score: Very favorable at 5, equally strong asset efficiency.
- Debt To Equity Score: Favorable at 4, indicating relatively lower financial risk.
- Overall Score: Moderate at 3, reflecting a comparable overall financial position.
Which one is the best rated?
Based strictly on the provided data, NVIDIA holds a higher overall rating (B+ vs. B) with stronger scores in discounted cash flow and return on equity, while Astera Labs shows favorable debt management but weaker valuation metrics.
Scores Comparison
The comparison of the Altman Z-Score and Piotroski Score for NVIDIA Corporation and Astera Labs, Inc. Common Stock is as follows:
NVIDIA Corporation Scores
- Altman Z-Score: 68.04, indicating a safe financial zone with low bankruptcy risk.
- Piotroski Score: 6, reflecting average financial strength and value potential.
Astera Labs, Inc. Common Stock Scores
- Altman Z-Score: 136.88, indicating a safe financial zone with very low bankruptcy risk.
- Piotroski Score: 6, reflecting average financial strength and value potential.
Which company has the best scores?
Both NVIDIA and Astera Labs have Altman Z-Scores placing them in the safe zone, with Astera Labs having a notably higher score. Their Piotroski Scores are identical, reflecting average financial health. Astera Labs has the highest Altman Z-Score, suggesting a stronger financial stability based on this metric alone.
Grades Comparison
Here is a comparison of the latest reliable grades provided by established grading companies for both NVIDIA Corporation and Astera Labs, Inc. Common Stock:
NVIDIA Corporation Grades
The following table summarizes recent grades assigned by well-known financial institutions to NVIDIA Corporation:
| Grading Company | Action | New Grade | Date |
|---|---|---|---|
| Mizuho | Maintain | Outperform | 2026-01-09 |
| Truist Securities | Maintain | Buy | 2025-12-29 |
| Stifel | Maintain | Buy | 2025-12-29 |
| B of A Securities | Maintain | Buy | 2025-12-26 |
| Baird | Maintain | Outperform | 2025-12-26 |
| Bernstein | Maintain | Outperform | 2025-12-26 |
| Truist Securities | Maintain | Buy | 2025-12-19 |
| Tigress Financial | Maintain | Strong Buy | 2025-12-18 |
| Morgan Stanley | Maintain | Overweight | 2025-12-01 |
| Deutsche Bank | Maintain | Hold | 2025-11-20 |
The overall trend for NVIDIA shows predominantly positive grades with multiple “Buy” and “Outperform” ratings, including a “Strong Buy,” indicating broad confidence among analysts.
Astera Labs, Inc. Common Stock Grades
The following table presents recent grades assigned to Astera Labs, Inc. Common Stock by recognized grading companies:
| Grading Company | Action | New Grade | Date |
|---|---|---|---|
| Northland Capital Markets | Maintain | Outperform | 2025-12-09 |
| Northland Capital Markets | Upgrade | Outperform | 2025-11-17 |
| Stifel | Maintain | Buy | 2025-11-05 |
| Morgan Stanley | Maintain | Overweight | 2025-11-05 |
| Roth Capital | Maintain | Buy | 2025-11-05 |
| Needham | Maintain | Buy | 2025-11-05 |
| JP Morgan | Maintain | Overweight | 2025-11-05 |
| TD Cowen | Maintain | Hold | 2025-11-05 |
| Barclays | Downgrade | Equal Weight | 2025-10-20 |
| Stifel | Maintain | Buy | 2025-10-17 |
Astera Labs exhibits a positive grading trend with mostly “Buy” and “Outperform” ratings, although a recent downgrade to “Equal Weight” from Barclays indicates some caution.
Which company has the best grades?
NVIDIA Corporation has received a larger quantity of high-grade ratings, including multiple “Strong Buy” and “Outperform” assessments, compared to Astera Labs, which, while mostly positive, includes a notable recent downgrade. Investors might interpret NVIDIA’s broader and consistently bullish analyst support as a sign of stronger market confidence.
Strengths and Weaknesses
Below is a comparative table summarizing the key strengths and weaknesses of NVIDIA Corporation and Astera Labs, Inc. based on the most recent financial and operational data.
| Criterion | NVIDIA Corporation (NVDA) | Astera Labs, Inc. Common Stock (ALAB) |
|---|---|---|
| Diversification | Highly diversified with strong segments in Data Center (115B), Gaming (11.35B), Automotive (1.69B), and Professional Visualization (1.88B) | Limited diversification, primarily focused on Product sales (393M) with minor Technology Services (3.17M) |
| Profitability | Excellent profitability: Net margin 55.85%, ROIC 75.28%, ROE 91.87% | Negative profitability: Net margin -21.05%, ROIC -11.97%, ROE -8.65% |
| Innovation | Strong innovation demonstrated by very favorable moat status and rapidly growing ROIC (+339%) | Innovation showing promise with growing ROIC (+65%), but overall slightly unfavorable moat and value destruction |
| Global presence | Significant global presence with large-scale data center and gaming markets | Smaller scale business with less global reach compared to NVDA |
| Market Share | Leading market share in GPUs and data center accelerators | Emerging player with niche market share in semiconductor solutions |
Key takeaways: NVIDIA exhibits robust diversification, exceptional profitability, and a durable competitive advantage with strong innovation and global presence. Astera Labs, while showing growth potential and innovation, currently faces profitability challenges and limited diversification, indicating higher investment risk.
Risk Analysis
Below is a comparative overview of key risks for NVIDIA Corporation and Astera Labs, Inc. based on the most recent data available for 2025 and 2024 respectively.
| Metric | NVIDIA Corporation (NVDA) | Astera Labs, Inc. (ALAB) |
|---|---|---|
| Market Risk | High beta (2.31) indicates elevated sensitivity to market swings. | Moderate beta (1.51) shows moderate market volatility exposure. |
| Debt level | Low debt-to-equity ratio (0.13) and strong interest coverage (341x) suggest low financial leverage risk. | Virtually no debt (D/E = 0.0) but zero interest coverage due to losses indicates financial vulnerability. |
| Regulatory Risk | Moderate, with global operations requiring compliance in multiple jurisdictions including US and China. | Emerging company with potential regulatory hurdles in semiconductor industry and cloud infrastructure markets. |
| Operational Risk | Large scale and diversified segments reduce operational risk; however, complexity remains. | Smaller scale and younger company facing higher operational risk and execution challenges. |
| Environmental Risk | Industry exposure to energy consumption and e-waste regulations; active in sustainability initiatives. | Similar industry risks but less public data on environmental policies. |
| Geopolitical Risk | Significant exposure due to China market and supply chain dependencies; US-China tensions impact. | Exposure growing with cloud and AI infrastructure markets, but smaller footprint limits risk magnitude. |
The most impactful risks are market volatility for NVIDIA due to its high beta, and operational and financial risks for Astera Labs given its negative margins and lack of interest coverage. NVIDIA’s geopolitical exposure remains a key concern amid ongoing US-China tensions affecting semiconductor supply chains.
Which Stock to Choose?
NVIDIA Corporation (NVDA) has shown strong income growth with a 114.2% revenue increase in the last year and a robust 1582.36% net income growth over five years. Its financial ratios are largely favorable, including a high return on equity (91.87%) and low debt levels, supported by a very favorable global rating of B+. The company exhibits a very favorable economic moat with a ROIC well above its WACC, signaling durable competitive advantage and efficient capital use.
Astera Labs, Inc. (ALAB) displays rapid revenue growth of 242.24% in the last year but suffers from negative profitability metrics, including a -21.05% net margin and unfavorable returns on equity and invested capital. Its financial ratios are mostly unfavorable, though it holds low debt and a very favorable overall rating of B. The company’s economic moat is slightly unfavorable due to value destruction, despite improving profitability trends.
Investors focused on strong profitability and stable value creation might find NVDA’s robust income growth, favorable financial ratios, and very favorable moat more aligned with their profile. Conversely, those with a higher risk tolerance who prioritize rapid revenue expansion and potential turnaround opportunities could view ALAB’s mixed metrics and improving profitability as a speculative consideration.
Disclaimer: Investment carries a risk of loss of initial capital. The past performance is not a reliable indicator of future results. Be sure to understand risks before making an investment decision.
Go Further
I encourage you to read the complete analyses of NVIDIA Corporation and Astera Labs, Inc. Common Stock to enhance your investment decisions: