Home > Comparison > Technology > ALAB vs NVEC
The strategic rivalry between Astera Labs, Inc. and NVE Corporation shapes the semiconductor sector’s evolution. Astera Labs operates as a capital-intensive innovator focusing on cloud and AI infrastructure connectivity. In contrast, NVE Corporation specializes in niche spintronic sensors for industrial and medical applications, emphasizing precision and customization. This analysis pits growth-driven platform scale against specialized technology leadership to identify which trajectory delivers superior risk-adjusted returns for a diversified technology portfolio.
Table of contents
Companies Overview
Astera Labs and NVE Corporation both play pivotal roles in the semiconductor industry, shaping innovation in connectivity and sensor technology.
Astera Labs, Inc.: Cloud and AI Connectivity Innovator
Astera Labs leads in semiconductor-based connectivity solutions for cloud and AI infrastructure. Its revenue stems from Intelligent Connectivity Platform products, blending data, network, and memory connectivity. In 2026, the company focuses sharply on scaling high-performance cloud systems through its software-defined architecture that enhances deployment and operation efficiency.
NVE Corporation: Spintronics Sensor Specialist
NVE Corporation specializes in spintronic devices that leverage electron spin for data acquisition and transmission. Its core earnings come from sensors and couplers used in factory automation, medical devices, and industrial IoT. In 2026, NVE emphasizes advancing spintronic technology and expanding applications in both standard and custom sensors across diverse markets.
Strategic Collision: Similarities & Divergences
Both firms innovate within semiconductors but diverge in approach: Astera Labs builds integrated connectivity platforms targeting cloud infrastructure, while NVE pursues specialized spintronic sensors aimed at niche industrial and medical uses. The primary battleground is technological leadership in high-growth sectors—AI infrastructure versus IoT and automation. Their investment profiles differ sharply: Astera Labs offers scale and expansion potential, while NVE provides focused niche expertise and steady dividend income.
Income Statement Comparison
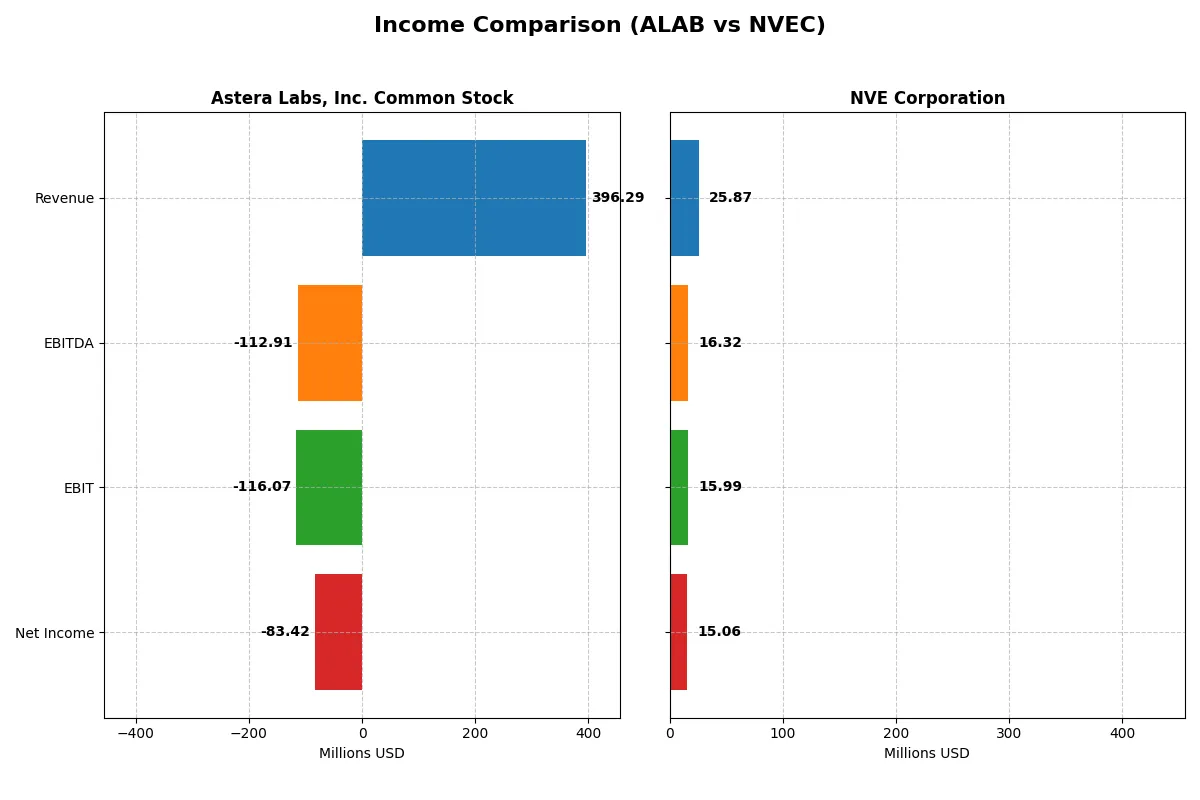
This data dissects the core profitability and scalability of both corporate engines to reveal who dominates the bottom line:
| Metric | Astera Labs, Inc. Common Stock (ALAB) | NVE Corporation (NVEC) |
|---|---|---|
| Revenue | 396.3M | 25.9M |
| Cost of Revenue | 93.6M | 4.2M |
| Operating Expenses | 418.8M | 5.6M |
| Gross Profit | 302.7M | 21.6M |
| EBITDA | -112.9M | 16.3M |
| EBIT | -116.1M | 16.0M |
| Interest Expense | 0 | 0 |
| Net Income | -83.4M | 15.1M |
| EPS | -0.64 | 3.12 |
| Fiscal Year | 2024 | 2025 |
Income Statement Analysis: The Bottom-Line Duel
This income statement comparison reveals the true efficiency and profitability dynamics driving each company’s financial engine.
Astera Labs, Inc. Common Stock Analysis
Astera Labs grew revenue sharply from $80M in 2022 to $396M in 2024, but net income remained negative, widening losses to -$83M in 2024. Gross margin stays healthy at 76.4%, yet operating and net margins are deeply negative, reflecting heavy R&D and SG&A expenses undermining profitability momentum.
NVE Corporation Analysis
NVE Corporation shows stable revenue around $21M-$38M from 2021 to 2025, with a slight dip to $26M in 2025. It maintains robust gross margin at 83.6% and an exceptional net margin above 58%. Net income grew overall to $15M in 2025, demonstrating strong operational efficiency and consistent profit generation despite minor recent revenue softness.
Margin Strength vs. Revenue Surge
NVE clearly outperforms Astera Labs on profitability, boasting superior margins and positive net income growth. Astera Labs’ rapid revenue expansion comes with persistent losses and negative operating leverage. For investors, NVE’s profile offers steady, high-margin earnings, while Astera Labs remains a higher-risk growth story still struggling to translate sales into profits.
Financial Ratios Comparison
These vital ratios act as a diagnostic tool to expose the underlying fiscal health, valuation premiums, and capital efficiency of each company:
| Ratios | Astera Labs, Inc. (ALAB) | NVE Corporation (NVEC) |
|---|---|---|
| ROE | -8.65% (2024) | 24.19% (2025) |
| ROIC | -11.97% (2024) | 21.14% (2025) |
| P/E | -208.4 (2024) | 20.46 (2025) |
| P/B | 18.02 (2024) | 4.95 (2025) |
| Current Ratio | 11.71 (2024) | 28.40 (2025) |
| Quick Ratio | 11.21 (2024) | 22.03 (2025) |
| D/E | 0.0013 (2024) | 0.0148 (2025) |
| Debt-to-Assets | 0.12% (2024) | 1.43% (2025) |
| Interest Coverage | 0 (2024) | 0 (2025) |
| Asset Turnover | 0.38 (2024) | 0.40 (2025) |
| Fixed Asset Turnover | 11.12 (2024) | 8.91 (2025) |
| Payout ratio | 0% (2024) | 128.38% (2025) |
| Dividend yield | 0% (2024) | 6.28% (2025) |
| Fiscal Year | 2024 | 2025 |
Efficiency & Valuation Duel: The Vital Signs
Ratios act as a company’s DNA, revealing hidden risks and operational excellence through profitability and valuation metrics.
Astera Labs, Inc. Common Stock
Astera Labs shows unfavorable profitability with negative ROE (-8.65%) and net margin (-21.05%), indicating operational struggles. Its valuation appears stretched with a highly negative P/E (-208.41) but a high P/B (18.02). The firm reinvests heavily in R&D, foregoing dividends, aiming for future growth despite current inefficiencies.
NVE Corporation
NVE Corporation demonstrates strong profitability with a 24.19% ROE and 58.22% net margin, reflecting efficient operations. Its valuation is moderate, with a P/E at 20.46 but a relatively high P/B of 4.95. The company supports shareholders with a 6.28% dividend yield, balancing returns with solid capital allocation and growth.
Profitability Strength vs. Growth Ambition
NVE delivers a superior balance of profitability and valuation, exhibiting operational efficiency and shareholder rewards. Astera Labs faces significant profitability challenges but invests aggressively in growth. Investors seeking stability may lean toward NVE, while those favoring high-growth potential might consider Astera’s riskier profile.
Which one offers the Superior Shareholder Reward?
Astera Labs (ALAB) pays no dividends and reports negative margins, signaling ongoing losses and no capital returned to shareholders. Its buyback activity is absent, reflecting a reinvestment focus likely on R&D and growth. NVE Corporation (NVEC) delivers a healthy dividend yield around 4.5–7.3%, with payout ratios slightly above 100%, indicating aggressive distribution funded by strong free cash flow (~$2.7–$3.7 per share). NVEC also sustains robust buybacks, enhancing total shareholder return. I see NVEC’s model as more sustainable, balancing yield and buybacks with solid profitability and cash flow. ALAB’s absence of distributions and persistent losses raise risk for income-seeking investors. In 2026, NVEC clearly offers the superior total shareholder reward.
Comparative Score Analysis: The Strategic Profile
The radar chart reveals the fundamental DNA and trade-offs of Astera Labs and NVE Corporation, highlighting their distinct financial strengths and valuation approaches:
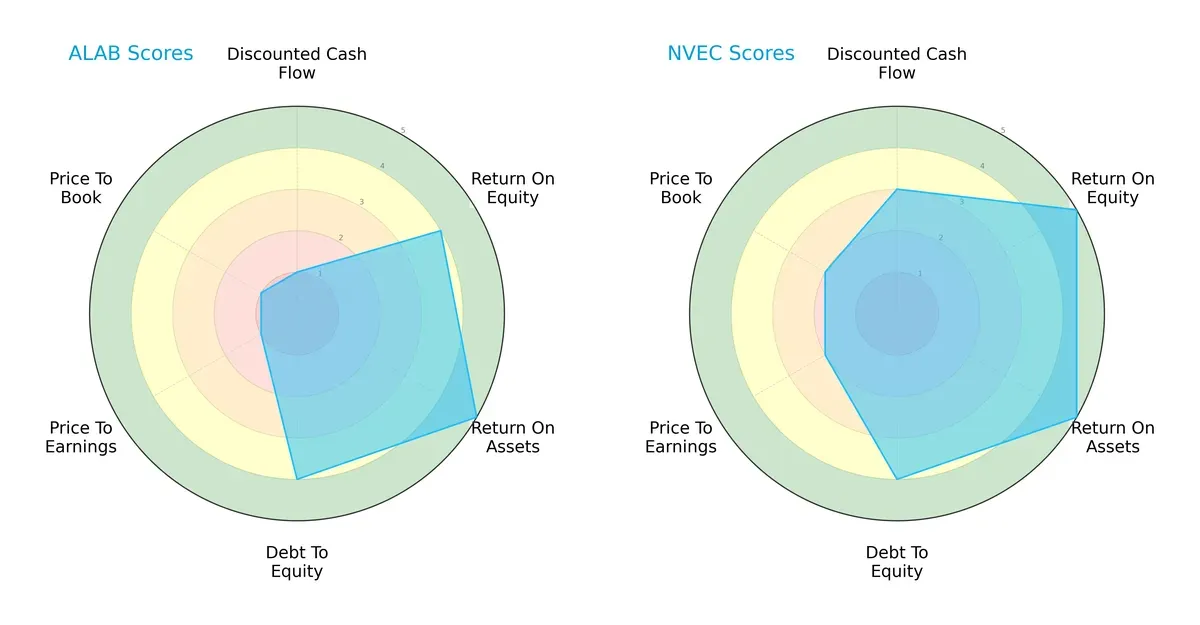
NVE Corporation leads with a more balanced profile, scoring higher in overall metrics including a solid DCF (3 vs. 1) and better valuation scores (P/E 2 vs. 1, P/B 2 vs. 1). Astera Labs leans heavily on asset efficiency (ROA 5) but struggles with valuation metrics and cash flow projections. NVE’s superior ROE (5 vs. 4) and consistent debt-to-equity score (4) underpin its financial stability advantage.
—
Bankruptcy Risk: Solvency Showdown
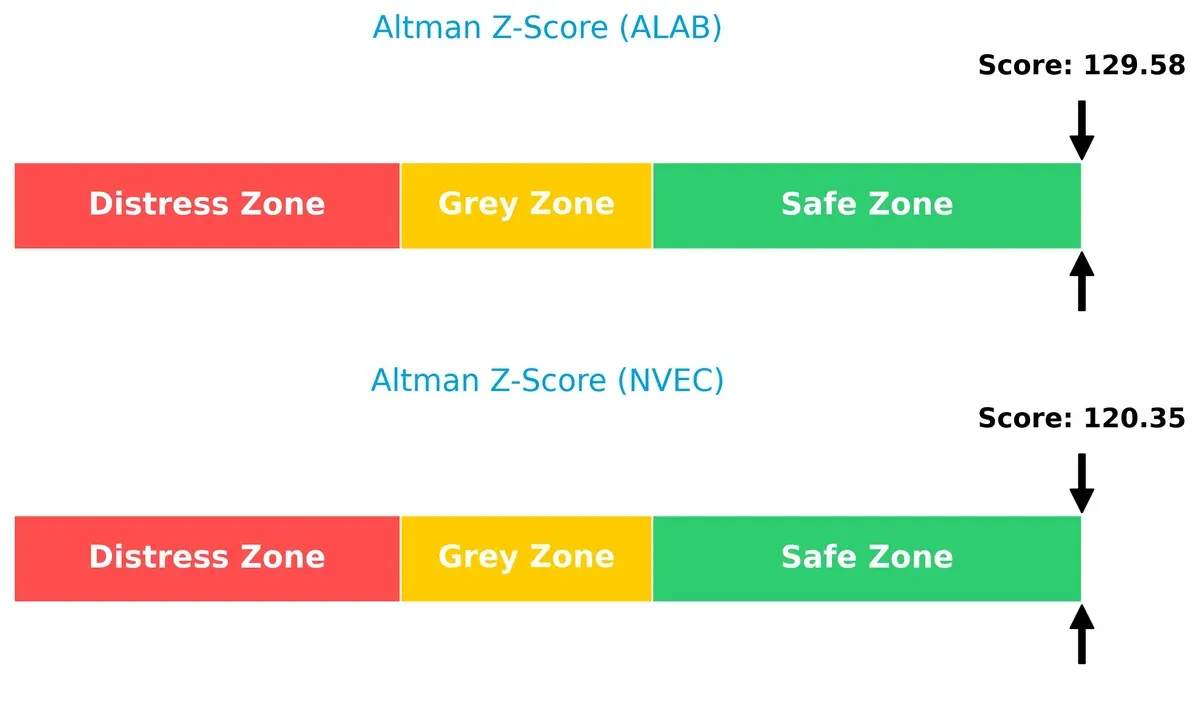
Both firms sit comfortably in the safe zone with Altman Z-Scores above 120, signaling extremely low bankruptcy risk in the current economic cycle:
—
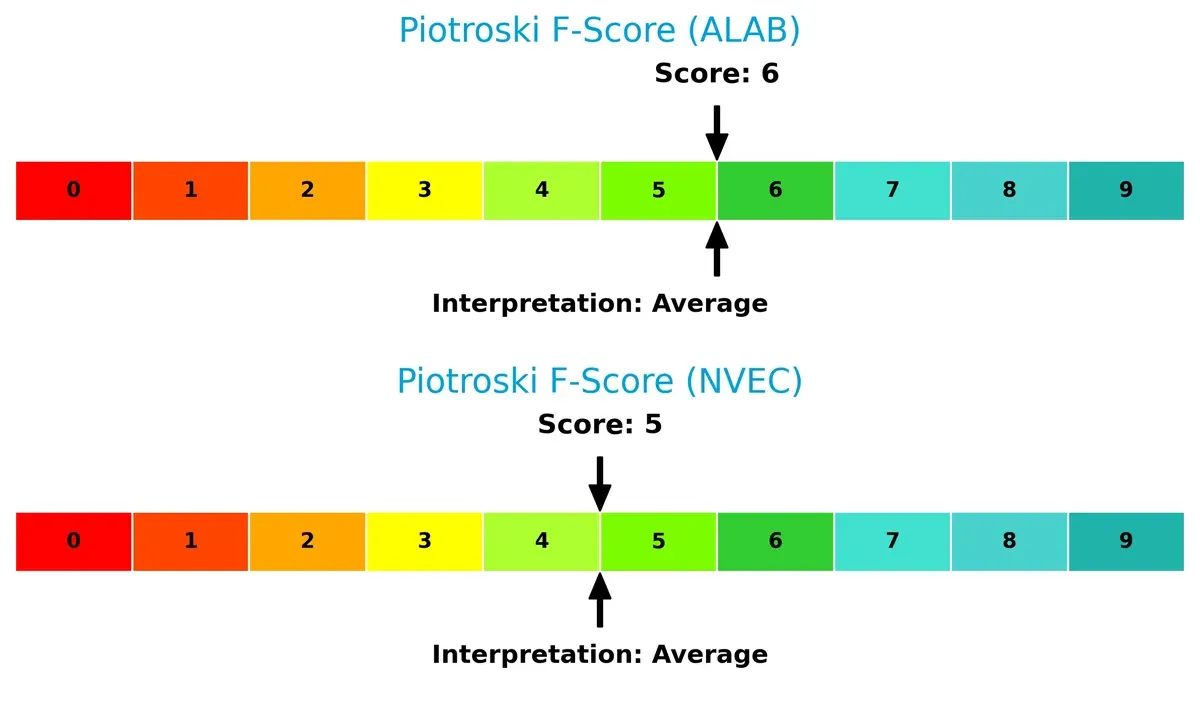
Financial Health: Quality of Operations
Astera Labs scores 6 on Piotroski’s scale, slightly outperforming NVE’s 5, but both remain in the average range, suggesting neither company shows acute financial red flags:
How are the two companies positioned?
This section dissects ALAB and NVEC’s operational DNA by comparing revenue distribution and internal dynamics. The goal is to confront their economic moats and reveal which model delivers the most resilient competitive advantage today.
Revenue Segmentation: The Strategic Mix
This visual comparison dissects how Astera Labs and NVE Corporation diversify their income streams and where their primary sector bets lie:
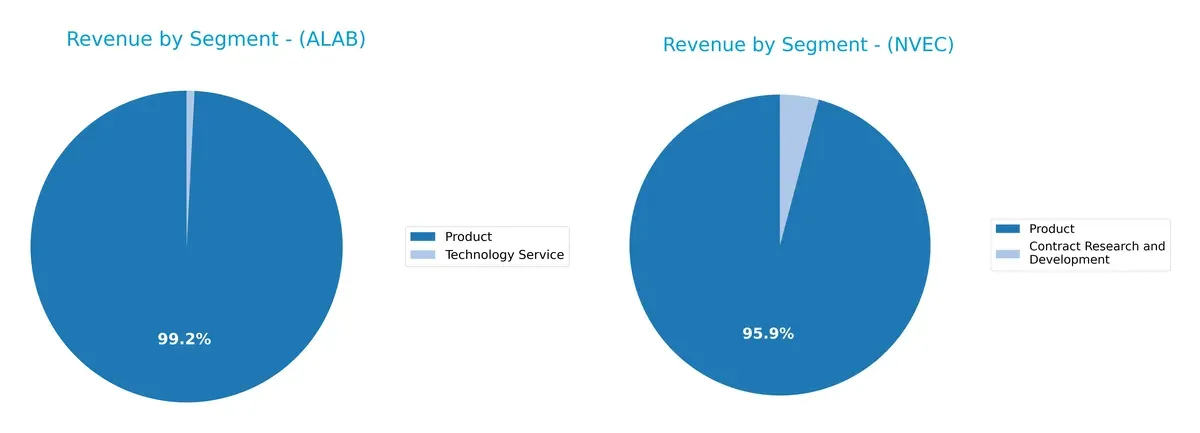
Astera Labs anchors its revenue heavily on Product sales with $393M, while Technology Services contribute a mere $3.2M. NVE Corporation shows a more balanced mix, with Products at $25.9M and Contract Research and Development at $1.1M. Astera Labs’ concentration suggests strong infrastructure dominance but higher concentration risk. NVE’s diversified base signals strategic flexibility and mitigates reliance on a single segment.
Strengths and Weaknesses Comparison
This table compares the Strengths and Weaknesses of Astera Labs (ALAB) and NVE Corporation (NVEC):
ALAB Strengths
- High quick ratio at 11.21 supports liquidity
- Zero debt enhances financial stability
- Low debt-to-assets ratio at 0.12 reduces financial risk
- Strong fixed asset turnover at 11.12 indicates efficient use of fixed assets
NVEC Strengths
- Strong net margin at 58.22% reflects high profitability
- Robust ROE of 24.19% signals effective equity use
- Healthy ROIC at 21.14% surpasses cost of capital
- Favorable interest coverage ensures debt serviceability
- Low debt-to-assets ratio at 1.43% limits leverage risk
- High fixed asset turnover at 8.91 shows capital efficiency
ALAB Weaknesses
- Negative net margin (-21.05%) signals losses
- Negative ROE (-8.65%) reflects shareholder value destruction
- ROIC (-11.97%) below WACC (10.93%) indicates poor capital allocation
- Extremely high price-to-book ratio at 18.02 suggests overvaluation
- Low asset turnover at 0.38 limits revenue generation
- Zero interest coverage risks financial distress
NVEC Weaknesses
- High current ratio at 28.4 may indicate inefficient asset use
- Price-to-book ratio at 4.95 considered elevated
- Asset turnover at 0.4 is low, limiting sales efficiency
Both companies show distinct profiles: ALAB excels in liquidity and low leverage but struggles with profitability and capital efficiency. NVEC demonstrates strong profitability metrics and prudent leverage but faces challenges in asset utilization and valuation ratios. These contrasts reflect differing strategic focuses and operational efficiencies.
The Moat Duel: Analyzing Competitive Defensibility
A structural moat is the only true defense against profit erosion from competition. It defines sustainable advantage and long-term value creation:
Astera Labs, Inc. Common Stock: Software-Defined Connectivity Moat
Astera Labs leverages intangible assets through its Intelligent Connectivity Platform. Its high gross margins (76%) indicate pricing power despite negative net margins. Expanding cloud and AI infrastructure markets in 2026 could deepen this moat, yet profitability remains a challenge.
NVE Corporation: Spintronics Innovation Moat
NVE’s moat stems from proprietary spintronic technology, a niche with high barriers to entry unlike Astera’s broader platform approach. Strong ROIC exceeding WACC by 12% and stable 58% net margins showcase efficient capital use and robust value creation. Expansion into industrial IoT offers growth potential.
Proprietary Technology vs. Software Ecosystem: Who Defends Better?
NVE’s durable, value-creating moat outpaces Astera Labs’ emerging but currently value-destroying advantage. NVE’s superior capital efficiency and margin stability position it better to defend market share in 2026 and beyond. Astera’s moat is promising but not yet proven financially.
Which stock offers better returns?
The past year reveals contrasting dynamics: Astera Labs surged over 115%, showing accelerating momentum, while NVE Corporation declined nearly 19%, despite a recent modest rebound.
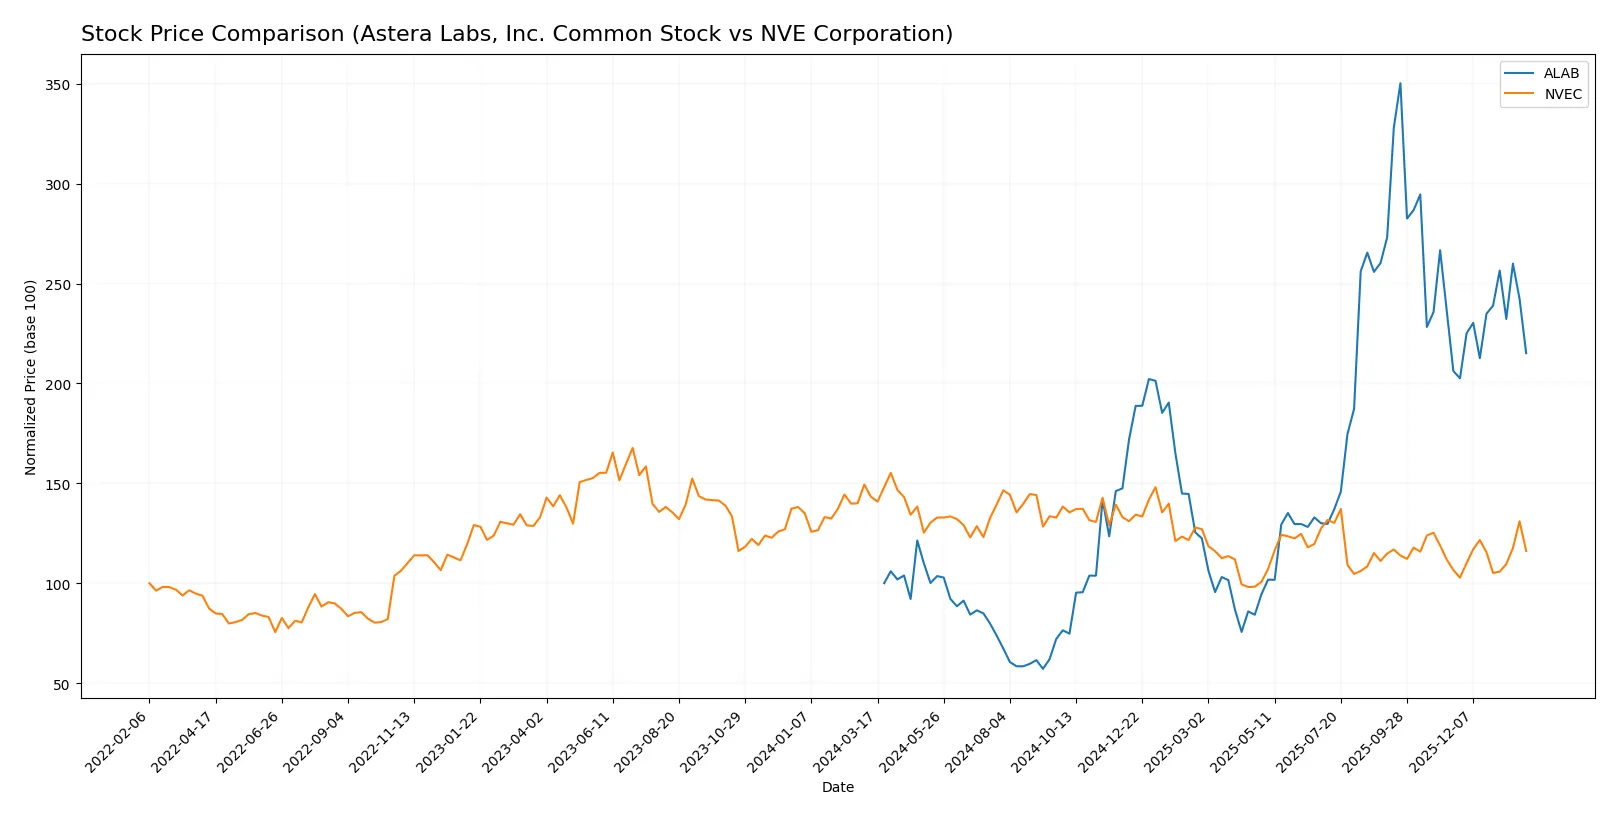
Trend Comparison
Astera Labs, Inc. stock gained 115.17% over the past year, confirming a bullish trend with accelerating price momentum and a notable high of 245.2. Price volatility is elevated with a standard deviation of 50.39.
NVE Corporation’s shares fell 18.93% in the same period, marking a bearish trend with acceleration. The stock’s highest price was 90.18, and volatility remained moderate at 7.6 standard deviation.
Astera Labs delivered significantly higher returns than NVE Corporation over the past year. Its strong upward trend contrasts with NVE’s declining performance despite a recent upturn.
Target Prices
Astera Labs, Inc. shows a robust analyst target consensus, reflecting bullish sentiment.
| Company | Target Low | Target High | Consensus |
|---|---|---|---|
| Astera Labs, Inc. | 165 | 225 | 202.14 |
Analysts expect Astera Labs to trade significantly above its current price of 150.62, implying upside potential near 34%. No verified target price data is available for NVE Corporation.

Don’t Let Luck Decide Your Entry Point
Optimize your entry points with our advanced ProRealTime indicators. You’ll get efficient buy signals with precise price targets for maximum performance. Start outperforming now!
How do institutions grade them?
The following section compares institutional grades for Astera Labs, Inc. Common Stock and NVE Corporation:
Astera Labs, Inc. Common Stock Grades
The table below summarizes recent grades assigned by reputable institutions to Astera Labs:
| Grading Company | Action | New Grade | Date |
|---|---|---|---|
| Northland Capital Markets | maintain | Outperform | 2025-12-09 |
| Northland Capital Markets | upgrade | Outperform | 2025-11-17 |
| Needham | maintain | Buy | 2025-11-05 |
| JP Morgan | maintain | Overweight | 2025-11-05 |
| TD Cowen | maintain | Hold | 2025-11-05 |
| Morgan Stanley | maintain | Overweight | 2025-11-05 |
| Roth Capital | maintain | Buy | 2025-11-05 |
| Stifel | maintain | Buy | 2025-11-05 |
| Barclays | downgrade | Equal Weight | 2025-10-20 |
| Stifel | maintain | Buy | 2025-10-17 |
NVE Corporation Grades
No reliable institutional grades are available for NVE Corporation.
Which company has the best grades?
Astera Labs clearly leads with multiple upgrades and predominantly bullish ratings. In contrast, NVE Corporation lacks institutional grade data, limiting investor insight. This disparity may affect perceived risk and confidence.
Risks specific to each company
The following categories identify the critical pressure points and systemic threats facing both firms in the 2026 market environment:
1. Market & Competition
Astera Labs, Inc. Common Stock
- Faces intense competition in semiconductor connectivity for cloud and AI infrastructure, a rapidly evolving and capital-intensive market.
NVE Corporation
- Operates in niche spintronics with less direct competition but limited market size and growth compared to mainstream semiconductors.
2. Capital Structure & Debt
Astera Labs, Inc. Common Stock
- Zero debt, very low debt-to-assets (0.12%), but weak interest coverage and unfavorable capital efficiency metrics.
NVE Corporation
- Minimal debt (debt-to-assets 1.43%), strong interest coverage, and solid capital structure support financial stability.
3. Stock Volatility
Astera Labs, Inc. Common Stock
- High beta at 1.51 indicates elevated price volatility, with a wide trading range and significant recent price decline.
NVE Corporation
- Moderate beta at 1.20 suggests less volatility, with a narrower trading range and smaller recent price drops.
4. Regulatory & Legal
Astera Labs, Inc. Common Stock
- Subject to evolving technology regulations impacting cloud and AI sectors, with potential IP risks in software-defined architectures.
NVE Corporation
- Faces regulatory scrutiny mainly in medical and industrial applications but benefits from stable niche market protections.
5. Supply Chain & Operations
Astera Labs, Inc. Common Stock
- Supply chain risks inherent in semiconductor manufacturing, including reliance on advanced foundry partners and component shortages.
NVE Corporation
- Smaller scale eases supply chain complexity but exposes firm to risks from specialized material sourcing and limited supplier diversity.
6. ESG & Climate Transition
Astera Labs, Inc. Common Stock
- Growing pressure to adopt sustainable manufacturing and reduce carbon footprint in the high-energy cloud infrastructure segment.
NVE Corporation
- Faces moderate ESG risks with opportunities in energy-efficient spintronic technologies that align with climate goals.
7. Geopolitical Exposure
Astera Labs, Inc. Common Stock
- U.S.-based with exposure to global semiconductor supply chain disruptions and export restrictions affecting AI hardware components.
NVE Corporation
- Also U.S.-based, with limited international operations reducing geopolitical risk but dependent on global industrial markets.
Which company shows a better risk-adjusted profile?
Astera Labs faces high market competition and stock volatility risks, while NVE holds strong financial metrics and lower volatility. NVE’s minimal debt and favorable profitability provide a more balanced risk-adjusted profile. Astera’s key risk is negative profitability undermining capital efficiency; NVE’s main concern lies in its smaller niche market size. The recent sharp price decline in Astera Labs highlights investor wariness about its path to profitability. Overall, NVE offers a safer investment with stronger financial resilience in 2026’s challenging semiconductor landscape.
Final Verdict: Which stock to choose?
Astera Labs (ALAB) boasts unmatched revenue growth and a bullish price momentum that signals strong market interest. Its core strength lies in rapid innovation and aggressive R&D investment. However, its ongoing value destruction and profitability challenges remain points of vigilance. ALAB suits investors with an appetite for high-risk, aggressive growth plays aiming for market disruption.
NVE Corporation (NVEC) commands a durable moat through consistent value creation, supported by a robust ROIC well above its cost of capital. Its strong income quality and financial stability offer a safety cushion relative to ALAB. NVEC fits well within a GARP (Growth at a Reasonable Price) portfolio focused on steady returns and capital preservation.
If you prioritize capturing explosive growth and can tolerate near-term profitability volatility, Astera Labs offers an intriguing scenario due to its accelerating revenue trajectory. However, if you seek superior stability and proven value creation with a durable competitive advantage, NVE Corporation outshines as the more prudent choice. Both demand careful risk assessment aligned with your investment horizon.
Disclaimer: Investment carries a risk of loss of initial capital. The past performance is not a reliable indicator of future results. Be sure to understand risks before making an investment decision.
Go Further
I encourage you to read the complete analyses of Astera Labs, Inc. Common Stock and NVE Corporation to enhance your investment decisions: