Micron Technology, Inc. (MU) and Astera Labs, Inc. (ALAB) are two prominent players in the semiconductor industry, each carving a unique niche with innovative solutions. Micron offers a broad range of memory and storage products, while Astera Labs focuses on cutting-edge connectivity for cloud and AI infrastructure. This comparison highlights their market overlap and innovation strategies to help you identify the most compelling investment opportunity today.
Table of contents
Companies Overview
I will begin the comparison between Micron Technology and Astera Labs by providing an overview of these two companies and their main differences.
Micron Technology Overview
Micron Technology, Inc. is a leading global semiconductor company specializing in the design, manufacture, and sale of memory and storage products. With a diverse portfolio including DRAM, NAND, and NOR memory technologies, Micron serves various markets such as cloud servers, mobile devices, automotive, and industrial sectors. Founded in 1978 and headquartered in Boise, Idaho, Micron operates through multiple business units focused on compute, mobile, storage, and embedded solutions.
Astera Labs Overview
Astera Labs, Inc. focuses on semiconductor-based connectivity solutions tailored for cloud and AI infrastructure. Its Intelligent Connectivity Platform offers data, network, and memory connectivity products built on a software-defined architecture to optimize high-performance cloud and AI deployments at scale. Established in 2017 and based in Santa Clara, California, Astera Labs is a smaller, more specialized player in the semiconductor industry.
Key similarities and differences
Both Micron and Astera Labs operate within the semiconductor industry and serve technology-driven markets, emphasizing memory and connectivity products. However, Micron has a broader product range and established market presence with a large workforce and diverse applications, while Astera Labs concentrates on connectivity solutions for cloud and AI infrastructure with a smaller team and more recent market entry. Their business models differ in scale, product scope, and market focus.
Income Statement Comparison
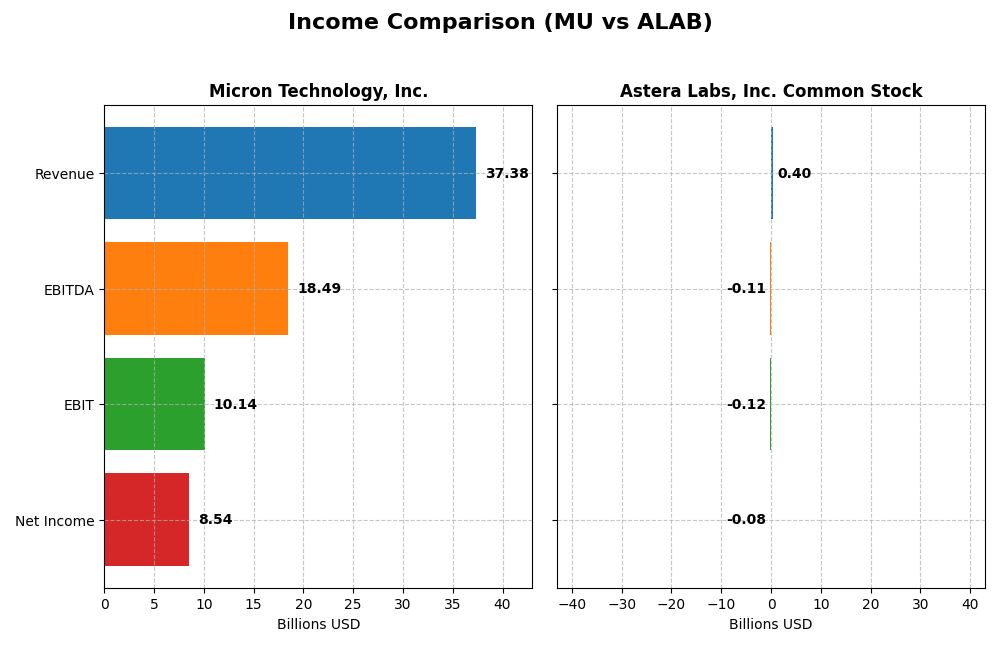
This table presents a side-by-side comparison of the most recent fiscal year income statement metrics for Micron Technology, Inc. and Astera Labs, Inc. Common Stock.
| Metric | Micron Technology, Inc. | Astera Labs, Inc. Common Stock |
|---|---|---|
| Market Cap | 373B | 29B |
| Revenue | 37.4B | 396M |
| EBITDA | 18.5B | -113M |
| EBIT | 10.1B | -116M |
| Net Income | 8.54B | -83M |
| EPS | 7.65 | -0.64 |
| Fiscal Year | 2025 | 2024 |
Income Statement Interpretations
Micron Technology, Inc.
Micron Technology showed overall growth in revenue and net income from 2021 to 2025, with revenue rising from $27.7B to $37.4B and net income improving from $5.9B to $8.5B. Margins remained strong, with gross margin near 40% and a net margin of 22.8% in 2025. The latest year saw significant growth acceleration, especially in net income and EPS, reflecting improved profitability.
Astera Labs, Inc. Common Stock
Astera Labs experienced rapid revenue growth, increasing from $79.9M in 2022 to $396.3M in 2024. However, net income remained negative, widening its net loss from $58.3M to $83.4M. While the gross margin was high at 76.4%, negative EBIT and net margins persisted in 2024. The recent year showed strong top-line growth but continued operating losses and unfavorable profitability metrics.
Which one has the stronger fundamentals?
Micron Technology exhibits stronger fundamentals with consistent revenue and net income growth, favorable margins, and positive operating income. In contrast, Astera Labs shows impressive revenue expansion but sustained losses and negative margins. Micron’s stable profitability and margin improvements contrast with Astera’s mixed results, indicating Micron’s more solid financial foundation in this comparison.
Financial Ratios Comparison
The table below presents a side-by-side comparison of key financial ratios for Micron Technology, Inc. (MU) and Astera Labs, Inc. Common Stock (ALAB) based on their most recent fiscal year data.
| Ratios | Micron Technology, Inc. (MU) 2025 | Astera Labs, Inc. (ALAB) 2024 |
|---|---|---|
| ROE | 15.8% | -8.6% |
| ROIC | 12.1% | -12.0% |
| P/E | 15.9 | -208.4 |
| P/B | 2.51 | 18.0 |
| Current Ratio | 2.52 | 11.7 |
| Quick Ratio | 1.79 | 11.2 |
| D/E | 0.28 | 0.0013 |
| Debt-to-Assets | 18.5% | 0.12% |
| Interest Coverage | 20.7 | 0 |
| Asset Turnover | 0.45 | 0.38 |
| Fixed Asset Turnover | 0.79 | 11.1 |
| Payout ratio | 6.1% | 0 |
| Dividend yield | 0.38% | 0 |
Interpretation of the Ratios
Micron Technology, Inc.
Micron Technology displays mostly favorable financial ratios, including a strong net margin of 22.84% and return on equity at 15.76%, indicating solid profitability and efficient capital use. However, the company has some weaknesses, such as an unfavorable asset turnover and dividend yield at 0.38%. Micron pays dividends with a modest yield, balanced by a cautious payout and buyback approach.
Astera Labs, Inc. Common Stock
Astera Labs shows predominantly unfavorable ratios, including a negative net margin of -21.05% and return on equity of -8.65%, reflecting operational losses and weak profitability. The company does not pay dividends, likely due to its reinvestment strategy and growth phase, focusing heavily on R&D. Favorable metrics include zero debt-to-equity and strong fixed asset turnover, but liquidity ratios are mixed.
Which one has the best ratios?
Micron Technology outperforms Astera Labs with a majority of favorable ratios, reflecting stronger profitability, capital efficiency, and financial health. Astera Labs faces challenges with negative returns and losses, typical for a growth-focused firm without dividends. Overall, Micron’s financial profile appears more balanced and stable compared to Astera Labs.
Strategic Positioning
This section compares the strategic positioning of Micron Technology, Inc. and Astera Labs, Inc., including market position, key segments, and exposure to technological disruption:
Micron Technology, Inc.
- Large market cap of $373B, faces competitive pressure in semiconductors.
- Diverse segments: DRAM, NAND, Compute, Mobile, Storage, and Embedded units drive revenue.
- Exposure to disruption through memory and storage tech evolution.
Astera Labs, Inc. Common Stock
- Smaller $29B market cap, competes in niche semiconductor connectivity.
- Focused on semiconductor connectivity for cloud and AI infrastructure.
- Faces disruption risks in evolving cloud and AI connectivity platforms.
Micron Technology, Inc. vs Astera Labs, Inc. Positioning
Micron operates diversified across multiple memory and storage segments with a large global footprint, while Astera Labs concentrates on semiconductor connectivity solutions for cloud and AI. Micron’s broader base contrasts with Astera’s specialized focus and smaller scale.
Which has the best competitive advantage?
Both companies are currently shedding value, but Micron shows a slightly favorable moat with growing ROIC, whereas Astera Labs has a slightly unfavorable moat despite improving profitability. Micron’s scale and segment diversity suggest a more stable competitive position.
Stock Comparison
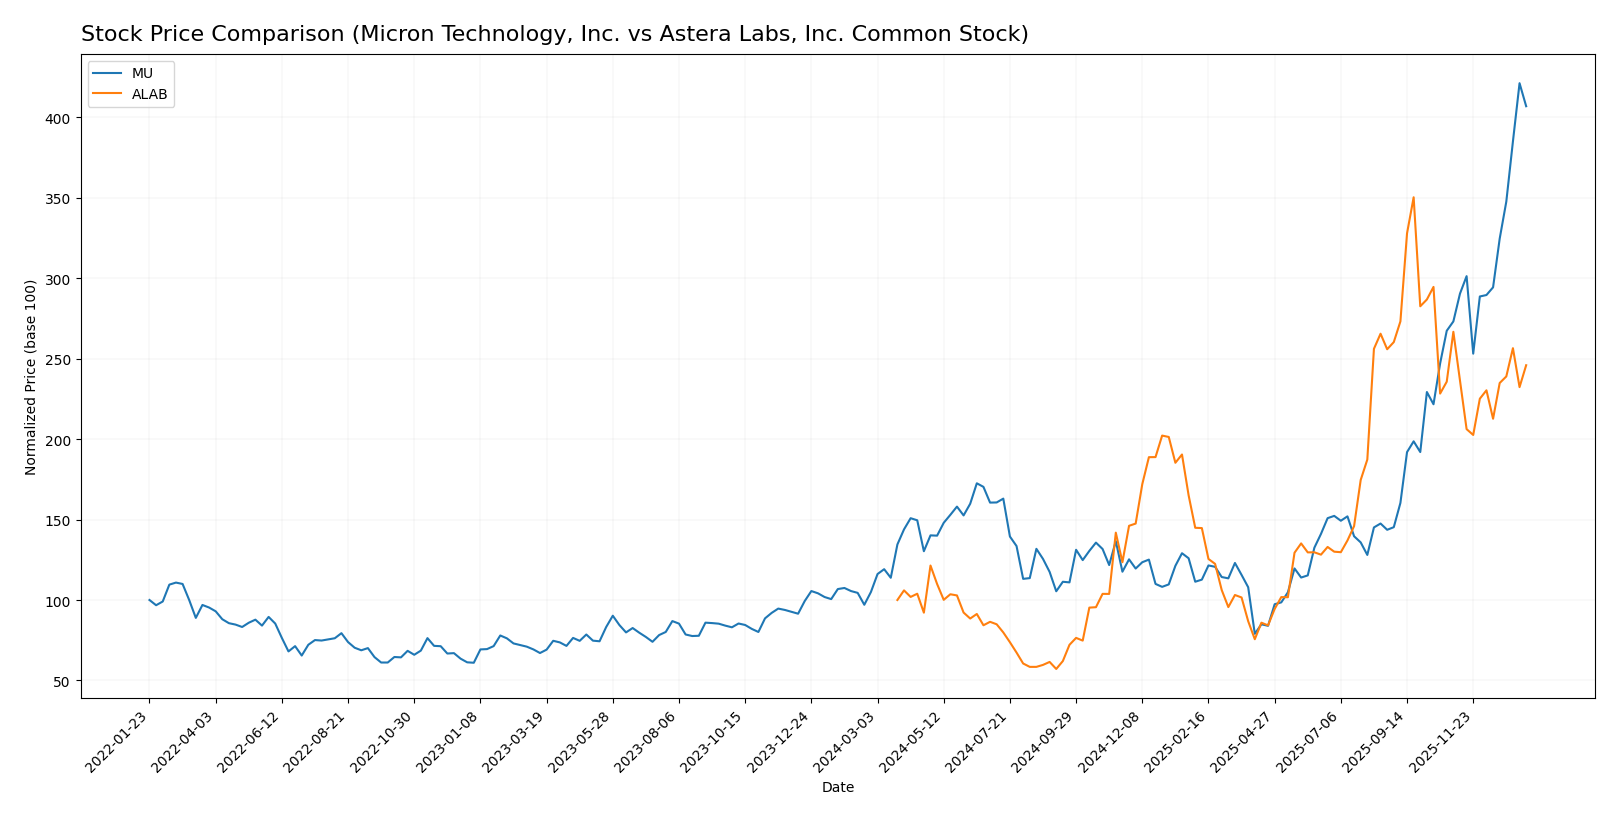
The stock price movements over the past year reveal strong bullish momentum for Micron Technology, Inc. (MU) with significant acceleration, while Astera Labs, Inc. (ALAB) shows a bullish trend but with deceleration and recent mild negative returns.
Trend Analysis
Micron Technology, Inc. (MU) exhibited a robust bullish trend over the past 12 months with a 287.62% price increase and accelerating gains, reaching a high of 345.09 and showing strong buyer dominance. Recent weeks confirm continued upward momentum with a 48.97% rise.
Astera Labs, Inc. (ALAB) showed a bullish trend over 12 months with a 145.91% gain but decelerating momentum. The stock recently declined by 7.79%, reflecting a mild bearish shift, and buyer activity has become neutral.
Comparing both stocks, Micron Technology delivered the highest market performance over the past year, outperforming Astera Labs significantly in both price appreciation and recent buyer dominance.
Target Prices
Here is the current analyst consensus on target prices for Micron Technology, Inc. and Astera Labs, Inc.
| Company | Target High | Target Low | Consensus |
|---|---|---|---|
| Micron Technology, Inc. | 450 | 190 | 328.22 |
| Astera Labs, Inc. Common Stock | 225 | 155 | 200.71 |
Analysts expect Micron’s price to remain near its current level of 333.35 USD, while Astera Labs is projected to rise from 172.14 USD toward its consensus target of 200.71 USD. Overall, targets suggest moderate upside potential balanced with some downside risk.
Analyst Opinions Comparison
This section compares analysts’ ratings and key financial scores for Micron Technology, Inc. and Astera Labs, Inc. Common Stock:
Rating Comparison
MU Rating
- Rating: B, classified as Very Favorable by analysts.
- Discounted Cash Flow Score: 1, indicating a Very Unfavorable valuation.
- ROE Score: 4, considered Favorable for efficient profit generation.
- ROA Score: 5, rated Very Favorable, showing excellent asset utilization.
- Debt To Equity Score: 3, Moderate level of financial risk.
- Overall Score: 3, a Moderate summary assessment of financial standing.
ALAB Rating
- Rating: B, also classified as Very Favorable by analysts.
- Discounted Cash Flow Score: 1, indicating a Very Unfavorable valuation.
- ROE Score: 4, considered Favorable for efficient profit generation.
- ROA Score: 5, rated Very Favorable, showing excellent asset utilization.
- Debt To Equity Score: 4, Favorable, indicating lower financial risk.
- Overall Score: 3, a Moderate summary assessment of financial standing.
Which one is the best rated?
Both companies share the same overall rating of B with Moderate overall scores and identical ROE and ROA performances. ALAB has a more favorable Debt To Equity Score, indicating a stronger balance sheet risk profile compared to MU.
Scores Comparison
The scores comparison of Micron Technology, Inc. and Astera Labs, Inc. Common Stock is as follows:
MU Scores
- Altman Z-Score: 10.5, indicating a safe zone status
- Piotroski Score: 7, showing strong financial health
ALAB Scores
- Altman Z-Score: 136.9, indicating a safe zone status
- Piotroski Score: 6, reflecting average financial strength
Which company has the best scores?
Both MU and ALAB are in the safe zone for Altman Z-Score, with ALAB having a notably higher value. MU has a stronger Piotroski Score (7) compared to ALAB’s average score (6), suggesting relatively better financial strength.
Grades Comparison
The grades assigned to Micron Technology, Inc. and Astera Labs, Inc. Common Stock by various reliable grading companies are as follows:
Micron Technology, Inc. Grades
The following table shows recent grades assigned by established grading companies for Micron Technology, Inc.:
| Grading Company | Action | New Grade | Date |
|---|---|---|---|
| Keybanc | Maintain | Overweight | 2026-01-13 |
| B of A Securities | Maintain | Buy | 2026-01-13 |
| Lynx Global | Maintain | Buy | 2026-01-12 |
| Mizuho | Maintain | Outperform | 2026-01-09 |
| UBS | Maintain | Buy | 2026-01-07 |
| Piper Sandler | Maintain | Overweight | 2026-01-07 |
| Piper Sandler | Maintain | Overweight | 2025-12-18 |
| Barclays | Maintain | Overweight | 2025-12-18 |
| Keybanc | Maintain | Overweight | 2025-12-18 |
| Wolfe Research | Maintain | Outperform | 2025-12-18 |
Micron Technology’s grades consistently indicate a positive outlook, with repeated “Buy,” “Overweight,” and “Outperform” ratings maintained over recent months.
Astera Labs, Inc. Common Stock Grades
The following table presents recent grades from recognized grading companies for Astera Labs, Inc. Common Stock:
| Grading Company | Action | New Grade | Date |
|---|---|---|---|
| Northland Capital Markets | Maintain | Outperform | 2025-12-09 |
| Northland Capital Markets | Upgrade | Outperform | 2025-11-17 |
| Stifel | Maintain | Buy | 2025-11-05 |
| Morgan Stanley | Maintain | Overweight | 2025-11-05 |
| Roth Capital | Maintain | Buy | 2025-11-05 |
| Needham | Maintain | Buy | 2025-11-05 |
| JP Morgan | Maintain | Overweight | 2025-11-05 |
| TD Cowen | Maintain | Hold | 2025-11-05 |
| Barclays | Downgrade | Equal Weight | 2025-10-20 |
| Stifel | Maintain | Buy | 2025-10-17 |
Astera Labs shows a generally positive consensus, including several “Buy” and “Outperform” ratings, though with a recent downgrade from Barclays from “Overweight” to “Equal Weight.”
Which company has the best grades?
Both Micron Technology and Astera Labs have predominantly positive grades with consensus rating “Buy.” Micron Technology displays a stronger and more stable pattern of “Buy,” “Overweight,” and “Outperform” ratings across multiple firms, suggesting a robust market confidence. Astera Labs also holds positive grades but with slightly more variability, including a downgrade. For investors, these differences may signal varying levels of confidence and risk perceptions between the two companies.
Strengths and Weaknesses
Below is a comparative table highlighting the key strengths and weaknesses of Micron Technology, Inc. (MU) and Astera Labs, Inc. (ALAB) based on the latest financial and operational data.
| Criterion | Micron Technology, Inc. (MU) | Astera Labs, Inc. (ALAB) |
|---|---|---|
| Diversification | Strong diversification with multiple segments including DRAM, NAND, CNBU, EBU, MBU, and SBU | Limited diversification, revenue mainly from Product segment with minor Technology Service sales |
| Profitability | Favorable profitability: net margin 22.84%, ROE 15.76%, ROIC 12.12% | Unfavorable profitability: net margin -21.05%, ROE -8.65%, ROIC -11.97% |
| Innovation | Established leader in memory technology with continuous R&D investments | Early-stage tech company with high growth potential but currently value-destroying |
| Global presence | Global footprint with strong market penetration in memory and storage markets | Smaller scale, emerging presence in semiconductor solutions |
| Market Share | Large market share in DRAM and NAND products, generating $28.6B DRAM and $8.5B NAND revenue in 2025 | Nascent market share with $393M product revenue in 2024, still establishing position |
Key takeaways: Micron Technology’s diversified product base and solid profitability underpin a slightly favorable investment profile with growing returns. Astera Labs, while showing rapid ROIC improvement, currently faces profitability challenges and limited diversification, making it a higher-risk, growth-oriented option.
Risk Analysis
Below is a comparative overview of key risks for Micron Technology, Inc. (MU) and Astera Labs, Inc. (ALAB) based on the most recent data available.
| Metric | Micron Technology, Inc. (MU) | Astera Labs, Inc. (ALAB) |
|---|---|---|
| Market Risk | Moderate (Beta 1.50) | Moderate (Beta 1.51) |
| Debt level | Low (Debt/Equity 0.28) | Very Low (Debt/Equity 0.00) |
| Regulatory Risk | Moderate (Tech sector, US) | Moderate (Tech sector, US) |
| Operational Risk | Moderate (Large scale ops) | Higher (Early-stage, smaller) |
| Environmental Risk | Moderate (Manufacturing impact) | Moderate (Less manufacturing) |
| Geopolitical Risk | Moderate (Global supply chain) | Moderate (Global supply chain) |
Micron faces moderate market and operational risks due to its large scale and global exposure but benefits from a strong balance sheet and financial stability. Astera Labs, as a younger and smaller company, shows higher operational risks and unfavorable profitability but minimal debt, which limits financial strain. Geopolitical and regulatory risks affect both similarly, given their US-based tech focus.
Which Stock to Choose?
Micron Technology, Inc. (MU) has shown a strong income evolution with favorable growth in revenue and net margin. Its financial ratios are mostly favorable, highlighting solid profitability, manageable debt (net debt to EBITDA 0.30), and a very favorable rating (“B”). The company’s profitability indicators such as ROE (15.76%) and ROIC (12.12%) remain robust, despite a slightly unfavorable WACC ratio.
Astera Labs, Inc. Common Stock (ALAB) exhibits rapid revenue growth but mixed profitability, with negative net and EBIT margins. Financial ratios reveal a challenging profile, including unfavorable net margin (-21.05%) and high P/B ratio. However, it benefits from very favorable liquidity and low debt levels. Its overall rating is “B” but with a less favorable global ratios opinion.
For investors, MU might appear more suitable for those prioritizing financial stability and quality investing due to its favorable income and ratio profiles, while ALAB could be interpreted as appealing to risk-tolerant investors focused on growth given its strong revenue expansion but weaker profitability. The choice may depend on the investor’s risk appetite and investment strategy.
Disclaimer: Investment carries a risk of loss of initial capital. The past performance is not a reliable indicator of future results. Be sure to understand risks before making an investment decision.
Go Further
I encourage you to read the complete analyses of Micron Technology, Inc. and Astera Labs, Inc. Common Stock to enhance your investment decisions: