Home > Comparison > Technology > ALAB vs MXL
The strategic rivalry between Astera Labs, Inc. and MaxLinear, Inc. shapes the semiconductor industry’s evolution. Astera Labs operates as a cutting-edge connectivity innovator focused on cloud and AI infrastructure. MaxLinear, by contrast, is a mature provider of high-performance RF and mixed-signal communication SoCs for diverse markets. This analysis explores their contrasting growth trajectories and capital allocation strategies to identify which stock offers a superior risk-adjusted return for diversified portfolios.
Table of contents
Companies Overview
Astera Labs and MaxLinear are pivotal players shaping semiconductor innovation and connectivity solutions.
Astera Labs, Inc. Common Stock: Intelligent Connectivity Pioneer
Astera Labs leads in semiconductor-based connectivity solutions for cloud and AI infrastructure. Its revenue stems primarily from its Intelligent Connectivity Platform, which integrates data, network, and memory connectivity products. In 2026, the company focuses on scaling high-performance cloud infrastructure with software-defined architecture, emphasizing agility and customer deployment ease.
MaxLinear, Inc.: Mixed-Signal Communications Specialist
MaxLinear specializes in RF, high-performance analog, and mixed-signal SoCs for communication systems. Its core revenues come from integrated broadband radio transceivers, data converters, and embedded systems spanning wired and wireless infrastructure. Strategic efforts center on expanding end-to-end communication platform solutions across connected home and industrial markets in 2026.
Strategic Collision: Similarities & Divergences
Both firms operate in semiconductors but diverge sharply in approach: Astera Labs prioritizes a software-defined, scalable platform for cloud and AI, while MaxLinear leans on hardware-integrated, multi-market SoCs for communications. They compete mainly in advanced connectivity and infrastructure components. Astera Labs presents a high-growth, innovation-driven profile; MaxLinear offers a diversified communication technology play with broader market exposure.
Income Statement Comparison
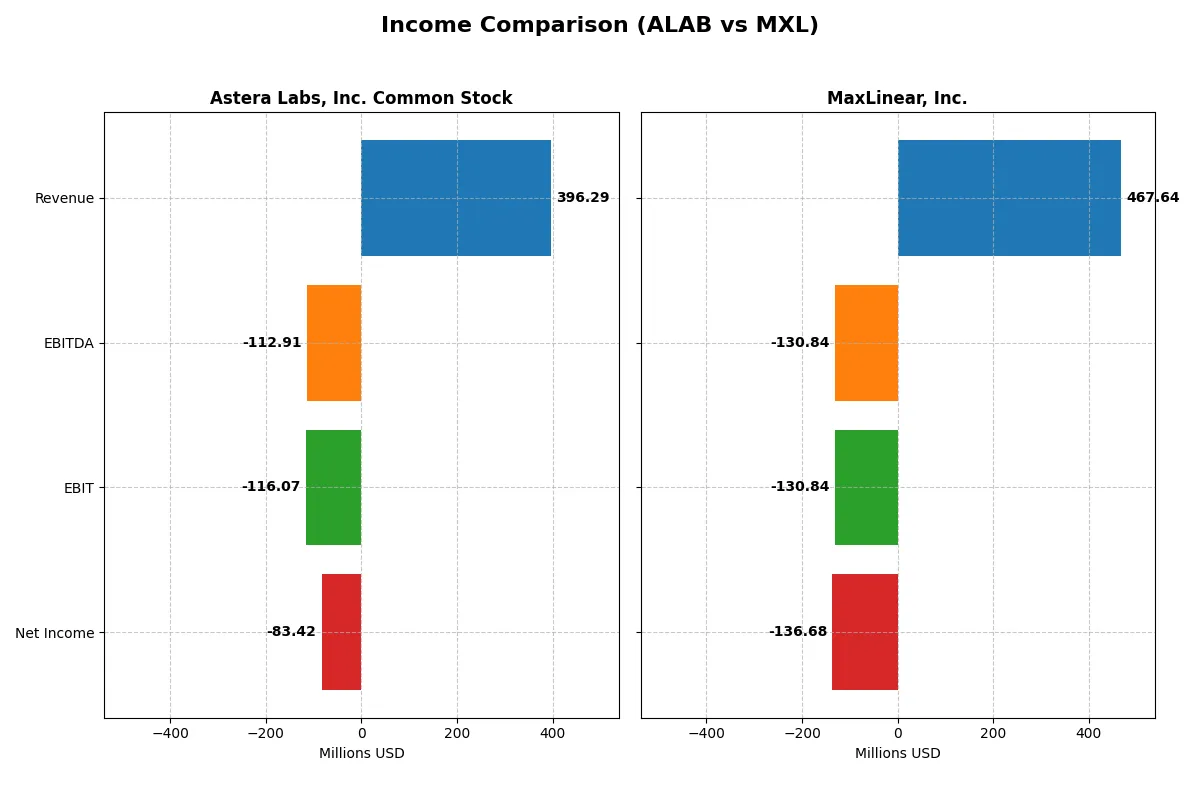
The following data dissects the core profitability and scalability of both corporate engines to reveal who dominates the bottom line:
| Metric | Astera Labs, Inc. Common Stock (ALAB) | MaxLinear, Inc. (MXL) |
|---|---|---|
| Revenue | 396M | 468M |
| Cost of Revenue | 94M | 202M |
| Operating Expenses | 419M | 393M |
| Gross Profit | 303M | 266M |
| EBITDA | -113M | -131M |
| EBIT | -116M | -131M |
| Interest Expense | 0 | 10M |
| Net Income | -83M | -137M |
| EPS | -0.64 | -1.58 |
| Fiscal Year | 2024 | 2025 |
Income Statement Analysis: The Bottom-Line Duel
This income statement comparison reveals which company converts revenue into profit most effectively through its operational efficiency and margin control.
Astera Labs, Inc. Common Stock Analysis
Astera Labs shows explosive revenue growth, jumping nearly 4x from 2022 to 2024, but its net income remains negative, reflecting ongoing losses. The firm sustains a strong gross margin of 76%, signaling solid product pricing power, yet faces heavy operating expenses that drag EBIT and net margins deep into the red. In 2024, losses widened despite revenue momentum, indicating an efficiency gap.
MaxLinear, Inc. Analysis
MaxLinear’s revenue declined overall since 2021 but rebounded 30% in the latest year, with gross margins steady at 57%. Despite a challenging period, MXL improved EBIT and net margins in 2025 compared to 2024, reducing its losses significantly. The company’s ability to grow profitability metrics amid revenue volatility suggests strengthening operational discipline and cost management.
Margin Strength vs. Revenue Momentum
Astera Labs leads in revenue scale and gross margin but struggles with profitability due to high operating costs. MaxLinear, while smaller in revenue, shows better progress in shrinking losses and improving margins. For investors prioritizing operational efficiency and near-term margin recovery, MaxLinear’s profile appears more attractive, whereas Astera Labs reflects a high-growth but riskier model.
Financial Ratios Comparison
These vital ratios act as a diagnostic tool to expose the underlying fiscal health, valuation premiums, and capital efficiency of the companies compared below:
| Ratios | Astera Labs, Inc. Common Stock (ALAB) | MaxLinear, Inc. (MXL) |
|---|---|---|
| ROE | -8.65% | -47.49% |
| ROIC | -11.97% | -24.31% |
| P/E | -208.41 | -6.74 |
| P/B | 18.02 | 3.20 |
| Current Ratio | 11.71 | 1.77 |
| Quick Ratio | 11.21 | 1.28 |
| D/E | 0.0013 | 0.29 |
| Debt-to-Assets | 0.12% | 17.23% |
| Interest Coverage | 0 | -15.52 |
| Asset Turnover | 0.38 | 0.42 |
| Fixed Asset Turnover | 11.12 | 4.65 |
| Payout ratio | 0 | 0 |
| Dividend yield | 0% | 0% |
| Fiscal Year | 2024 | 2024 |
Efficiency & Valuation Duel: The Vital Signs
Financial ratios serve as a company’s DNA, exposing hidden risks and spotlighting operational strengths that raw numbers often mask.
Astera Labs, Inc. Common Stock (ALAB)
Astera Labs shows deeply negative profitability with a -8.65% ROE and -21.05% net margin, signaling operational struggles. Valuation appears stretched, with an extreme P/E of -208.41 and a high PB ratio of 18.02. The firm pays no dividend, channeling cash into heavy R&D, evident in a 50.7% R&D-to-revenue ratio, aiming for long-term growth despite current inefficiencies.
MaxLinear, Inc. (MXL)
MaxLinear endures even steeper losses, with a -47.49% ROE and -68.01% net margin, indicating severe profitability challenges. Its valuation metrics, including a P/E of -6.74 and PB of 3.2, are less extreme than ALAB’s but still unfavorable. MXL lacks dividends, reinvesting aggressively in R&D (62.5% of revenue), attempting to rebuild operational footing amid a leaner balance sheet and moderate liquidity.
High Risk, High Investment: Growth vs. Stability Profiles
Both firms report negative returns and unfavorable profitability, reflecting high operational risk. ALAB’s valuation is far more stretched, betting heavily on innovation, while MXL offers a more moderate valuation with stronger liquidity. Investors seeking aggressive growth may favor ALAB’s R&D focus; those prioritizing relative balance might lean toward MXL’s steadier financial footing.
Which one offers the Superior Shareholder Reward?
Astera Labs (ALAB) and MaxLinear (MXL) both forgo dividends, focusing entirely on reinvestment and buybacks. ALAB’s payout ratio is zero, with no dividend yield, but it maintains a strong cash position (cash/share $6.97) to fuel R&D and growth. Buyback data is unavailable but likely limited given negative net margins (-21% in 2024). MXL also pays no dividends and shows negative free cash flow per share (-$0.75 in 2024), indicating tight buyback capacity. MXL’s price/book ratio (3.2) and price/sales (4.6) are far lower than ALAB’s (18 and 44), suggesting MXL offers more value. I see ALAB’s high valuation and persistent losses as a risk to shareholder reward. MXL’s modest valuation and clearer path to profitability offer a more sustainable total return profile in 2026.
Comparative Score Analysis: The Strategic Profile
The radar chart reveals the fundamental DNA and trade-offs of Astera Labs and MaxLinear, highlighting their strategic strengths and weaknesses:
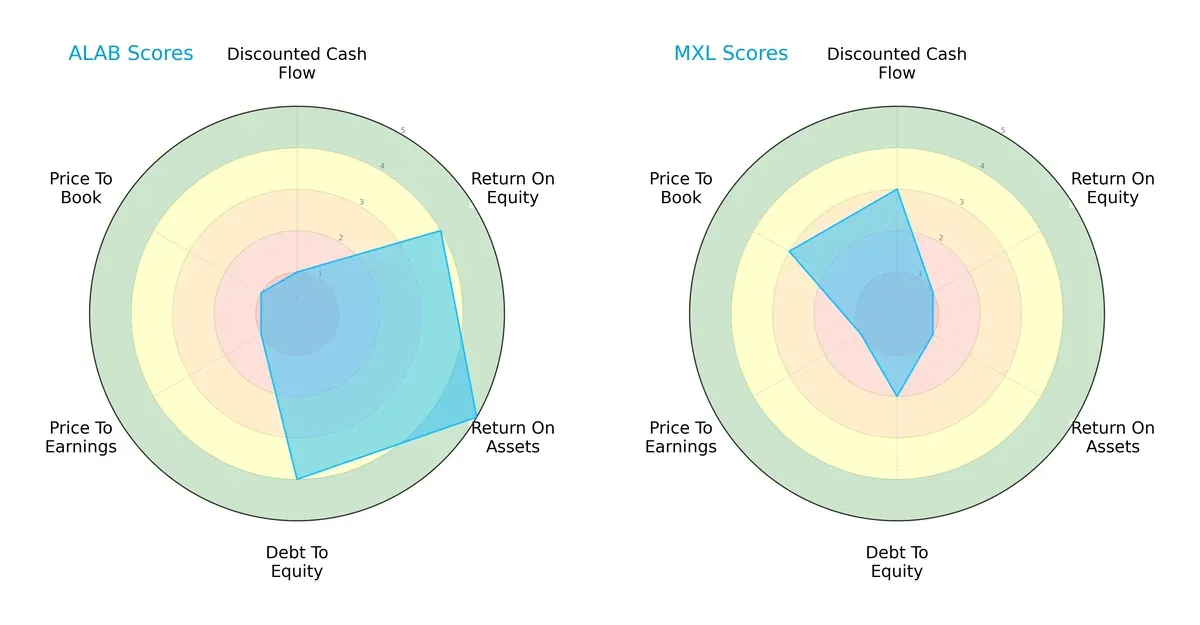
Astera Labs shows a balanced profile with strong ROE (4) and ROA (5) scores, indicating efficient profit generation and asset use. MaxLinear relies heavily on a moderate DCF score (3) but suffers from very weak ROE (1) and ROA (1), suggesting operational challenges. Astera’s favorable debt-to-equity (4) contrasts with MaxLinear’s moderate leverage (2), underscoring Astera’s stronger financial stability. Valuation metrics (PE/PB) are weak for both, but MaxLinear’s slightly better P/B (3) hints at relative bargain potential.
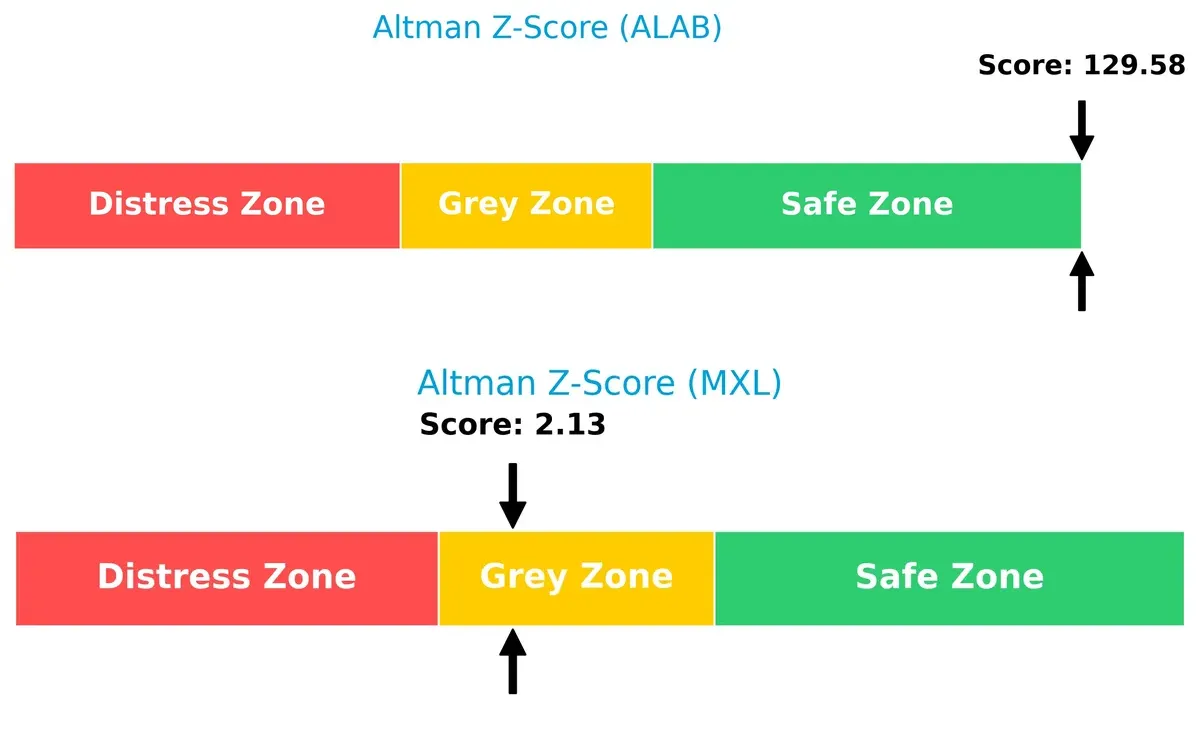
Bankruptcy Risk: Solvency Showdown
Astera Labs’ Altman Z-Score of 130 vastly outperforms MaxLinear’s 2.13, placing Astera firmly in the safe zone while MaxLinear remains in the grey zone, signaling higher bankruptcy risk:
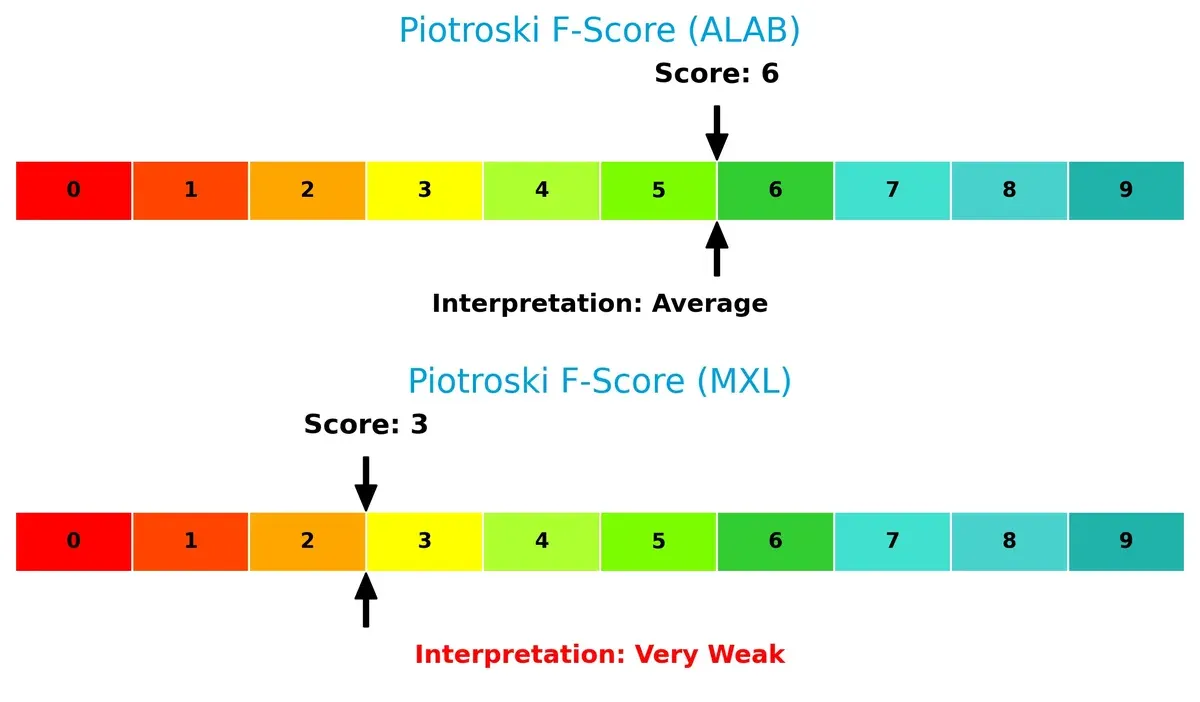
Financial Health: Quality of Operations
Astera Labs scores a solid 6 on the Piotroski F-Score, reflecting above-average financial health. MaxLinear’s 3 signals red flags in internal metrics, indicating operational weaknesses and higher risk:
How are the two companies positioned?
This section dissects the operational DNA of ALAB and MXL by comparing their revenue distribution and internal dynamics. The goal is to confront their economic moats to reveal which model offers the most resilient and sustainable competitive advantage today.
Revenue Segmentation: The Strategic Mix
The following comparison dissects how Astera Labs and MaxLinear diversify their income streams and reveals where their primary sector bets lie:
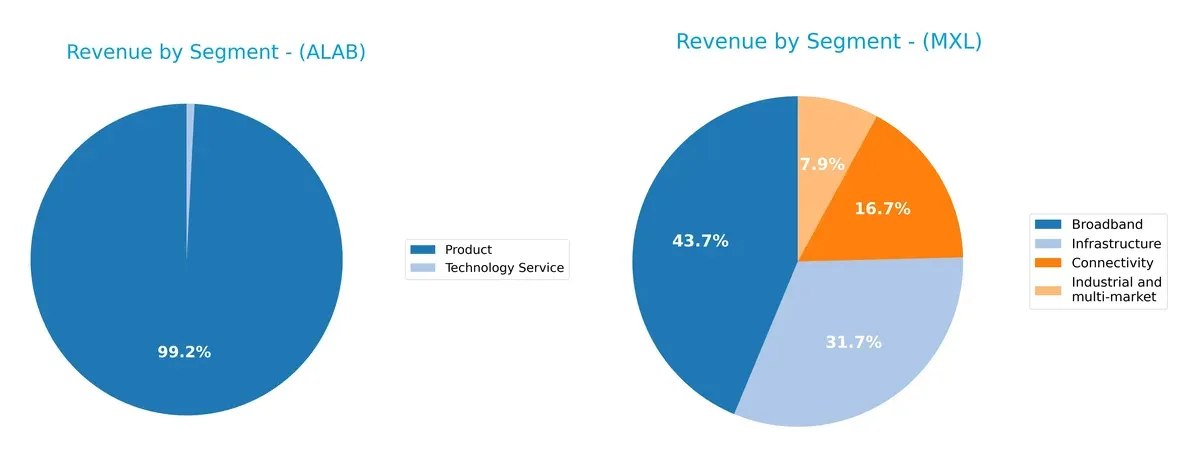
Astera Labs anchors 393M in Product revenue, with a minor 3M from Technology Service, showing high concentration in a single segment. MaxLinear diversifies across Broadband (204M), Infrastructure (148M), Connectivity (78M), and Industrial (37M), spreading risk and tapping multiple markets. MaxLinear’s mix suggests robust ecosystem lock-in and infrastructure dominance, while Astera Labs faces concentration risk but may leverage focused innovation.
Strengths and Weaknesses Comparison
This table compares the Strengths and Weaknesses of Astera Labs (ALAB) and MaxLinear (MXL):
ALAB Strengths
- High quick ratio at 11.21 indicates strong short-term liquidity
- Zero debt to equity ratio shows conservative capital structure
- Low debt to assets at 0.12 reduces financial risk
- Favorable fixed asset turnover at 11.12 reflects efficient asset use
MXL Strengths
- Diverse product revenue streams across broadband, connectivity, industrial, and infrastructure
- Favorable current and quick ratios indicate manageable liquidity
- Moderate debt to equity at 0.29 supports growth finance
- Favorable fixed asset turnover at 4.65 shows asset utilization
ALAB Weaknesses
- Negative net margin (-21.05%) and ROE (-8.65%) reflect weak profitability
- High price-to-book ratio (18.02) suggests overvaluation risk
- Unfavorable asset turnover (0.38) points to low operational efficiency
- Zero interest coverage indicates vulnerability to debt costs
MXL Weaknesses
- Very negative net margin (-68.01%) and ROE (-47.49%) highlight profitability struggles
- Negative interest coverage (-13.01) signals difficulty servicing debt
- Unfavorable asset turnover (0.42) limits revenue generation efficiency
- Price-to-book ratio (3.2) indicates valuation concerns
Both companies face profitability challenges with negative margins and returns. ALAB’s liquidity and capital structure appear stronger, while MXL benefits from broader product diversification. Operational efficiency and valuation remain key concerns for both.
The Moat Duel: Analyzing Competitive Defensibility
A structural moat is the only robust shield protecting long-term profits from relentless competitive erosion in technology sectors:
Astera Labs, Inc. Common Stock: Software-Defined Connectivity Moat
Astera’s moat stems from its software-defined architecture enabling scalable cloud and AI infrastructure connectivity. This creates high gross margins (76%) but negative EBIT margins indicate early investment phases. Growing ROIC signals improving value creation potential, with new AI workloads set to deepen its competitive edge in 2026.
MaxLinear, Inc.: Integrated Communications SoC Moat
MaxLinear’s moat lies in its highly integrated SoC solutions across wired and wireless infrastructure, contrasting Astera’s software focus. Despite stronger EBIT margin improvement and positive recent growth metrics, its declining ROIC trend warns of weakening capital efficiency. Expansion into 5G and fiber optics offers growth but faces intense competition.
Verdict: Software-Defined Architecture vs. System Integration Efficiency
Astera Labs holds a deeper moat through innovative software-driven scalability, reflected in improving ROIC trends. MaxLinear’s integration moat is broader but undermined by falling capital returns. Astera appears better positioned to defend and grow its market share amid evolving cloud and AI demands.
Which stock offers better returns?
The past year showed Astera Labs surging over 115%, with accelerating gains and high volatility. MaxLinear declined 17% overall but gained nearly 25% recently, indicating a sharp recent turnaround.
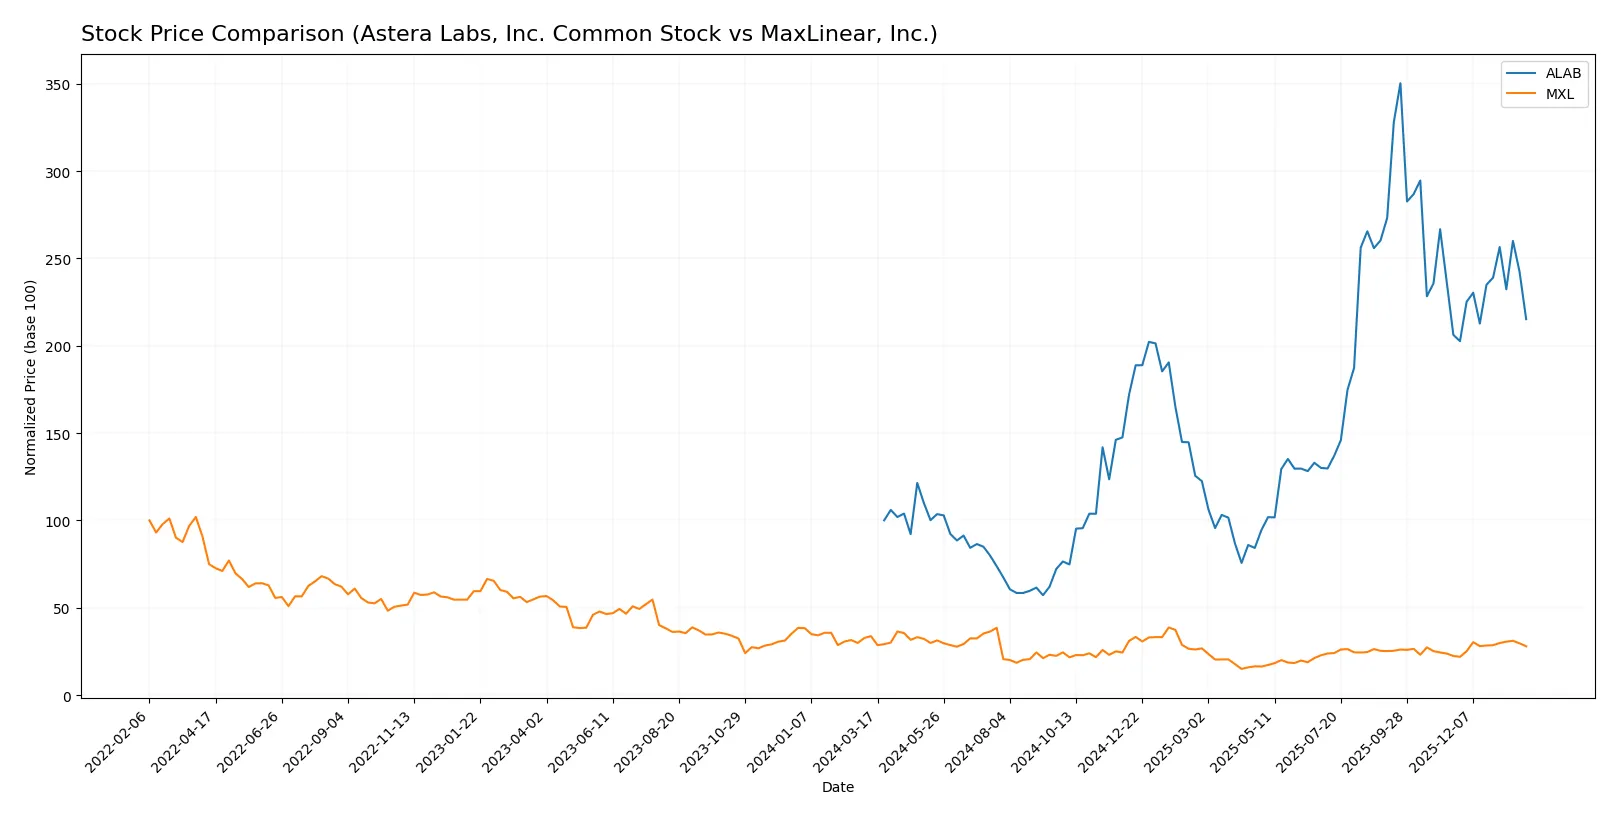
Trend Comparison
Astera Labs’ stock posted a strong 115.17% rise over the past 12 months, marking a bullish trend with accelerating momentum and significant price swings between 40.0 and 245.2.
MaxLinear’s stock fell 17.26% over the same period, indicating a bearish trend despite recent acceleration and a 24.82% gain since November 2025, showing early recovery signs.
Astera Labs outperformed MaxLinear, delivering the highest market return with sustained bullish momentum and price acceleration throughout the past year.
Target Prices
Analysts present a constructive consensus on target prices for Astera Labs and MaxLinear, signaling upside potential.
| Company | Target Low | Target High | Consensus |
|---|---|---|---|
| Astera Labs, Inc. Common Stock | 165 | 225 | 202.14 |
| MaxLinear, Inc. | 15 | 25 | 21 |
Astera Labs’ consensus target exceeds its current price of $150.62 by roughly 34%, suggesting significant growth expectations. MaxLinear’s target sits 21% above its current $17.35 price, indicating moderate bullish sentiment.

Don’t Let Luck Decide Your Entry Point
Optimize your entry points with our advanced ProRealTime indicators. You’ll get efficient buy signals with precise price targets for maximum performance. Start outperforming now!
How do institutions grade them?
Astera Labs, Inc. Common Stock Grades
The following table shows recent institutional grades and actions for Astera Labs, Inc. Common Stock:
| Grading Company | Action | New Grade | Date |
|---|---|---|---|
| Northland Capital Markets | Maintain | Outperform | 2025-12-09 |
| Northland Capital Markets | Upgrade | Outperform | 2025-11-17 |
| Needham | Maintain | Buy | 2025-11-05 |
| JP Morgan | Maintain | Overweight | 2025-11-05 |
| TD Cowen | Maintain | Hold | 2025-11-05 |
| Morgan Stanley | Maintain | Overweight | 2025-11-05 |
| Roth Capital | Maintain | Buy | 2025-11-05 |
| Stifel | Maintain | Buy | 2025-11-05 |
| Barclays | Downgrade | Equal Weight | 2025-10-20 |
| Stifel | Maintain | Buy | 2025-10-17 |
MaxLinear, Inc. Grades
Institutional grades and actions for MaxLinear, Inc. are summarized in the table below:
| Grading Company | Action | New Grade | Date |
|---|---|---|---|
| Wells Fargo | Maintain | Equal Weight | 2026-01-30 |
| Benchmark | Maintain | Buy | 2026-01-16 |
| Benchmark | Maintain | Buy | 2025-10-24 |
| Benchmark | Maintain | Buy | 2025-10-17 |
| Benchmark | Maintain | Buy | 2025-09-02 |
| Loop Capital | Maintain | Hold | 2025-08-04 |
| Wells Fargo | Maintain | Equal Weight | 2025-07-24 |
| Benchmark | Maintain | Buy | 2025-07-24 |
| Susquehanna | Maintain | Neutral | 2025-07-24 |
| Susquehanna | Maintain | Neutral | 2025-07-22 |
Which company has the best grades?
Astera Labs, Inc. has a stronger consensus with multiple “Buy” and “Outperform” grades from reputable firms. MaxLinear, Inc. holds mostly “Buy” and “Equal Weight” ratings, indicating more cautious optimism. Investors may see Astera Labs as having higher institutional confidence.
Risks specific to each company
The following categories identify critical pressure points and systemic threats facing both firms in the 2026 market environment:
1. Market & Competition
Astera Labs, Inc. Common Stock (ALAB)
- Faces intense competition in semiconductor connectivity for cloud and AI infrastructure, with rapid technology shifts.
MaxLinear, Inc. (MXL)
- Competes in RF and mixed-signal SoCs across diverse markets, challenged by evolving communication standards and price pressure.
2. Capital Structure & Debt
Astera Labs, Inc. Common Stock (ALAB)
- Zero debt, very low debt-to-assets ratio (12%), strong balance sheet with favorable debt metrics.
MaxLinear, Inc. (MXL)
- Moderate leverage with debt-to-assets at 17.23%, manageable but interest coverage negative, indicating risk.
3. Stock Volatility
Astera Labs, Inc. Common Stock (ALAB)
- Beta 1.51 signals above-market volatility; price range wide from 47.1 to 262.9, reflecting high trading swings.
MaxLinear, Inc. (MXL)
- Higher beta at 1.77, price range from 8.35 to 20.82, indicating even greater sensitivity to market moves.
4. Regulatory & Legal
Astera Labs, Inc. Common Stock (ALAB)
- Semiconductor sector faces export controls and IP protection risks; no company-specific issues disclosed.
MaxLinear, Inc. (MXL)
- Similar regulatory environment risks, with additional exposure to wireless infrastructure compliance challenges.
5. Supply Chain & Operations
Astera Labs, Inc. Common Stock (ALAB)
- Relies on complex semiconductor supply chains; potential disruptions impact cloud/AI product delivery.
MaxLinear, Inc. (MXL)
- Broad supply chain across multiple communication products; vulnerable to component shortages and logistics delays.
6. ESG & Climate Transition
Astera Labs, Inc. Common Stock (ALAB)
- Limited ESG disclosures; energy-efficient design focus needed to meet growing cloud infrastructure sustainability demands.
MaxLinear, Inc. (MXL)
- ESG risks moderate; product diversity requires ongoing adaptation to environmental standards in multiple jurisdictions.
7. Geopolitical Exposure
Astera Labs, Inc. Common Stock (ALAB)
- US-based but global semiconductor supply chains expose it to US-China tensions and export restrictions.
MaxLinear, Inc. (MXL)
- Similarly exposed to geopolitical risks affecting global telecom supply chains and technology trade policies.
Which company shows a better risk-adjusted profile?
Astera Labs faces high market volatility and technology competition but maintains a pristine balance sheet and strong liquidity. MaxLinear struggles with heavier leverage and negative interest coverage, amplifying financial risks amid its volatile stock. ALAB’s zero debt and robust Altman Z-Score (safe zone) underscore a cleaner risk profile. MXL’s financial distress signals (grey zone Z-Score, very weak Piotroski) and greater operational complexity heighten caution. Thus, Astera Labs presents a superior risk-adjusted profile in 2026.
Final Verdict: Which stock to choose?
Astera Labs’ superpower lies in its rapid revenue expansion and improving profitability trends despite current value destruction. Its enormous liquidity position offers a cushion, but the challenge remains turning growing R&D investments into sustainable profits. This stock suits investors with a high-risk tolerance aiming for aggressive growth exposure in emerging tech.
MaxLinear’s strategic moat emerges from its diversified product portfolio and stable gross margins, providing some buffer against market volatility. Compared to Astera Labs, it exhibits better financial stability but struggles with declining profitability and a shrinking moat. It fits portfolios seeking growth at a reasonable price with a more cautious stance.
If you prioritize aggressive growth and can stomach near-term losses for future potential, Astera Labs outshines MaxLinear with its accelerating revenue and improving returns. However, if you seek better stability and a well-defined moat, MaxLinear offers a more measured approach despite its current profitability challenges. Both scenarios require vigilant monitoring of profitability trends and capital efficiency.
Disclaimer: Investment carries a risk of loss of initial capital. The past performance is not a reliable indicator of future results. Be sure to understand risks before making an investment decision.
Go Further
I encourage you to read the complete analyses of Astera Labs, Inc. Common Stock and MaxLinear, Inc. to enhance your investment decisions: