In the fast-evolving semiconductor industry, Marvell Technology, Inc. (MRVL) and Astera Labs, Inc. (ALAB) stand out as prominent players driving innovation and connectivity solutions. Marvell, with its broad portfolio and global reach, contrasts with Astera Labs’ focused approach on cloud and AI infrastructure connectivity. This comparison explores their market positions and innovation strategies to help you decide which company could be the smarter addition to your investment portfolio.

Table of contents
Companies Overview
I will begin the comparison between Marvell Technology, Inc. and Astera Labs, Inc. by providing an overview of these two companies and their main differences.
Marvell Technology Overview
Marvell Technology, Inc. designs, develops, and sells analog, mixed-signal, digital signal processing, and integrated circuits. It offers a wide portfolio including Ethernet controllers, network adapters, storage controllers, and ASICs. Incorporated in 1995 and headquartered in Wilmington, Delaware, Marvell operates globally with over 7K employees, positioning itself as a significant player in the semiconductor industry.
Astera Labs Overview
Astera Labs, Inc. focuses on semiconductor-based connectivity solutions tailored for cloud and AI infrastructure. Its Intelligent Connectivity Platform offers data, network, and memory connectivity products built on a software-defined architecture. Founded in 2017 and based in Santa Clara, California, Astera Labs is a younger company with 440 employees, targeting high-performance cloud and AI applications.
Key similarities and differences
Both Marvell and Astera Labs operate in the semiconductor sector, serving technology markets with connectivity and processing solutions. Marvell has a broader product range and a larger global footprint, while Astera Labs specializes in connectivity for cloud and AI infrastructure with a software-centric approach. The size difference is notable, with Marvell’s 7K employees dwarfing Astera Labs’ 440, reflecting their different stages and market focuses.
Income Statement Comparison
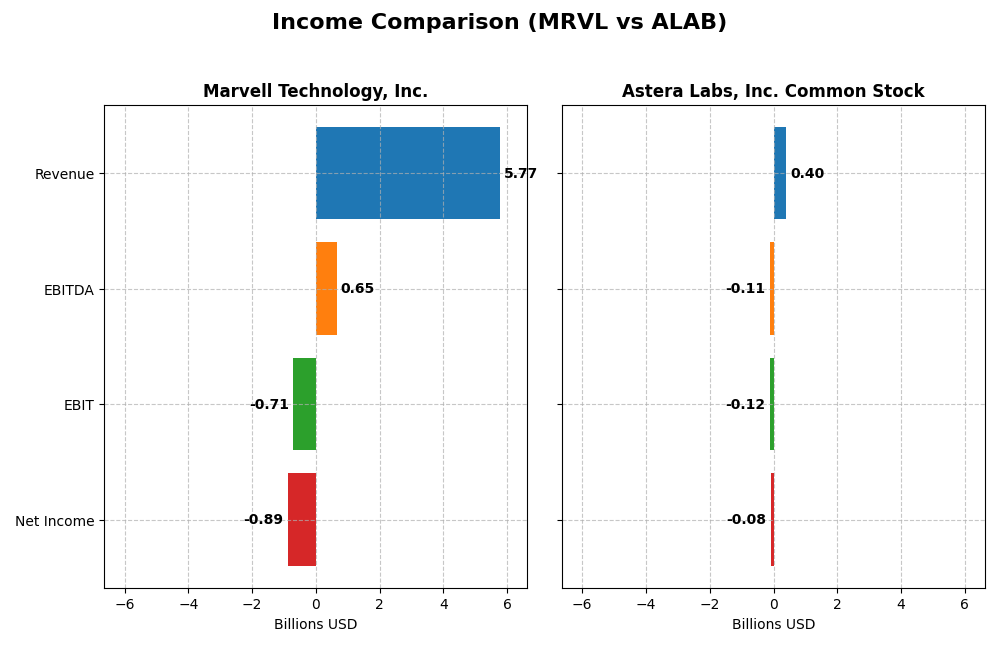
This table compares the latest fiscal year income statement metrics for Marvell Technology, Inc. and Astera Labs, Inc., highlighting key financial figures for a clear overview.
| Metric | Marvell Technology, Inc. | Astera Labs, Inc. Common Stock |
|---|---|---|
| Market Cap | 69.3B | 29.5B |
| Revenue | 5.77B | 396M |
| EBITDA | 652M | -113M |
| EBIT | -705M | -116M |
| Net Income | -885M | -83.4M |
| EPS | -1.02 | -0.64 |
| Fiscal Year | 2025 | 2024 |
Income Statement Interpretations
Marvell Technology, Inc.
Marvell Technology’s revenue increased steadily from $2.97B in 2021 to $5.77B in 2025, nearly doubling over five years. However, net income remained negative throughout, worsening from -$277M in 2021 to -$885M in 2025. Gross margins stayed relatively stable at around 41%, but operating and net margins were consistently unfavorable. The latest year showed slight revenue growth with deteriorating operating income.
Astera Labs, Inc. Common Stock
Astera Labs experienced rapid revenue growth from $80M in 2022 to $396M in 2024, a nearly fivefold increase. Despite this, net income remained negative, at -$83M in 2024, with significant operating losses increasing. Gross margin was high at 76%, though EBIT and net margins were unfavorable. The most recent year showed strong revenue and gross profit improvement, but operating losses expanded markedly.
Which one has the stronger fundamentals?
Marvell Technology demonstrates more stable revenue growth over a longer period but continues to struggle with negative net income and operating margins. Astera Labs shows impressive top-line expansion and higher gross margins but faces deepening operating losses and weaker profitability metrics. Both companies exhibit unfavorable net margins, making a definitive judgment on stronger fundamentals complex based solely on income statements.
Financial Ratios Comparison
This table presents a side-by-side comparison of key financial ratios for Marvell Technology, Inc. and Astera Labs, Inc. based on their most recent fiscal year data.
| Ratios | Marvell Technology, Inc. (MRVL) | Astera Labs, Inc. Common Stock (ALAB) |
|---|---|---|
| ROE | -6.59% | -8.65% |
| ROIC | -3.88% | -11.97% |
| P/E | -110.4 | -208.4 |
| P/B | 7.27 | 18.02 |
| Current Ratio | 1.54 | 11.71 |
| Quick Ratio | 1.03 | 11.21 |
| D/E (Debt-to-Equity) | 0.32 | 0.0013 |
| Debt-to-Assets | 21.5% | 0.12% |
| Interest Coverage | -3.80 | 0 |
| Asset Turnover | 0.29 | 0.38 |
| Fixed Asset Turnover | 5.56 | 11.12 |
| Payout ratio | -23.4% | 0 |
| Dividend yield | 0.21% | 0 |
Interpretation of the Ratios
Marvell Technology, Inc.
Marvell shows mixed financial ratios, with 42.86% favorable metrics but a majority of 57.14% unfavorable indicators, including negative net margin (-15.35%) and return on equity (-6.59%). Its current and quick ratios are strong, indicating liquidity, while leverage ratios are moderate. The company pays a modest dividend with a 0.21% yield, but this is considered low and potentially unsustainable given weak profitability and cash flow.
Astera Labs, Inc. Common Stock
Astera Labs exhibits weaker ratios overall, with only 35.71% favorable versus 64.29% unfavorable. Key concerns include a negative net margin (-21.05%) and low return on invested capital (-11.97%). The quick ratio is strong, but the current ratio is unusually high, signaling possible asset inefficiency. Astera Labs does not pay dividends, reflecting its growth phase and focus on reinvestment in R&D and expansion.
Which one has the best ratios?
Both firms present predominantly unfavorable financial ratios, but Marvell Technology has a slightly higher proportion of favorable metrics and better liquidity ratios. Astera Labs, while showing strong quick ratio and no debt, suffers from more pronounced profitability and efficiency weaknesses. Overall, Marvell’s ratios are moderately better balanced compared to Astera Labs.
Strategic Positioning
This section compares the strategic positioning of Marvell Technology and Astera Labs, focusing on market position, key segments, and exposure to technological disruption:
Marvell Technology, Inc.
- Large market cap with established presence; faces moderate competitive pressure in semiconductors.
- Diversified segments: data center, enterprise networking, carrier infrastructure, automotive, and consumer.
- Operates in mature semiconductor sectors with incremental innovation; exposure to technology shifts in data and networking.
Astera Labs, Inc. Common Stock
- Smaller market cap; emerging competitor focusing on niche AI and cloud infrastructure connectivity.
- Concentrated on semiconductor connectivity solutions for cloud and AI infrastructure with software-defined architecture.
- Positioned in evolving AI and cloud tech; relies on software-defined innovation to address high-performance infrastructure needs.
Marvell Technology, Inc. vs Astera Labs, Inc. Common Stock Positioning
Marvell pursues a diversified approach across multiple semiconductor segments, providing broader exposure but facing varied competitive pressures. Astera Labs adopts a concentrated focus on AI and cloud connectivity, potentially allowing specialization but limiting market breadth.
Which has the best competitive advantage?
Both companies are currently shedding value, but Marvell shows very unfavorable durability with declining ROIC, while Astera Labs has a slightly unfavorable moat with improving profitability, indicating a modestly better competitive position.
Stock Comparison
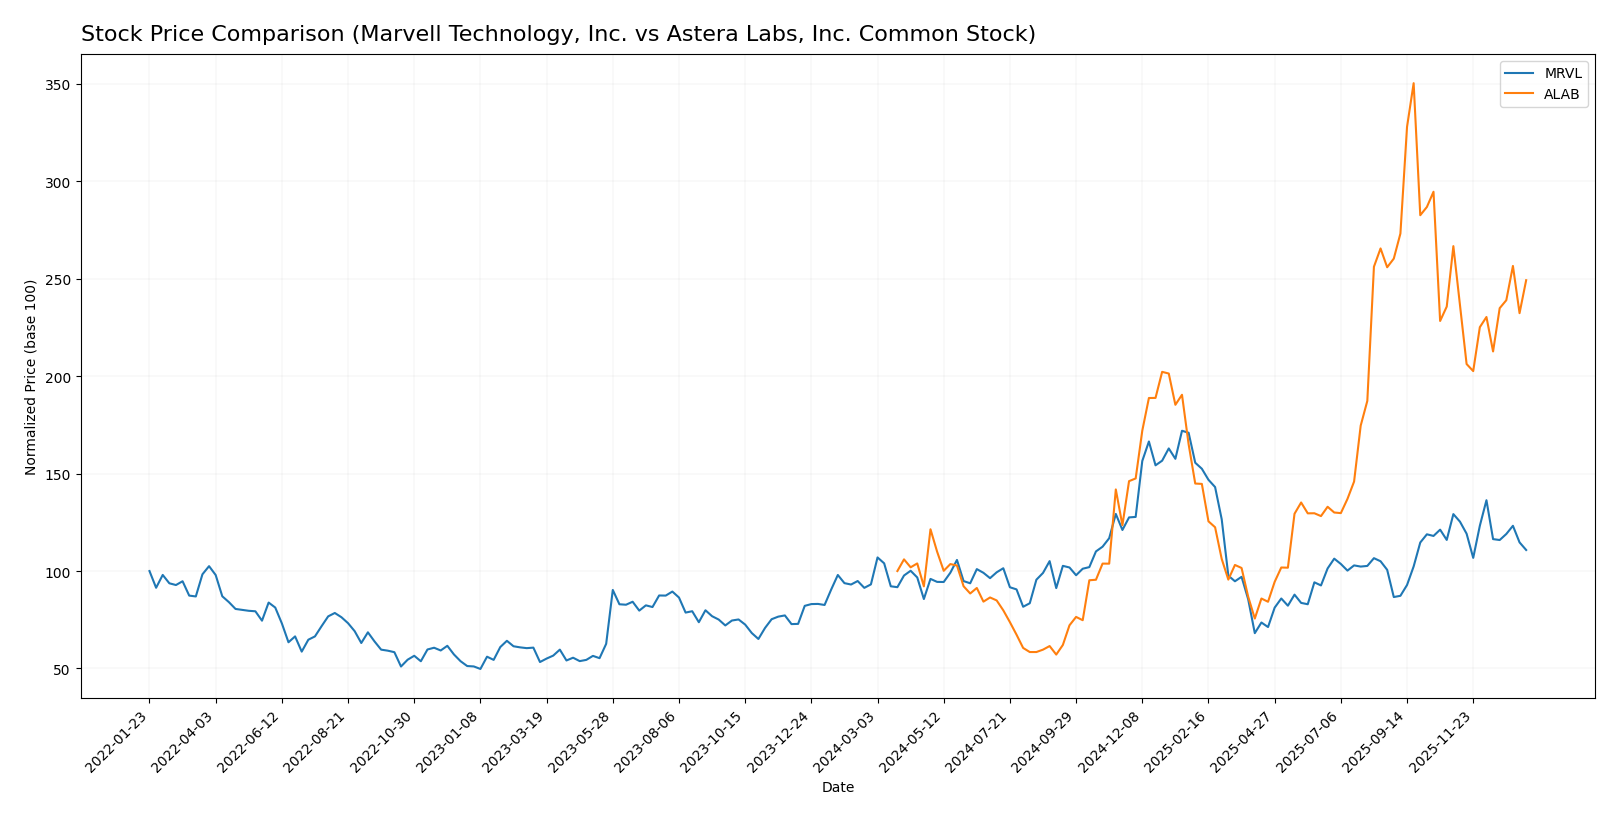
The stock price movements of Marvell Technology, Inc. and Astera Labs, Inc. over the past year reveal distinct bullish trends with decelerating momentum, marked by significant price gains and recent short-term pullbacks.
Trend Analysis
Marvell Technology, Inc. (MRVL) experienced an 18.94% price increase over the past 12 months, reflecting a bullish trend with decelerating acceleration. The stock showed a high volatility level with a standard deviation of 16.46 and recent short-term weakness of -14.25%.
Astera Labs, Inc. (ALAB) posted a substantial 149.21% price increase in the same period, maintaining a bullish trend but also with deceleration. It exhibited higher volatility, with a 50.14 standard deviation, and a recent decline of -6.55% alongside a slight positive trend slope.
Comparing the two, Astera Labs delivered the highest market performance with a significantly larger price gain, despite both stocks showing deceleration and recent short-term declines.
Target Prices
Analysts present a strong target price consensus for both Marvell Technology, Inc. and Astera Labs, Inc. Common Stock.
| Company | Target High | Target Low | Consensus |
|---|---|---|---|
| Marvell Technology, Inc. | 156 | 80 | 117 |
| Astera Labs, Inc. Common Stock | 225 | 165 | 202.14 |
The consensus targets suggest significant upside potential for both stocks compared to their current prices of 80.38 for Marvell and 174.45 for Astera Labs, reflecting positive analyst outlooks in the semiconductor sector.
Analyst Opinions Comparison
This section compares analysts’ ratings and grades for Marvell Technology, Inc. and Astera Labs, Inc. Common Stock:
Rating Comparison
Marvell Technology, Inc. Rating
- Rating: B+, considered Very Favorable
- Discounted Cash Flow Score: 3 (Moderate)
- ROE Score: 4 (Favorable)
- ROA Score: 5 (Very Favorable)
- Debt To Equity Score: 2 (Moderate)
- Overall Score: 3 (Moderate)
Astera Labs, Inc. Common Stock Rating
- Rating: B, considered Very Favorable
- Discounted Cash Flow Score: 1 (Very Unfavorable)
- ROE Score: 4 (Favorable)
- ROA Score: 5 (Very Favorable)
- Debt To Equity Score: 4 (Favorable)
- Overall Score: 3 (Moderate)
Which one is the best rated?
Marvell Technology holds a slightly higher overall rating (B+) compared to Astera Labs (B). While both have similar ROE and ROA scores, Marvell scores better in discounted cash flow, but Astera has a stronger debt-to-equity score.
Scores Comparison
The following table compares the Altman Z-Score and Piotroski Score for Marvell Technology, Inc. and Astera Labs, Inc. Common Stock:
MRVL Scores
- Altman Z-Score: 6.76, indicating a safe zone with low bankruptcy risk.
- Piotroski Score: 7, classified as strong financial health.
ALAB Scores
- Altman Z-Score: 136.88, well within the safe zone, very low bankruptcy risk.
- Piotroski Score: 6, indicating average financial strength.
Which company has the best scores?
Astera Labs has a significantly higher Altman Z-Score, suggesting stronger financial stability. However, Marvell Technology shows a stronger Piotroski Score, indicating better overall financial health. The best scores depend on which metric investors prioritize.
Grades Comparison
Here is a comparison of the latest available grades from reputable grading companies for both Marvell Technology, Inc. and Astera Labs, Inc. Common Stock:
Marvell Technology, Inc. Grades
The table below summarizes recent grades and rating actions from established analysts on Marvell Technology, Inc.:
| Grading Company | Action | New Grade | Date |
|---|---|---|---|
| Rosenblatt | Maintain | Buy | 2026-01-07 |
| Melius Research | Upgrade | Buy | 2026-01-05 |
| Benchmark | Downgrade | Hold | 2025-12-08 |
| B. Riley Securities | Maintain | Buy | 2025-12-03 |
| JP Morgan | Maintain | Overweight | 2025-12-03 |
| Susquehanna | Maintain | Positive | 2025-12-03 |
| Benchmark | Maintain | Buy | 2025-12-03 |
| Oppenheimer | Maintain | Outperform | 2025-12-03 |
| Stifel | Maintain | Buy | 2025-12-03 |
| Rosenblatt | Maintain | Buy | 2025-12-03 |
Overall, Marvell Technology has a strong bias toward Buy ratings across multiple firms, with only one recent downgrade to Hold, indicating generally positive sentiment.
Astera Labs, Inc. Common Stock Grades
The following table shows recent analyst grades and actions for Astera Labs, Inc.:
| Grading Company | Action | New Grade | Date |
|---|---|---|---|
| Northland Capital Markets | Maintain | Outperform | 2025-12-09 |
| Northland Capital Markets | Upgrade | Outperform | 2025-11-17 |
| Stifel | Maintain | Buy | 2025-11-05 |
| Morgan Stanley | Maintain | Overweight | 2025-11-05 |
| Roth Capital | Maintain | Buy | 2025-11-05 |
| Needham | Maintain | Buy | 2025-11-05 |
| JP Morgan | Maintain | Overweight | 2025-11-05 |
| TD Cowen | Maintain | Hold | 2025-11-05 |
| Barclays | Downgrade | Equal Weight | 2025-10-20 |
| Stifel | Maintain | Buy | 2025-10-17 |
Astera Labs shows mostly Buy and Outperform ratings, with one downgrade to Equal Weight and a Hold rating, reflecting generally favorable but slightly mixed sentiment.
Which company has the best grades?
Both Marvell Technology and Astera Labs have a consensus Buy rating, but Marvell has a larger volume of Buy and Outperform ratings from multiple firms, suggesting a stronger and more consistent analyst endorsement. This could influence investor confidence by signaling broader market approval and potentially lower perceived risk.
Strengths and Weaknesses
Below is a comparative table highlighting key strengths and weaknesses of Marvell Technology, Inc. (MRVL) and Astera Labs, Inc. (ALAB) based on their most recent financial and operational data.
| Criterion | Marvell Technology, Inc. (MRVL) | Astera Labs, Inc. (ALAB) |
|---|---|---|
| Diversification | Highly diversified across Data Center (4.16B), Enterprise Networking (626M), Carrier Infrastructure (338M), Consumer (316M), Automotive & Industrial (322M) | Limited diversification; mostly Product segment (393M) with minor Technology Service (3.2M) |
| Profitability | Negative net margin (-15.35%), ROIC -3.88%, declining profitability and value destruction | Negative net margin (-21.05%), ROIC -11.97%, but improving ROIC trend indicating potential recovery |
| Innovation | Moderate fixed asset turnover (5.56) indicating some efficiency in asset use | High fixed asset turnover (11.12) suggesting efficient capital utilization |
| Global presence | Strong presence in multiple global markets through diverse product lines | Smaller scale, more focused market footprint |
| Market Share | Large scale in Data Center and Networking sectors, but facing profitability challenges | Growing market presence but limited scale and profitability issues |
Key takeaways: Marvell boasts strong diversification and scale but struggles with declining profitability and value destruction. Astera Labs, while smaller and less diversified, shows improving profitability trends and efficient asset use, suggesting potential growth despite current losses. Investors should weigh risk carefully given both companies’ unfavorable profitability metrics.
Risk Analysis
Below is a comparative risk table for Marvell Technology, Inc. (MRVL) and Astera Labs, Inc. Common Stock (ALAB) based on the most recent financial and operational data from 2025 and 2024 respectively.
| Metric | Marvell Technology, Inc. (MRVL) | Astera Labs, Inc. Common Stock (ALAB) |
|---|---|---|
| Market Risk | High beta at 1.945 indicates elevated market volatility exposure | Moderately high beta of 1.51 shows significant market sensitivity |
| Debt Level | Moderate debt-to-equity ratio at 0.32; manageable leverage | Virtually no debt (debt-to-equity 0.0), low financial risk from leverage |
| Regulatory Risk | Operating in multiple countries including China and US; potential geopolitical and regulatory challenges | US-based with less international exposure, regulatory risk limited but cloud/AI sector faces evolving standards |
| Operational Risk | Large workforce and global operations increase complexity; some unfavorable operational ratios | Smaller team (440 employees) may limit operational scale but less complexity |
| Environmental Risk | Semiconductor manufacturing involves resource-intensive processes, moderate environmental regulations applicable | Similar industry challenges but smaller scale reduces environmental impact risk |
| Geopolitical Risk | Significant operations in Asia including China and Taiwan increase geopolitical risk exposure | Primarily US-based; less geopolitical risk but supply chain dependencies exist |
Synthesis: Both companies face market volatility risks due to high betas, but Marvell’s broader geographic footprint exposes it to higher geopolitical and regulatory risks, especially in Asia. Astera Labs shows strong balance sheet stability with no debt but struggles with operational scale and profitability. The most impactful risks currently are Marvell’s geopolitical exposure and Astera’s operational and profitability pressures. Caution is advised with both stocks given ongoing semiconductor sector uncertainties.
Which Stock to Choose?
Marvell Technology, Inc. (MRVL) shows a moderate revenue growth of 4.7% in 2025 with mixed profitability indicators, including a negative net margin of -15.35%. Its financial ratios reveal 42.9% favorable metrics, a strong liquidity position, and a B+ rating, but its ROIC is well below WACC, signaling value destruction.
Astera Labs, Inc. Common Stock (ALAB) experienced a robust 242% revenue growth in 2024 but suffers from a high negative net margin of -21.05%. Its financial ratios are 35.7% favorable with excellent liquidity and zero debt, holding a B rating. However, its ROIC remains below WACC despite a positive ROIC trend, suggesting growing yet negative profitability.
Investors seeking growth might find ALAB’s strong revenue expansion and improving ROIC trend appealing, while those valuing financial stability and a stronger rating profile may lean toward MRVL, despite its slower growth and unfavorable profitability metrics. The choice could depend on tolerance for risk and preference between growth potential and financial steadiness.
Disclaimer: Investment carries a risk of loss of initial capital. The past performance is not a reliable indicator of future results. Be sure to understand risks before making an investment decision.
Go Further
I encourage you to read the complete analyses of Marvell Technology, Inc. and Astera Labs, Inc. Common Stock to enhance your investment decisions: