Home > Comparison > Technology > ALAB vs LSCC
The strategic rivalry between Astera Labs, Inc. and Lattice Semiconductor Corporation defines the current trajectory of the semiconductor sector. Astera Labs operates as a cutting-edge connectivity solutions provider for cloud and AI infrastructure, while Lattice Semiconductor focuses on programmable gate arrays and IP licensing across diverse end markets. This head-to-head pits innovative platform architecture against established product breadth. This analysis will identify which company presents a superior risk-adjusted outlook for a diversified technology portfolio.
Table of contents
Companies Overview
Astera Labs and Lattice Semiconductor both influence the evolving semiconductor landscape with distinct market roles.
Astera Labs: Intelligent Cloud Connectivity Pioneer
Astera Labs commands a market niche in semiconductor-based connectivity solutions for cloud and AI infrastructure. Its revenue stems from a portfolio of data, network, and memory connectivity products built on a software-defined architecture. In 2026, its strategic focus remains scaling high-performance cloud and AI deployments efficiently.
Lattice Semiconductor: Versatile FPGA Innovator
Lattice Semiconductor specializes in field programmable gate arrays (FPGAs) and video connectivity products across global markets. Its core revenue engine blends direct sales and licensing of IP technology. The company prioritizes broadening its footprint in communications, computing, and automotive sectors this year.
Strategic Collision: Similarities & Divergences
Astera Labs emphasizes a software-defined platform for cloud infrastructure, while Lattice pursues an open FPGA ecosystem with diversified end markets. Both compete in semiconductor connectivity but target different layers—Astera at cloud infrastructure, Lattice at embedded systems. Their investment profiles diverge between specialized innovation and broad hardware licensing models.
Income Statement Comparison
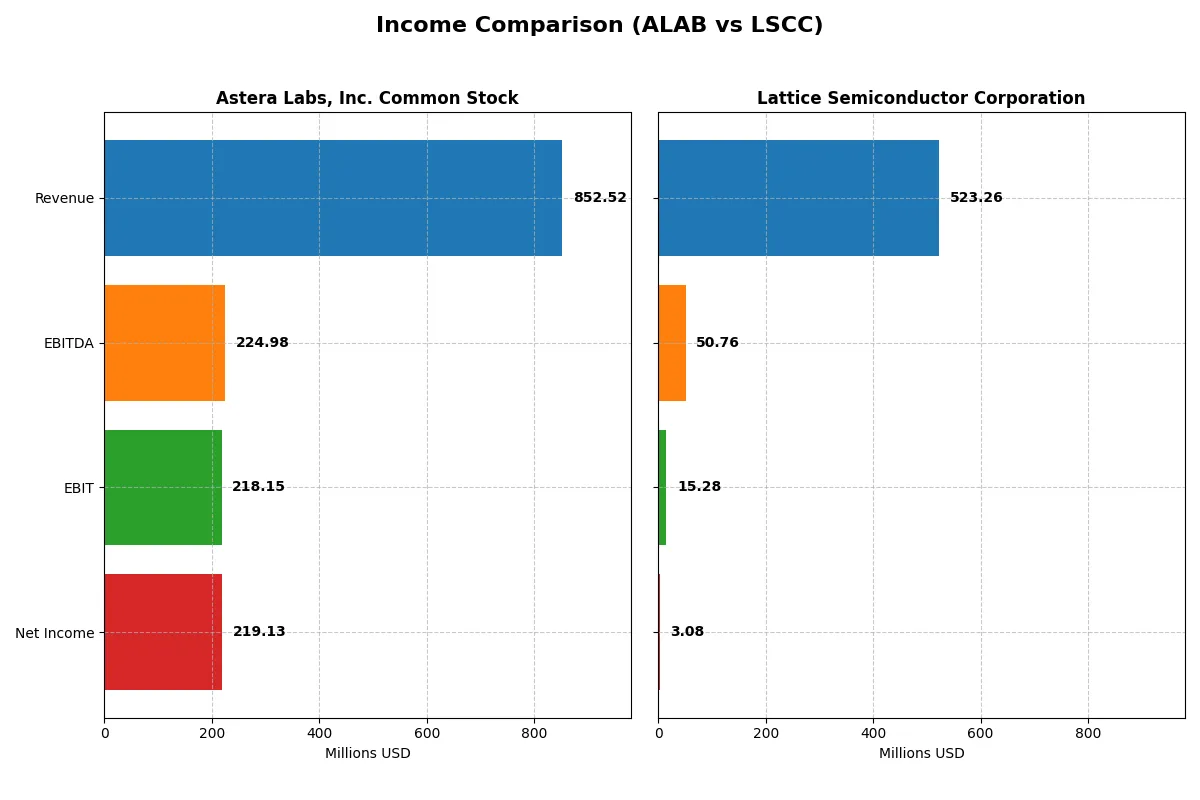
This data dissects the core profitability and scalability of both corporate engines to reveal who dominates the bottom line:
| Metric | Astera Labs, Inc. (ALAB) | Lattice Semiconductor (LSCC) |
|---|---|---|
| Revenue | 852.5M | 523.3M |
| Cost of Revenue | 207.3M | 166.3M |
| Operating Expenses | 471.8M | 341.6M |
| Gross Profit | 645.3M | 356.9M |
| EBITDA | 225.0M | 50.8M |
| EBIT | 218.2M | 15.3M |
| Interest Expense | 0 | 2.9M |
| Net Income | 219.1M | 3.1M |
| EPS | 1.32 | 0.02 |
| Fiscal Year | 2025 | 2025 |
Income Statement Analysis: The Bottom-Line Duel
This income statement comparison exposes which company runs the more efficient and profitable business engine in 2025.
Astera Labs, Inc. Common Stock (ALAB) Analysis
ALAB’s revenue skyrocketed from 115M in 2023 to 852.5M in 2025, with net income turning positive at 219M in 2025. The company sustains an impressive 75.7% gross margin and a strong net margin of 25.7%, signaling robust profitability. Its 2025 performance reflects exceptional operational momentum and margin expansion.
Lattice Semiconductor Corporation (LSCC) Analysis
LSCC’s revenue peaked at 737M in 2023 but declined to 523.3M by 2025, with net income shrinking to just 3.1M in 2025. Despite a decent 68.2% gross margin, its net margin remains weak at 0.6%. The latest year shows deteriorating profitability and a sharp drop in EBIT, highlighting operational challenges.
Margin Strength vs. Revenue Volatility
ALAB clearly outperforms LSCC in both margin quality and bottom-line growth. ALAB’s sharp revenue and earnings surge underpin its superior efficiency, while LSCC struggles to maintain profitability despite larger scale. Investors seeking growth and margin stability would find ALAB’s profile more compelling based on these results.
Financial Ratios Comparison
These vital ratios act as a diagnostic tool to expose the underlying fiscal health, valuation premiums, and capital efficiency of the companies compared below:
| Ratios | Astera Labs (ALAB) | Lattice Semiconductor (LSCC) |
|---|---|---|
| ROE | 16.1% | 0.43% |
| ROIC | 12.4% | 0.47% |
| P/E | 126.3 | 3496.2 |
| P/B | 20.3 | 15.1 |
| Current Ratio | 10.2 | 3.1 |
| Quick Ratio | 9.8 | 2.3 |
| D/E | 0 | 0.10 |
| Debt-to-Assets | 0 | 8.4% |
| Interest Coverage | 0 | 5.3 |
| Asset Turnover | 0.56 | 0.61 |
| Fixed Asset Turnover | 9.3 | 4.5 |
| Payout Ratio | 0 | 0 |
| Dividend Yield | 0 | 0 |
| Fiscal Year | 2025 | 2025 |
Efficiency & Valuation Duel: The Vital Signs
Financial ratios act as a company’s DNA, exposing hidden risks while highlighting operational strengths and valuation nuances for investors.
Astera Labs, Inc. Common Stock
Astera Labs delivers strong profitability with a 16.07% ROE and a 25.7% net margin, indicating efficient operations. However, its valuation appears stretched, with a high P/E of 126.33 and a P/B of 20.3. The company does not pay dividends but reinvests heavily in R&D, fueling growth and innovation.
Lattice Semiconductor Corporation
Lattice Semiconductor struggles with low profitability, posting a 0.43% ROE and a 0.59% net margin, signaling operational challenges. Its valuation is extremely stretched, shown by a sky-high P/E of 3,496 and a P/B of 15.1. LSCC also lacks dividends but maintains moderate reinvestment in R&D to support future potential.
Premium Valuation vs. Operational Safety
Astera Labs offers a better balance with solid profitability despite a rich valuation, while Lattice Semiconductor’s weak returns clash with an even loftier valuation. For investors prioritizing operational efficiency, Astera fits better; those chasing speculative growth face higher risk with Lattice.
Which one offers the Superior Shareholder Reward?
Astera Labs (ALAB) pays no dividends and has no buyback program, focusing on cash-rich reinvestment with a robust current ratio above 10 and free cash flow per share of 1.69. Lattice Semiconductor (LSCC) also pays no dividends but supports modest buybacks, generating positive free cash flow of 0.97 per share and maintaining stronger operating margins. LSCC’s distribution via buybacks is more sustainable, aligned with solid profitability and manageable leverage. I conclude LSCC offers a superior total shareholder return profile in 2026, balancing growth reinvestment with shareholder-friendly capital allocation.
Comparative Score Analysis: The Strategic Profile
The radar chart reveals the fundamental DNA and trade-offs of Astera Labs and Lattice Semiconductor, highlighting their core strengths and weaknesses:
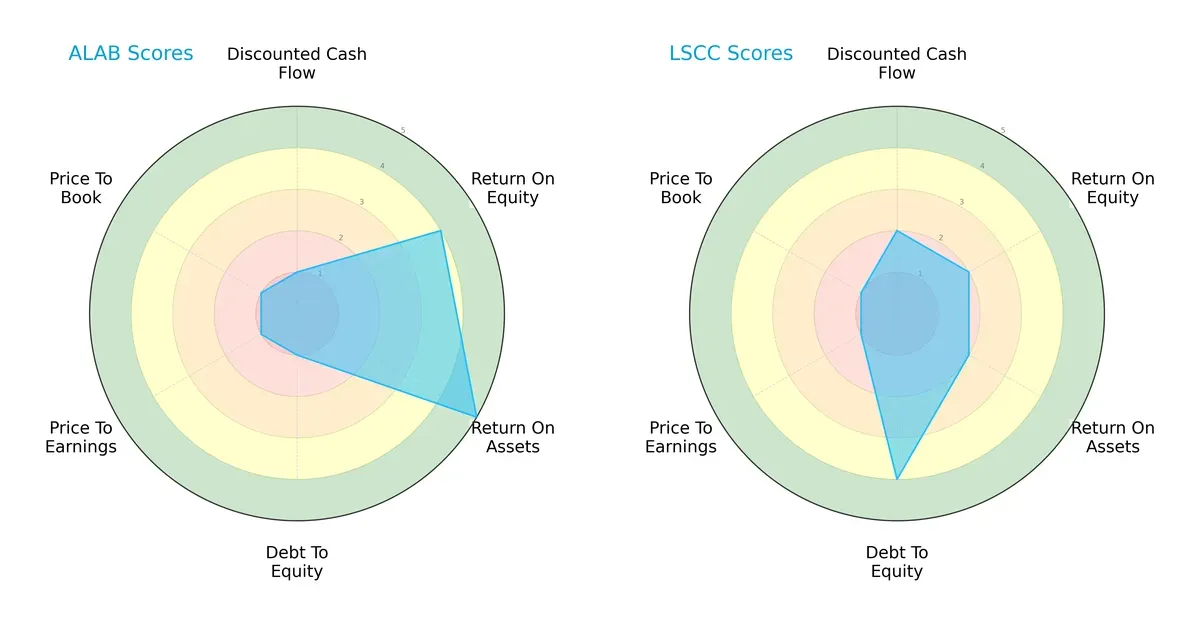
Astera Labs excels in operational efficiency with superior ROE (4) and ROA (5) scores but struggles with financial leverage and valuation, scoring very low on debt-to-equity (1), P/E (1), and P/B (1). Lattice Semiconductor presents a more balanced risk profile, boasting a strong debt-to-equity score (4) but lags behind in profitability and asset returns (ROE 2, ROA 2). Astera relies heavily on operational performance while Lattice mitigates risk through a stronger balance sheet.
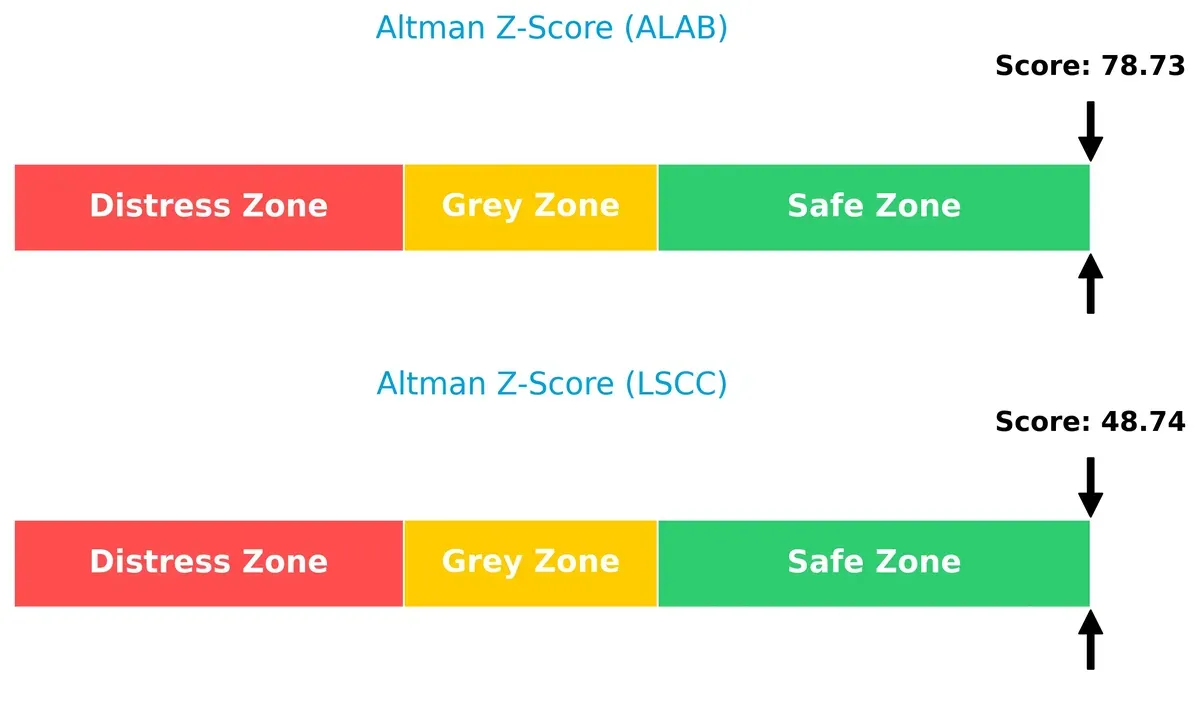
Bankruptcy Risk: Solvency Showdown
Astera Labs posts a notably higher Altman Z-Score (78.7) versus Lattice Semiconductor’s 48.7, signaling superior long-term solvency and a far lower bankruptcy risk in this cycle:
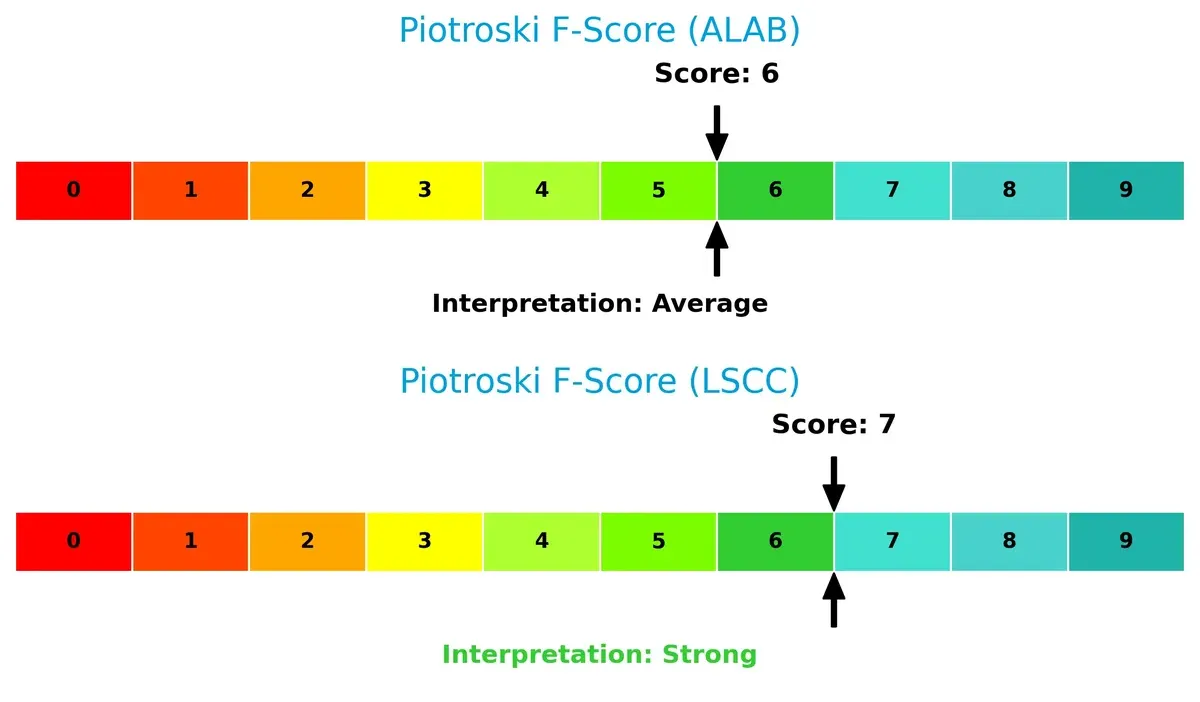
Financial Health: Quality of Operations
Lattice Semiconductor leads slightly in financial health with a Piotroski F-Score of 7, indicating strong fundamentals. Astera Labs scores 6, which is average but shows minor red flags in internal metrics relative to Lattice:
How are the two companies positioned?
This section dissects the operational DNA of Astera Labs and Lattice Semiconductor by comparing revenue distribution and internal strengths and weaknesses. The goal is to confront their economic moats to identify which business model offers the most resilient, sustainable competitive advantage today.
Revenue Segmentation: The Strategic Mix
This comparison dissects how Astera Labs and Lattice Semiconductor diversify their income streams and reveals where each bets its primary sector strength:
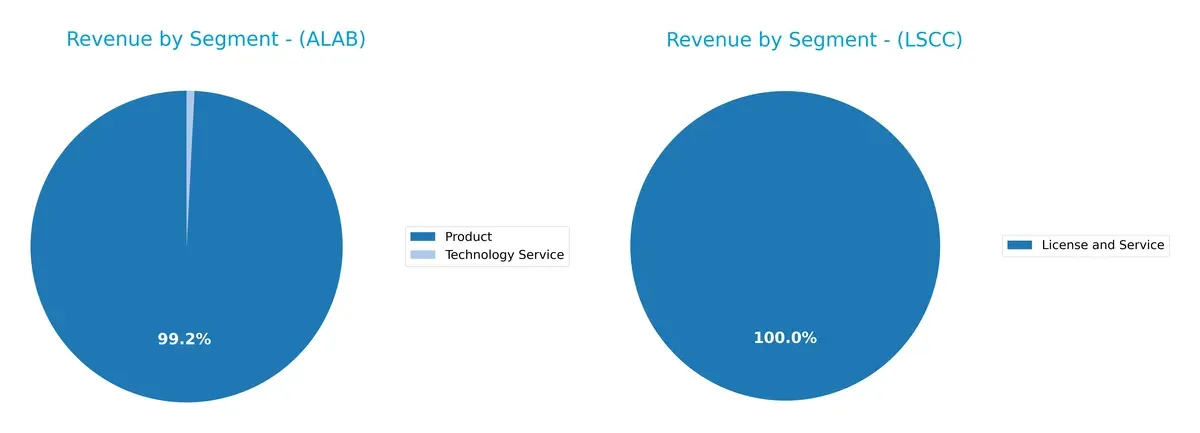
Astera Labs anchors its revenue on $393M from Product sales, with a minor $3.2M from Technology Services, showing a concentrated model. Lattice Semiconductor relies heavily on product distribution, with $331M through distributors and $50M direct product revenue in 2019, plus $21M from licensing and services. Lattice’s broader mix suggests ecosystem reach and distribution dominance, while Astera’s concentration signals higher single-segment risk but sharper product focus.
Strengths and Weaknesses Comparison
This table compares the Strengths and Weaknesses of Astera Labs (ALAB) and Lattice Semiconductor Corporation (LSCC):
ALAB Strengths
- High net margin of 25.7%
- Favorable ROE of 16.07%
- ROIC exceeds WACC at 12.4%
- Zero debt and infinite interest coverage
- Strong quick ratio at 9.79
- High fixed asset turnover at 9.26
LSCC Strengths
- Favorable quick ratio at 2.33
- Low debt-to-assets of 8.38%
- Positive interest coverage of 5.27
- Moderate asset turnover of 0.61
- Global revenue across Americas, Asia, and Europe
- Diverse product revenue streams
ALAB Weaknesses
- Unfavorable WACC of 10.74% above ROIC
- Extremely high P/E of 126.33
- High P/B ratio at 20.3
- Unusually high current ratio at 10.24 signals inefficient capital use
- No dividend yield
- Asset turnover only neutral at 0.56
LSCC Weaknesses
- Very low net margin of 0.59%
- ROE and ROIC near zero at 0.43% and 0.47%
- High WACC at 11.47%
- Extremely high P/E of 3496.18
- Unfavorable current ratio at 3.09
- No dividend yield
Astera Labs demonstrates robust profitability and capital efficiency but faces valuation and liquidity concerns. Lattice Semiconductor shows weaker profitability and elevated valuation multiples despite solid liquidity and geographic diversification. These contrasts shape each firm’s strategic focus on financial discipline and market positioning.
The Moat Duel: Analyzing Competitive Defensibility
A structural moat protects long-term profits from competition’s erosion. Without it, sustainable value creation is impossible. Let’s examine how Astera Labs and Lattice Semiconductor defend their turf:
Astera Labs, Inc. Common Stock: Emerging Connectivity Innovator
Astera Labs’ moat lies in its intangible assets and software-defined architecture. This fuels 25.7% net margins and 135% ROIC growth through 2025. New AI infrastructure markets could deepen its advantage.
Lattice Semiconductor Corporation: Legacy IP Licensing and FPGA Expertise
Lattice leans on established technology IP and diversified FPGA products. Yet, its slim 0.6% net margin and sharply declining ROIC signal a weakening moat. Market disruption risks persist without innovation boosts.
Connectivity Architecture vs. Legacy IP: The Moat Showdown
Astera Labs exhibits a growing moat with robust profitability and innovation-driven growth. Lattice’s fading returns and value destruction highlight a fragile moat. Astera is better positioned to defend and expand its market share.
Which stock offers better returns?
Astera Labs and Lattice Semiconductor show contrasting price dynamics over the past year, with Astera Labs experiencing a sharp overall rise but recent pullback, while Lattice Semiconductor displays steady acceleration and buyer dominance.
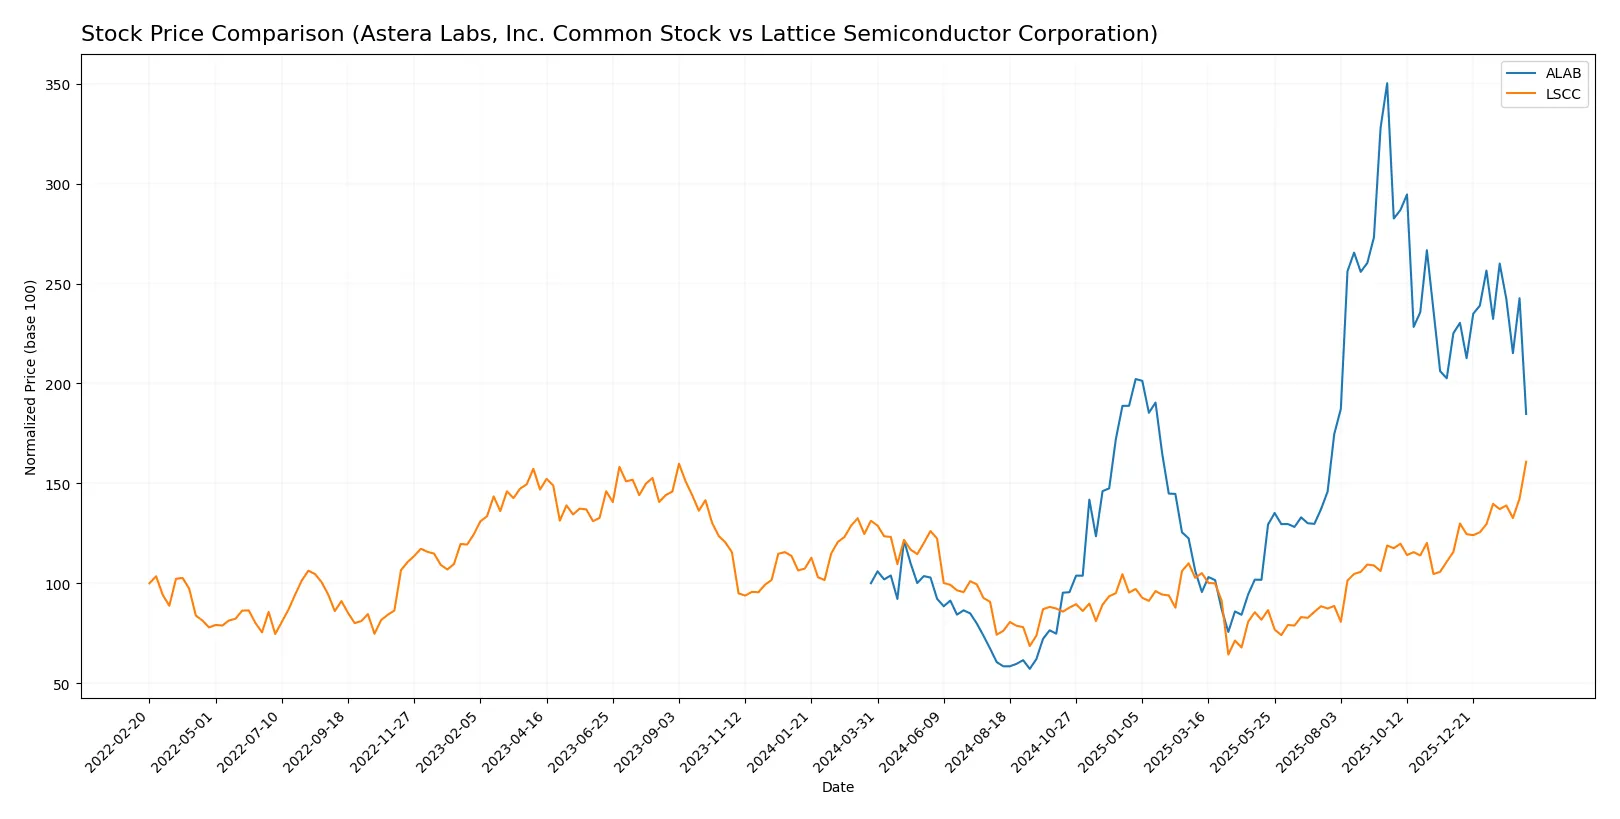
Trend Comparison
Astera Labs’ stock surged 84.74% over the past year, signaling a strong bullish trend with decelerating momentum. It reached a high of 245.2 but recently declined 17.93%, indicating short-term weakness.
Lattice Semiconductor gained 22.53% over the past year, maintaining a bullish trend with accelerating momentum. Its recent 39.05% rise shows robust strength and buyer dominance amid decreasing volume.
Astera Labs outperformed Lattice Semiconductor in overall returns despite recent softness, delivering the highest market performance across the 12-month period analyzed.
Target Prices
Analysts present moderately bullish target prices for both Astera Labs and Lattice Semiconductor.
| Company | Target Low | Target High | Consensus |
|---|---|---|---|
| Astera Labs, Inc. Common Stock | 165 | 225 | 202.14 |
| Lattice Semiconductor Corporation | 80 | 125 | 104.7 |
Astera Labs’ consensus target of 202.14 implies a 56% upside from its 129.32 price. Lattice Semiconductor’s target consensus suggests a 7% gain potential from 97.63.

Don’t Let Luck Decide Your Entry Point
Optimize your entry points with our advanced ProRealTime indicators. You’ll get efficient buy signals with precise price targets for maximum performance. Start outperforming now!
How do institutions grade them?
The following tables summarize recent institutional grades for Astera Labs, Inc. and Lattice Semiconductor Corporation:
Astera Labs, Inc. Common Stock Grades
This table shows the latest grades from key financial institutions for Astera Labs, Inc.:
| Grading Company | Action | New Grade | Date |
|---|---|---|---|
| Citigroup | Maintain | Buy | 2026-02-11 |
| Northland Capital Markets | Maintain | Outperform | 2025-12-09 |
| Northland Capital Markets | Upgrade | Outperform | 2025-11-17 |
| Stifel | Maintain | Buy | 2025-11-05 |
| Needham | Maintain | Buy | 2025-11-05 |
| Roth Capital | Maintain | Buy | 2025-11-05 |
| JP Morgan | Maintain | Overweight | 2025-11-05 |
| Morgan Stanley | Maintain | Overweight | 2025-11-05 |
| TD Cowen | Maintain | Hold | 2025-11-05 |
| Barclays | Downgrade | Equal Weight | 2025-10-20 |
Lattice Semiconductor Corporation Grades
This table shows the latest grades from key financial institutions for Lattice Semiconductor Corporation:
| Grading Company | Action | New Grade | Date |
|---|---|---|---|
| Susquehanna | Maintain | Positive | 2026-02-11 |
| Jefferies | Maintain | Buy | 2026-02-11 |
| Keybanc | Maintain | Overweight | 2026-02-11 |
| Stifel | Maintain | Buy | 2026-02-11 |
| Needham | Maintain | Buy | 2026-02-11 |
| Benchmark | Maintain | Buy | 2026-02-11 |
| RBC Capital | Maintain | Outperform | 2026-02-11 |
| Rosenblatt | Maintain | Buy | 2026-02-11 |
| Susquehanna | Maintain | Positive | 2026-01-22 |
| Keybanc | Maintain | Overweight | 2026-01-13 |
Which company has the best grades?
Both companies receive predominantly positive ratings, but Lattice Semiconductor has more consistent “Buy” and “Outperform” grades across multiple firms. This consistency may signal stronger analyst confidence, potentially influencing investor sentiment.
Risks specific to each company
The following categories identify critical pressure points and systemic threats facing both firms in the 2026 market environment:
1. Market & Competition
Astera Labs, Inc. Common Stock
- Operates in high-growth cloud and AI connectivity, facing intense innovation race and established rivals.
Lattice Semiconductor Corporation
- Serves diverse markets with programmable chips, challenged by rapid tech shifts and competition from larger peers.
2. Capital Structure & Debt
Astera Labs, Inc. Common Stock
- Zero debt, providing strong financial flexibility but possibly limiting leverage benefits.
Lattice Semiconductor Corporation
- Low debt ratio (~8.4%), manageable interest coverage, balancing risk and growth funding.
3. Stock Volatility
Astera Labs, Inc. Common Stock
- Beta at 1.51 indicates moderately high volatility, reflecting market sensitivity.
Lattice Semiconductor Corporation
- Higher beta at 1.67 suggests greater stock price swings and risk exposure.
4. Regulatory & Legal
Astera Labs, Inc. Common Stock
- Operating in US tech hub, must navigate evolving semiconductor export controls and data security laws.
Lattice Semiconductor Corporation
- Global footprint increases exposure to multi-jurisdictional compliance and IP litigation risks.
5. Supply Chain & Operations
Astera Labs, Inc. Common Stock
- Relies on a software-defined hardware platform; supply chain may face bottlenecks amid industry cyclicality.
Lattice Semiconductor Corporation
- Extensive global manufacturing network sensitive to geopolitical disruptions and component shortages.
6. ESG & Climate Transition
Astera Labs, Inc. Common Stock
- Emerging company with limited ESG disclosures; potential risks in environmental impact and governance.
Lattice Semiconductor Corporation
- Larger scale demands robust ESG strategies; climate transition may pressure operational costs.
7. Geopolitical Exposure
Astera Labs, Inc. Common Stock
- Primarily US-based with limited direct geopolitical risks but exposed to global tech tensions.
Lattice Semiconductor Corporation
- Serves Asia, Europe, Americas; exposed to trade tensions, sanctions, and supply chain disruptions.
Which company shows a better risk-adjusted profile?
Astera Labs faces its biggest risk in market competition, given its nascent stage and high valuation multiples. Lattice Semiconductor’s primary risk lies in regulatory and geopolitical exposure due to its broader global footprint. Astera’s zero debt and strong liquidity create a safer financial cushion. Despite higher volatility, Astera’s favorable Altman Z-score and Piotroski rating suggest better financial stability. Conversely, Lattice’s weaker profitability and elevated P/E ratio raise concerns. Overall, Astera Labs offers a superior risk-adjusted profile supported by solid balance sheet fundamentals and focused market positioning.
Final Verdict: Which stock to choose?
Astera Labs (ALAB) stands out with its unmatched growth engine and efficiency in capital allocation. Its rapidly expanding profitability signals a company on the rise. The main point of vigilance is its sky-high valuation multiples, which could strain returns if growth slows. ALAB suits aggressive growth portfolios willing to embrace volatility.
Lattice Semiconductor (LSCC) offers a strategic moat rooted in diversified intellectual property and steady recurring revenue streams. While its recent performance lags ALAB’s dynamism, LSCC provides better balance-sheet resilience and a more stable cash conversion cycle. This makes it more fitting for GARP investors seeking steady growth without aggressive risk.
If you prioritize high-growth momentum and can tolerate valuation risk, ALAB is the compelling choice due to its accelerating profitability and strong capital efficiency. However, if you seek better stability and lower operational risk, LSCC offers superior financial durability and a more consistent income profile, despite slower growth.
Disclaimer: Investment carries a risk of loss of initial capital. The past performance is not a reliable indicator of future results. Be sure to understand risks before making an investment decision.
Go Further
I encourage you to read the complete analyses of Astera Labs, Inc. Common Stock and Lattice Semiconductor Corporation to enhance your investment decisions: