Home > Comparison > Technology > LRCX vs ALAB
The strategic rivalry between Lam Research Corporation and Astera Labs, Inc. shapes the semiconductor industry’s evolution. Lam Research, a capital-intensive semiconductor equipment manufacturer, contrasts with Astera Labs, a nimble innovator in semiconductor connectivity solutions for cloud and AI infrastructure. This battle highlights a clash between established manufacturing scale and cutting-edge technology integration. This analysis seeks to identify which company offers the superior risk-adjusted return potential for a diversified technology portfolio.
Table of contents
Companies Overview
Lam Research Corporation and Astera Labs, Inc. represent pivotal players in the semiconductor industry, shaping hardware for diverse tech applications.
Lam Research Corporation: Semiconductor Equipment Powerhouse
Lam Research commands the semiconductor equipment sector by designing and servicing advanced fabrication tools. Its core revenue derives from sophisticated equipment like etchers and deposition systems critical for integrated circuit manufacturing. In 2026, its strategy centers on expanding precision technology to support advanced node production and global wafer fabrication.
Astera Labs, Inc. Common Stock: Connectivity Innovator for Cloud AI
Astera Labs focuses on semiconductor-based connectivity solutions tailored for cloud and AI infrastructure. The company’s revenue engine relies on its Intelligent Connectivity Platform, which integrates data and memory connectivity products under software-defined architecture. Its 2026 strategy targets scaling high-performance cloud infrastructure through innovative, flexible connectivity.
Strategic Collision: Similarities & Divergences
Both firms drive semiconductor innovation but diverge in focus: Lam Research develops hardware manufacturing tools, while Astera Labs pioneers connectivity solutions. Their primary battleground is the semiconductor supply chain’s evolving complexity, with Lam enhancing fabrication precision and Astera enabling data flow. Investors face a contrast: Lam’s established global footprint versus Astera’s emerging role in cloud-AI connectivity infrastructure.
Income Statement Comparison
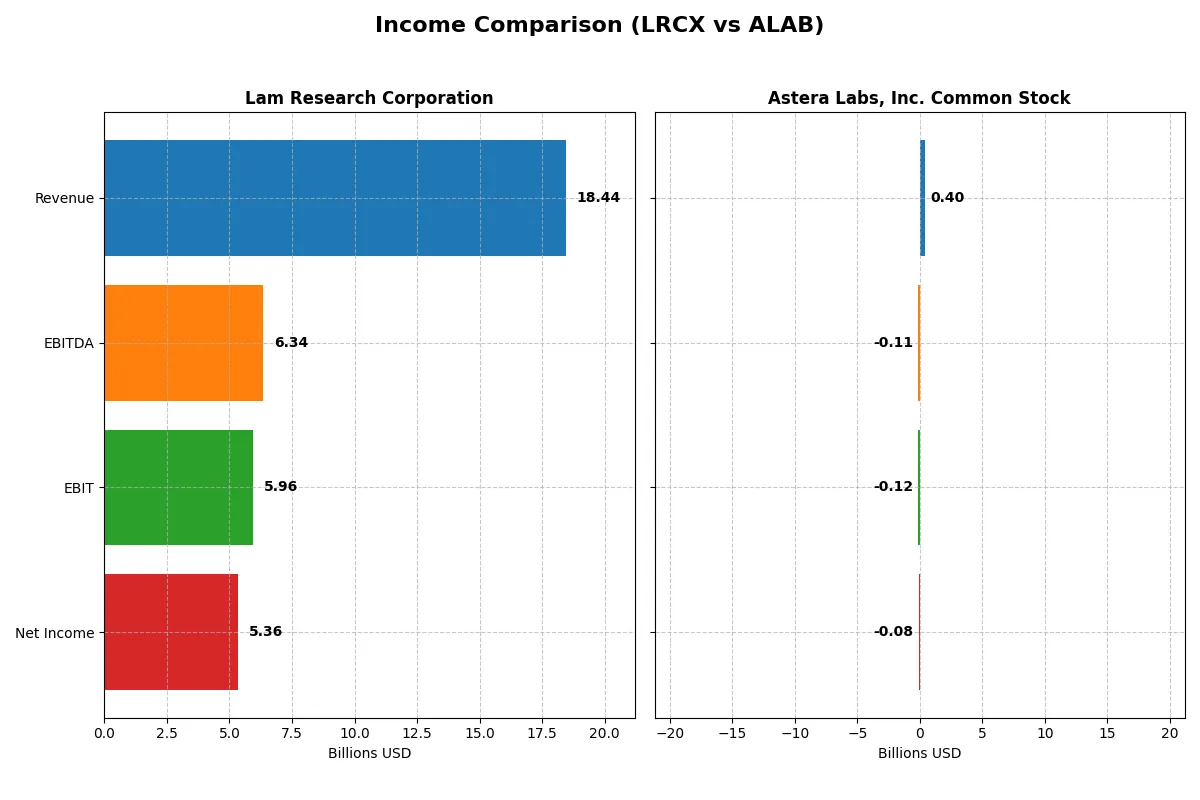
This table dissects the core profitability and scalability of both corporate engines to reveal who dominates the bottom line:
| Metric | Lam Research Corporation (LRCX) | Astera Labs, Inc. Common Stock (ALAB) |
|---|---|---|
| Revenue | 18.4B | 396M |
| Cost of Revenue | 9.5B | 94M |
| Operating Expenses | 3.1B | 419M |
| Gross Profit | 9.0B | 303M |
| EBITDA | 6.3B | -113M |
| EBIT | 6.0B | -116M |
| Interest Expense | 178M | 0 |
| Net Income | 5.4B | -83M |
| EPS | 4.17 | -0.64 |
| Fiscal Year | 2025 | 2024 |
Income Statement Analysis: The Bottom-Line Duel
This income statement comparison reveals the true operational efficiency and profitability trajectories of two distinct corporate engines.
Lam Research Corporation Analysis
Lam Research’s revenue climbed from $14.6B in 2021 to $18.4B in 2025, with net income surging from $3.9B to $5.4B. Its gross margin steadied near 49%, while net margin improved to 29%. The 2025 fiscal year shows robust momentum, driven by efficient cost control and a 31% EBIT growth, underscoring operational strength and sustained profitability.
Astera Labs, Inc. Common Stock Analysis
Astera Labs expanded revenue sharply from $80M in 2022 to $396M in 2024, yet net income remained negative, widening losses to $83M in 2024. Despite a strong gross margin of 76%, heavy operating expenses pushed EBIT to a negative 29% margin. The company’s rapid top-line growth contrasts with persistent unprofitability, reflecting early-stage scaling challenges.
Margin Resilience vs. Growth Struggles
Lam Research demonstrates consistent margin resilience and steady net income growth, clearly outpacing Astera’s volatile performance. While Astera’s revenue growth impresses, its negative profitability and high operating costs undermine financial efficiency. For investors prioritizing profitability and margin stability, Lam’s profile offers a more compelling and fundamentally sound investment foundation.
Financial Ratios Comparison
These vital ratios act as a diagnostic tool to expose the underlying fiscal health, valuation premiums, and capital efficiency of the companies compared below:
| Ratios | Lam Research Corporation (LRCX) | Astera Labs, Inc. Common Stock (ALAB) |
|---|---|---|
| ROE | 54.3% | -8.6% |
| ROIC | 34.0% | -12.0% |
| P/E | 23.4 | -208.4 |
| P/B | 12.7 | 18.0 |
| Current Ratio | 2.21 | 11.7 |
| Quick Ratio | 1.55 | 11.2 |
| D/E | 0.48 | 0.0013 |
| Debt-to-Assets | 22.3% | 0.12% |
| Interest Coverage | 33.1 | 0 |
| Asset Turnover | 0.86 | 0.38 |
| Fixed Asset Turnover | 7.59 | 11.1 |
| Payout ratio | 21.5% | 0 |
| Dividend yield | 0.92% | 0 |
| Fiscal Year | 2025 | 2024 |
Efficiency & Valuation Duel: The Vital Signs
Financial ratios serve as a company’s DNA, unveiling hidden risks and operational strengths crucial for informed investment decisions.
Lam Research Corporation
Lam Research demonstrates robust profitability with a 54.33% ROE and a healthy 29.06% net margin, signaling strong operational efficiency. Its P/E ratio of 23.36 suggests a fairly valued stock, while a 0.92% dividend yield offers modest shareholder returns. The firm reinvests heavily in R&D, fueling sustainable growth.
Astera Labs, Inc. Common Stock
Astera Labs struggles with negative profitability metrics: a -8.65% ROE and a -21.05% net margin reflect operational challenges. Despite an unusual negative P/E, its valuation appears stretched. The company pays no dividends, instead allocating significant resources to R&D, aiming to establish future growth amid current losses.
Operational Strength vs. Growth Risk
Lam Research offers a balanced profile with strong profitability and reasonable valuation, aligning with operational safety. Astera Labs presents growth potential but carries heightened risk from persistent losses and stretched valuation. Investors seeking stability may favor Lam; those embracing risk could consider Astera’s long-term innovation play.
Which one offers the Superior Shareholder Reward?
I compare Lam Research Corporation (LRCX) and Astera Labs, Inc. (ALAB) based on their shareholder return models in 2026. LRCX pays a modest dividend yield around 0.9% with a sustainable payout ratio near 21%, supported by strong free cash flow coverage above 80%. Its share buybacks are steady, enhancing total returns. ALAB pays no dividends and incurs losses, focusing on reinvestment in R&D and growth to build future value. Its buyback activity is negligible due to cash constraints and negative earnings. Historically, LRCX’s balanced dividend and buyback strategy offers a more reliable and sustainable shareholder reward. I conclude LRCX presents the superior total return profile for investors seeking income and capital appreciation in 2026.
Comparative Score Analysis: The Strategic Profile
The radar chart reveals the core DNA and trade-offs between Lam Research Corporation and Astera Labs, highlighting their financial strengths and weaknesses:
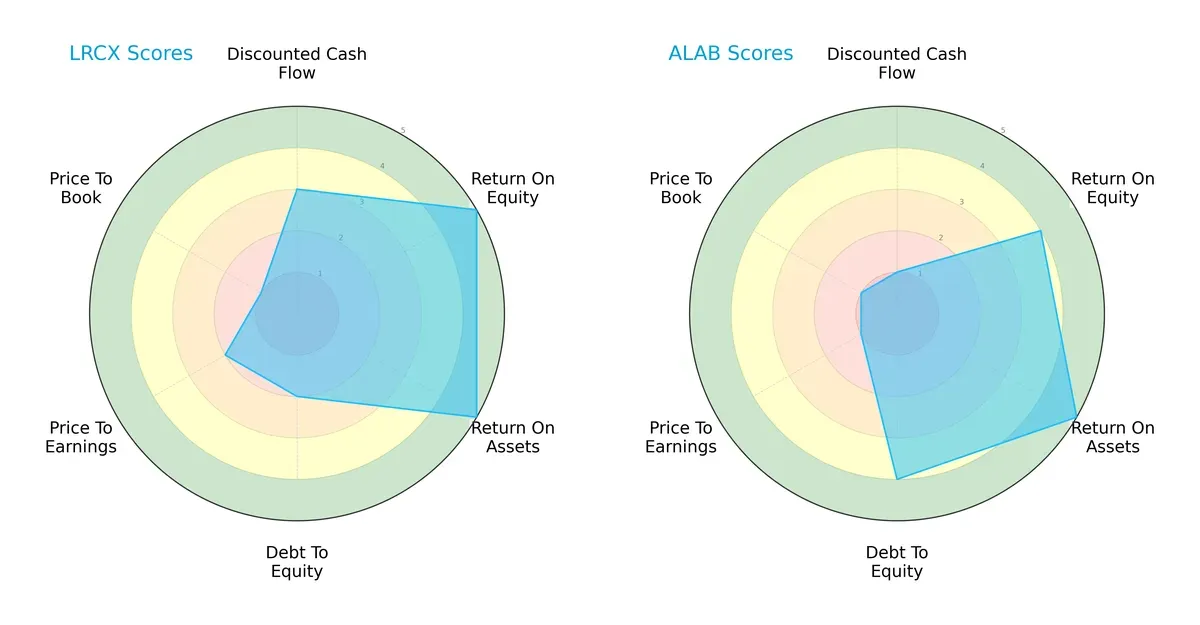
Lam Research excels in profitability metrics with top ROE (5) and ROA (5) scores, showcasing operational efficiency. Astera Labs shows strength in balance sheet management with a better Debt/Equity score (4 vs. 2) but struggles on valuation and cash flow scores. Lam Research presents a more balanced profile, while Astera Labs relies heavily on conservative leverage to offset weaker cash flow and valuation metrics.
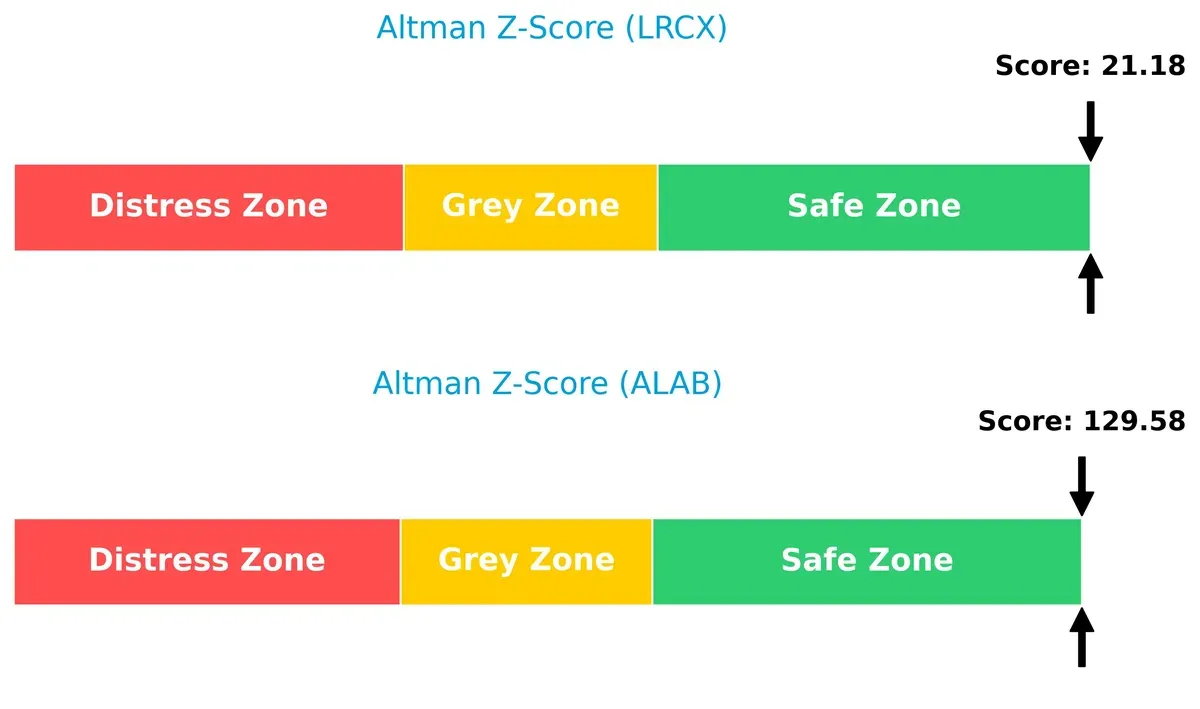
Bankruptcy Risk: Solvency Showdown
Lam Research and Astera Labs both sit comfortably in the safe zone, but Astera Labs’ Altman Z-Score (130) far exceeds Lam Research’s (21), signaling exceptionally strong solvency and extremely low bankruptcy risk in this cycle:
Financial Health: Quality of Operations
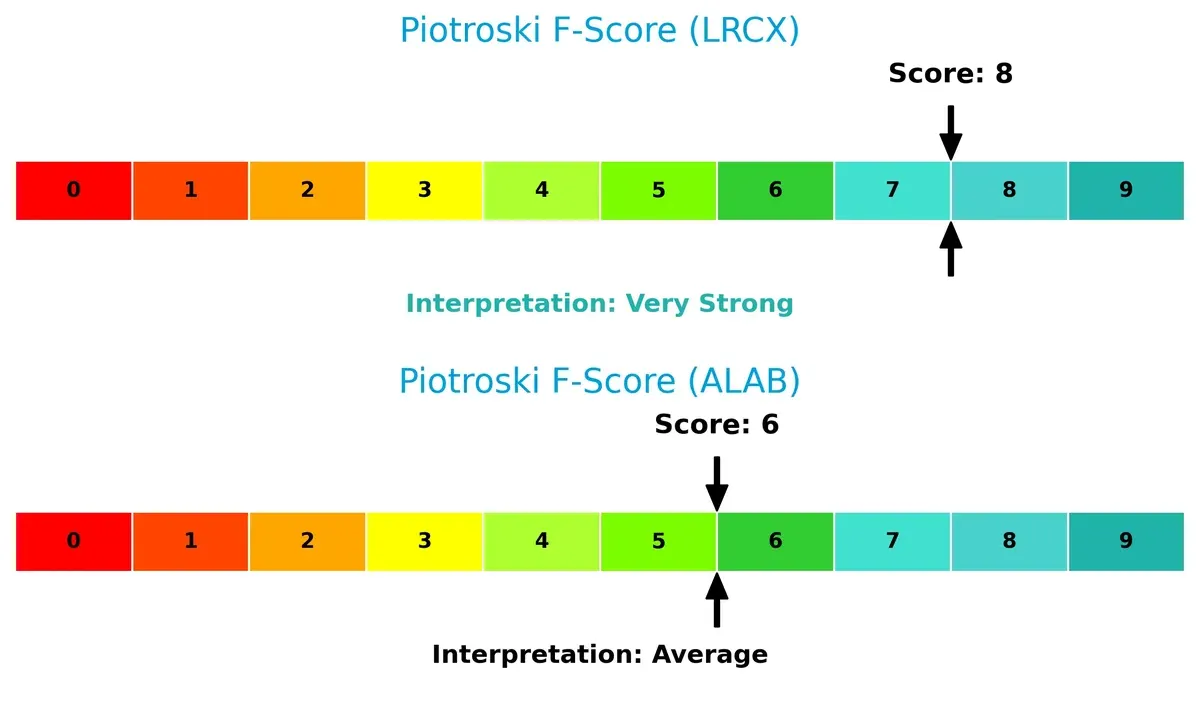
Lam Research’s Piotroski F-Score of 8 indicates very strong financial health, outperforming Astera Labs’ 6, which is average and suggests some internal operational weaknesses relative to its peer:
How are the two companies positioned?
This section dissects the operational DNA of Lam Research and Astera Labs by comparing their revenue distribution and internal dynamics. The goal is to confront their economic moats to determine which model offers the most resilient competitive advantage today.
Revenue Segmentation: The Strategic Mix
The following comparison dissects how Lam Research Corporation and Astera Labs diversify their income streams and reveals where their primary sector bets lie:
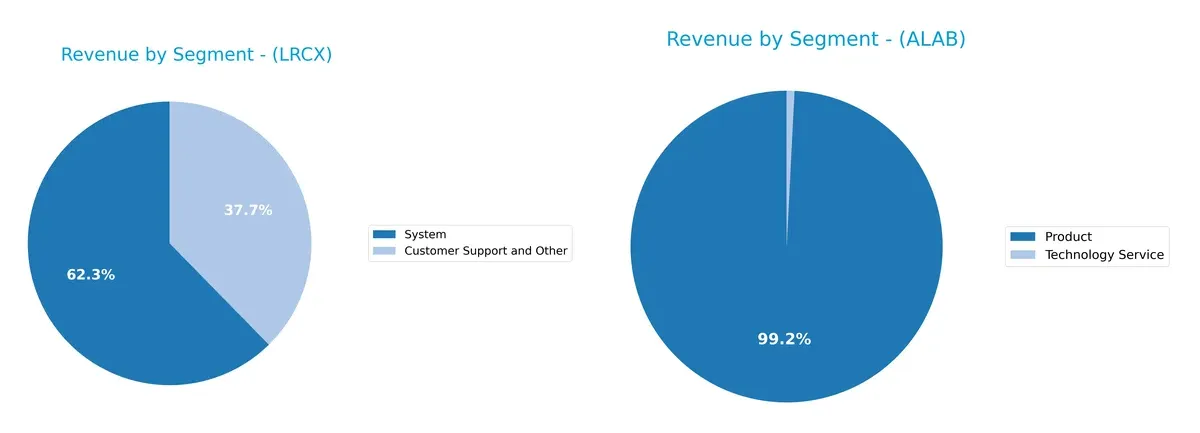
Lam Research dominates with a two-segment model: $11.5B from Systems and $6.9B from Customer Support, showing a balanced but System-anchored portfolio. Astera Labs leans heavily on Product revenue at $393M, with minimal Technology Service income. Lam’s mix suggests infrastructure dominance and ecosystem lock-in, while Astera’s reliance on one segment signals higher concentration risk and less diversification in 2024.
Strengths and Weaknesses Comparison
This table compares the Strengths and Weaknesses of Lam Research Corporation and Astera Labs, Inc. Common Stock:
Lam Research Corporation Strengths
- Strong profitability with 29.06% net margin
- High ROE at 54.33% and ROIC 34.0%
- Favorable current and quick ratios indicate liquidity
- Global presence across major regions including China and US
- Diversified revenue from systems and customer support
Astera Labs, Inc. Common Stock Strengths
- Favorable price-to-earnings ratio despite net losses
- Very high quick ratio at 11.21 signals short-term liquidity
- Zero debt and low debt-to-assets ratio ensure low financial risk
- Strong fixed asset turnover at 11.12 indicates efficient asset use
- Concentrated revenue focus on product sales
Lam Research Corporation Weaknesses
- Unfavorable weighted average cost of capital at 12.05%
- High price-to-book ratio at 12.69 suggests overvaluation
- Dividend yield below 1% limits income appeal
- Moderate asset turnover at 0.86 signals room for improvement
Astera Labs, Inc. Common Stock Weaknesses
- Negative profitability metrics with net margin -21.05% and ROE -8.65%
- Unfavorable current ratio despite high quick ratio
- Interest coverage at zero poses solvency risk
- Unfavorable asset turnover at 0.38 reflects low operational efficiency
- No dividend yield limits shareholder returns
Lam Research demonstrates solid profitability and global diversification, supporting its strategic positioning. Astera Labs faces significant profitability challenges but maintains strong liquidity and low financial risk, reflecting a growth-stage profile requiring operational improvements.
The Moat Duel: Analyzing Competitive Defensibility
A structural moat is the only true shield against profit erosion from competition over the long haul:
Lam Research Corporation: Durable Technology and Scale Moat
Lam Research’s moat stems from advanced semiconductor equipment and scale economies. It sustains high ROIC (22% above WACC) and margin stability. New process innovations and Asia expansion deepen this moat in 2026.
Astera Labs, Inc. Common Stock: Emerging Innovation Moat
Astera Labs relies on cutting-edge connectivity for cloud AI infrastructure, contrasting Lam’s scale with a tech-first moat. Despite current negative ROIC, rapid revenue growth signals potential moat expansion if profitability improves.
Innovation Depth vs. Scale Dominance: The Semiconductor Moat Battle
Lam Research’s proven, wide moat outmatches Astera Labs’ nascent, narrower moat. Lam’s consistent value creation and global reach better defend market share amid intensifying competition.
Which stock offers better returns?
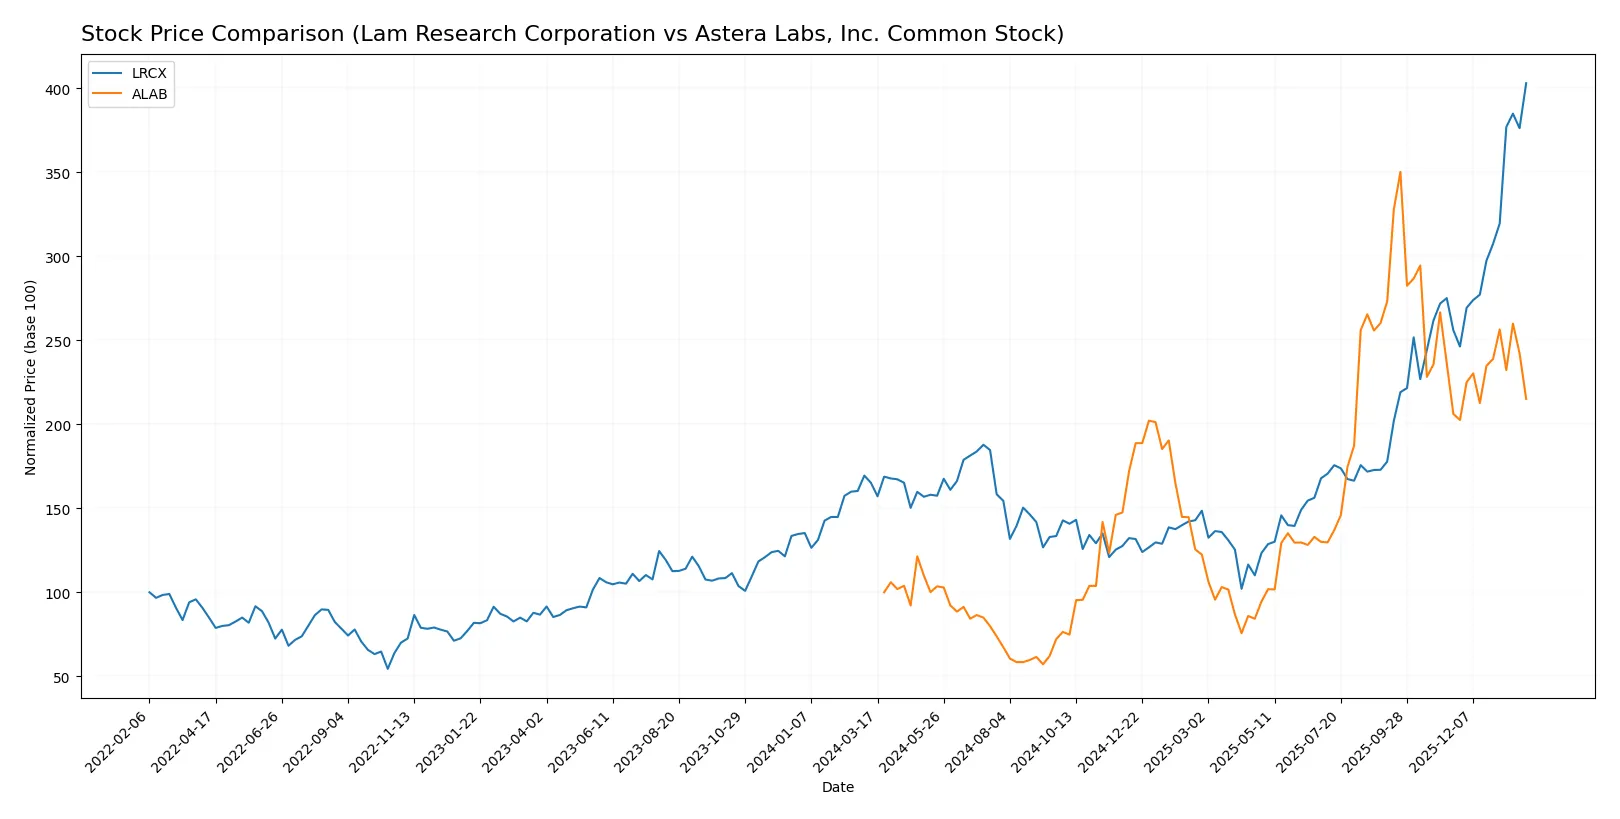
The past year shows strong bullish momentum for both stocks, with Lam Research accelerating sharply and Astera Labs gaining steadily despite more mixed recent trading activity.
Trend Comparison
Lam Research’s stock price rose 144.03% over the past 12 months, showing bullish acceleration. It reached a high of 233.46 and a low of 59.09, with volatility measured by a 36.82 standard deviation.
Astera Labs gained 115.17% in the same period, also bullish with acceleration. It exhibited higher volatility at a 50.39 standard deviation, reaching a high of 245.2 and a low of 40.0.
Lam Research delivered the higher market performance, outpacing Astera Labs by nearly 29 percentage points over the year.
Target Prices
Analysts show a wide but optimistic target price range for Lam Research Corporation and Astera Labs, reflecting growth potential amid semiconductor sector volatility.
| Company | Target Low | Target High | Consensus |
|---|---|---|---|
| Lam Research Corporation | 127 | 325 | 266.76 |
| Astera Labs, Inc. Common Stock | 165 | 225 | 202.14 |
The consensus targets for Lam Research stand about 14% above its current 233.46 price, signaling confidence despite recent pullbacks. Astera Labs’ consensus target exceeds its 150.62 price by roughly 34%, indicating significant expected appreciation.

Don’t Let Luck Decide Your Entry Point
Optimize your entry points with our advanced ProRealTime indicators. You’ll get efficient buy signals with precise price targets for maximum performance. Start outperforming now!
How do institutions grade them?
Lam Research Corporation Grades
Here are the latest grades from major institutions for Lam Research Corporation:
| Grading Company | Action | New Grade | Date |
|---|---|---|---|
| Susquehanna | Maintain | Positive | 2026-01-29 |
| Citigroup | Maintain | Buy | 2026-01-29 |
| RBC Capital | Maintain | Outperform | 2026-01-29 |
| Needham | Maintain | Buy | 2026-01-29 |
| UBS | Maintain | Buy | 2026-01-29 |
| Cantor Fitzgerald | Maintain | Overweight | 2026-01-29 |
| Goldman Sachs | Maintain | Buy | 2026-01-29 |
| Morgan Stanley | Maintain | Equal Weight | 2026-01-29 |
| Wells Fargo | Maintain | Overweight | 2026-01-29 |
| Stifel | Maintain | Buy | 2026-01-29 |
Astera Labs, Inc. Common Stock Grades
Below are the recent institutional grades for Astera Labs, Inc. Common Stock:
| Grading Company | Action | New Grade | Date |
|---|---|---|---|
| Northland Capital Markets | Maintain | Outperform | 2025-12-09 |
| Northland Capital Markets | Upgrade | Outperform | 2025-11-17 |
| Needham | Maintain | Buy | 2025-11-05 |
| JP Morgan | Maintain | Overweight | 2025-11-05 |
| TD Cowen | Maintain | Hold | 2025-11-05 |
| Morgan Stanley | Maintain | Overweight | 2025-11-05 |
| Roth Capital | Maintain | Buy | 2025-11-05 |
| Stifel | Maintain | Buy | 2025-11-05 |
| Barclays | Downgrade | Equal Weight | 2025-10-20 |
| Stifel | Maintain | Buy | 2025-10-17 |
Which company has the best grades?
Lam Research receives consistently positive to buy ratings from a broad range of top-tier firms. Astera Labs has a mix of outperform and buy ratings but includes some hold and downgrade actions. Lam Research’s more stable and broadly positive grades suggest stronger institutional confidence, which may influence investor sentiment.
Risks specific to each company
The following categories identify the critical pressure points and systemic threats facing both firms in the 2026 market environment:
1. Market & Competition
Lam Research Corporation
- Established leader in semiconductor equipment with a large market cap of $291.5B. Faces intense competition in mature markets.
Astera Labs, Inc. Common Stock
- Smaller $25.4B player focused on connectivity solutions for cloud and AI infrastructure, competing in a niche but rapidly evolving segment.
2. Capital Structure & Debt
Lam Research Corporation
- Maintains a moderate debt-to-equity ratio (0.48) and strong interest coverage (33.4), indicating solid financial stability.
Astera Labs, Inc. Common Stock
- Virtually no debt (debt-to-equity 0.0) but zero interest coverage due to lack of earnings, raising concerns about financial leverage if growth stalls.
3. Stock Volatility
Lam Research Corporation
- Beta at 1.78 suggests higher volatility than the market; price range wide but near all-time highs.
Astera Labs, Inc. Common Stock
- Beta at 1.51, also volatile; stock recently retraced from highs, reflecting high investor uncertainty in a younger firm.
4. Regulatory & Legal
Lam Research Corporation
- Operates globally with exposure to US-China tech tensions and export controls on semiconductor equipment.
Astera Labs, Inc. Common Stock
- Faces regulatory scrutiny in cloud and AI sectors, with potential IP and data security legal risks.
5. Supply Chain & Operations
Lam Research Corporation
- Complex global supply chain vulnerable to geopolitical disruptions but benefits from scale and established vendor relationships.
Astera Labs, Inc. Common Stock
- Supply chain risks higher due to smaller scale and reliance on specialized components for AI infrastructure.
6. ESG & Climate Transition
Lam Research Corporation
- Increasing pressure to reduce carbon footprint in manufacturing processes; has initiatives but faces industry-wide challenges.
Astera Labs, Inc. Common Stock
- ESG focus emerging; must address sustainability in cloud infrastructure and semiconductor materials sourcing.
7. Geopolitical Exposure
Lam Research Corporation
- Significant exposure to Asia-Pacific markets, especially China, subject to trade tensions and regulatory shifts.
Astera Labs, Inc. Common Stock
- Also exposed to international markets but less so; US-centric with growth tied to AI/cloud infrastructure demand.
Which company shows a better risk-adjusted profile?
Lam Research’s most impactful risk is geopolitical exposure and competitive maturity, but its robust financials and scale offer resilience. Astera Labs faces critical operational and financial risks from negative profitability and unproven market position. Lam Research delivers a superior risk-adjusted profile, supported by a safe-zone Altman Z-score of 21.2 and a very strong Piotroski score of 8. Astera’s negative margins and weak coverage amplify concerns despite growth potential.
Final Verdict: Which stock to choose?
Lam Research’s superpower lies in its durable economic moat, fueled by a consistently high ROIC well above its WACC. This cash-generative machine excels in capital allocation and operational efficiency. A point of vigilance remains its premium valuation metrics, which could pressure returns if growth slows. It fits best in aggressive growth portfolios focused on quality and profitability.
Astera Labs commands a strategic moat through its rapid revenue expansion and innovative R&D focus, despite current profitability challenges. Its high liquidity and low leverage provide a safety cushion that Lam Research lacks. This profile suits investors seeking GARP (Growth at a Reasonable Price) with tolerance for early-stage volatility and potential turnaround.
If you prioritize durable value creation and operational excellence, Lam Research outshines as the compelling choice due to its proven profitability and strong financial health. However, if you seek high-growth potential with a tolerance for risk, Astera Labs offers better stability in capital structure and a promising innovation runway, albeit with significant execution risk.
Disclaimer: Investment carries a risk of loss of initial capital. The past performance is not a reliable indicator of future results. Be sure to understand risks before making an investment decision.
Go Further
I encourage you to read the complete analyses of Lam Research Corporation and Astera Labs, Inc. Common Stock to enhance your investment decisions: