Home > Comparison > Technology > KLAC vs ALAB
The strategic rivalry between KLA Corporation and Astera Labs defines the current trajectory of the semiconductor industry. KLA operates as a capital-intensive process control and yield management powerhouse, while Astera Labs pursues high-growth semiconductor connectivity solutions for cloud and AI infrastructure. This head-to-head pits mature industrial strength against agile innovation. This analysis will determine which corporate path offers superior risk-adjusted returns for a diversified technology portfolio.

Table of contents
Companies Overview
KLA Corporation and Astera Labs stand as key innovators within the semiconductor sector, shaping critical technology infrastructure.
KLA Corporation: Semiconductor Process Control Leader
KLA Corporation dominates as a process control and yield management provider for semiconductor manufacturing. Its revenue stems from wafer inspection, metrology, and defect analysis products that optimize integrated circuit production. In 2026, KLA focuses on expanding advanced process control solutions and enhancing inspection technologies across semiconductor and PCB markets.
Astera Labs, Inc. Common Stock: AI Connectivity Specialist
Astera Labs specializes in semiconductor-based connectivity solutions for cloud and AI infrastructure. It generates revenue by selling data, network, and memory connectivity products built on a software-defined architecture. The company’s 2026 strategy emphasizes scaling its Intelligent Connectivity Platform to drive performance in cloud and AI data centers.
Strategic Collision: Similarities & Divergences
KLA pursues a hardware-centric, integrated quality control approach, while Astera Labs champions a software-driven, scalable connectivity model. They converge in the semiconductor ecosystem but battle mainly in advanced infrastructure enabling next-gen chips and AI workloads. Their distinct investment profiles reflect KLA’s established market dominance versus Astera’s growth-stage innovation push.
Income Statement Comparison
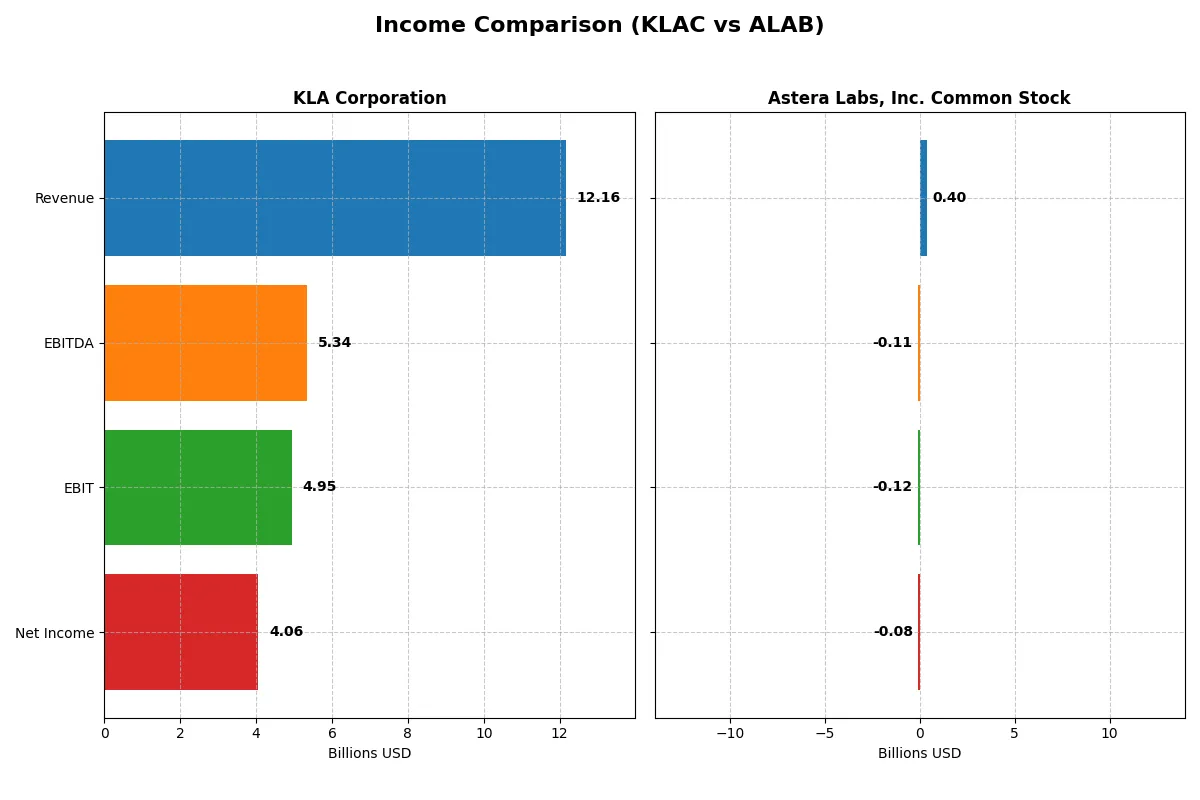
The following data dissects the core profitability and scalability of both corporate engines to reveal who dominates the bottom line:
| Metric | KLA Corporation (KLAC) | Astera Labs, Inc. (ALAB) |
|---|---|---|
| Revenue | 12.2B | 396M |
| Cost of Revenue | 4.58B | 94M |
| Operating Expenses | 2.33B | 419M |
| Gross Profit | 7.58B | 303M |
| EBITDA | 5.34B | -113M |
| EBIT | 4.95B | -116M |
| Interest Expense | 302M | 0 |
| Net Income | 4.06B | -83M |
| EPS | 30.53 | -0.64 |
| Fiscal Year | 2025 | 2024 |
Income Statement Analysis: The Bottom-Line Duel
This income statement comparison uncovers the true operational efficiency behind each company’s financial performance over recent years.
KLA Corporation Analysis
KLA consistently grows revenue, reaching $12.2B in 2025, with net income surging to $4.1B. Gross margins remain robust at 62%, while net margins above 33% reflect strong profitability. The latest year shows impressive momentum, with a 24% revenue increase and a 19% net margin expansion, signaling excellent cost management and scalable operations.
Astera Labs, Inc. Common Stock Analysis
Astera Labs exhibits rapid revenue growth, jumping 242% to $396M in 2024 from a smaller base. Despite a high gross margin of 76%, it posts a negative net margin of -21%, reflecting ongoing operating losses. The company struggles to translate top-line growth into profitability, with widening operating expenses outweighing gains, indicating early-stage investment phases.
Margin Mastery vs. Growth Gambit
KLA dominates with strong, consistent profitability and efficient capital allocation, delivering steady margin expansion alongside robust top-line growth. Astera Labs impresses with explosive revenue gains but remains unprofitable, burdened by high costs. For investors prioritizing proven earnings and margin resilience, KLA’s profile offers a more compelling, lower-risk opportunity.
Financial Ratios Comparison
These vital ratios act as a diagnostic tool to expose the underlying fiscal health, valuation premiums, and capital efficiency of the companies compared below:
| Ratios | KLA Corporation (KLAC) | Astera Labs, Inc. Common Stock (ALAB) |
|---|---|---|
| ROE | 86.6% | -8.6% |
| ROIC | 38.0% | -12.0% |
| P/E | 29.3 | -208.4 |
| P/B | 25.4 | 18.0 |
| Current Ratio | 2.62 | 11.7 |
| Quick Ratio | 1.83 | 11.2 |
| D/E | 1.30 | 0.0013 |
| Debt-to-Assets | 37.9% | 0.12% |
| Interest Coverage | 17.3 | 0 |
| Asset Turnover | 0.76 | 0.38 |
| Fixed Asset Turnover | 9.70 | 11.1 |
| Payout ratio | 22.3% | 0% |
| Dividend yield | 0.76% | 0% |
| Fiscal Year | 2025 | 2024 |
Efficiency & Valuation Duel: The Vital Signs
Financial ratios act as a company’s DNA, uncovering hidden risks and operational strengths that define its market standing.
KLA Corporation
KLA demonstrates exceptional profitability with an 86.6% ROE and a strong 33.4% net margin. The stock trades at a stretched P/E of 29.3 and a high P/B of 25.4, reflecting premium valuation. Shareholders receive a modest 0.76% dividend yield, while the firm invests heavily in R&D, supporting sustainable growth.
Astera Labs, Inc. Common Stock
Astera Labs reports negative profitability, with an ROE of -8.6% and a -21.1% net margin, signaling operational challenges. Its P/E is negative due to losses, but the P/B stands at 18.0, indicating a high valuation despite poor returns. The company pays no dividends, focusing on aggressive R&D spending to fuel future growth.
Premium Valuation vs. Operational Safety
KLA pairs strong profitability with a premium valuation, offering operational safety amid market cycles. Astera Labs shows high valuation without current profitability, raising risk. Investors seeking stable returns may prefer KLA’s profile; growth-oriented investors might tolerate Astera’s volatility.
Which one offers the Superior Shareholder Reward?
I observe that KLA Corporation (KLAC) delivers a balanced and sustainable shareholder reward through a 0.76% dividend yield and a moderate 22% payout ratio. KLAC also deploys significant capital in share buybacks, enhancing total return. Conversely, Astera Labs (ALAB) pays no dividends and lacks buyback activity, focusing on reinvestment amid negative margins. KLAC’s mature distribution model offers a clearer, more reliable total return profile in 2026. I conclude KLAC provides superior shareholder reward compared to ALAB’s growth-focused but unproven strategy.
Comparative Score Analysis: The Strategic Profile
The radar chart reveals the fundamental DNA and trade-offs of KLA Corporation and Astera Labs, Inc., highlighting their financial strengths and vulnerabilities:
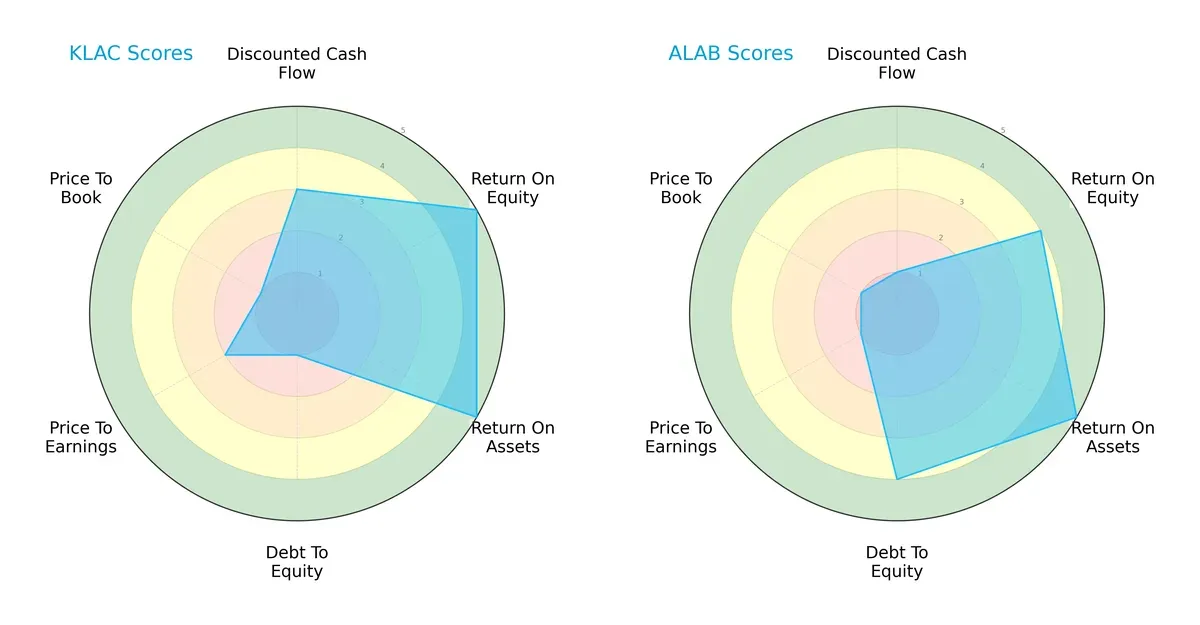
KLA demonstrates a strong operational efficiency with top-tier ROE and ROA scores (5 each), but its balance sheet is burdened by a very unfavorable debt-to-equity score (1). Astera Labs shows a more balanced financial risk profile with a favorable debt-to-equity score (4) but lags in discounted cash flow (1) and valuation metrics. KLA relies heavily on profitability, while Astera Labs offers stability with moderate profitability.
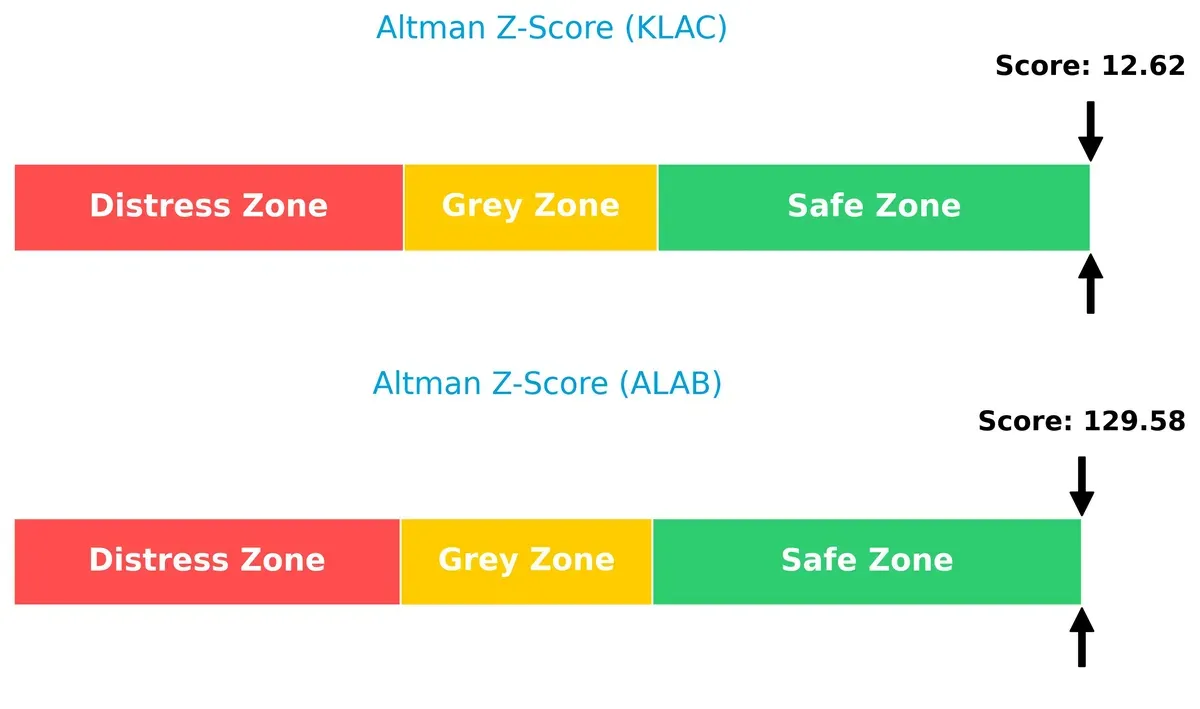
Bankruptcy Risk: Solvency Showdown
The Altman Z-Scores position both companies firmly in the safe zone, with Astera Labs (130) far outperforming KLA (13), indicating a significantly lower risk of bankruptcy in this cycle:
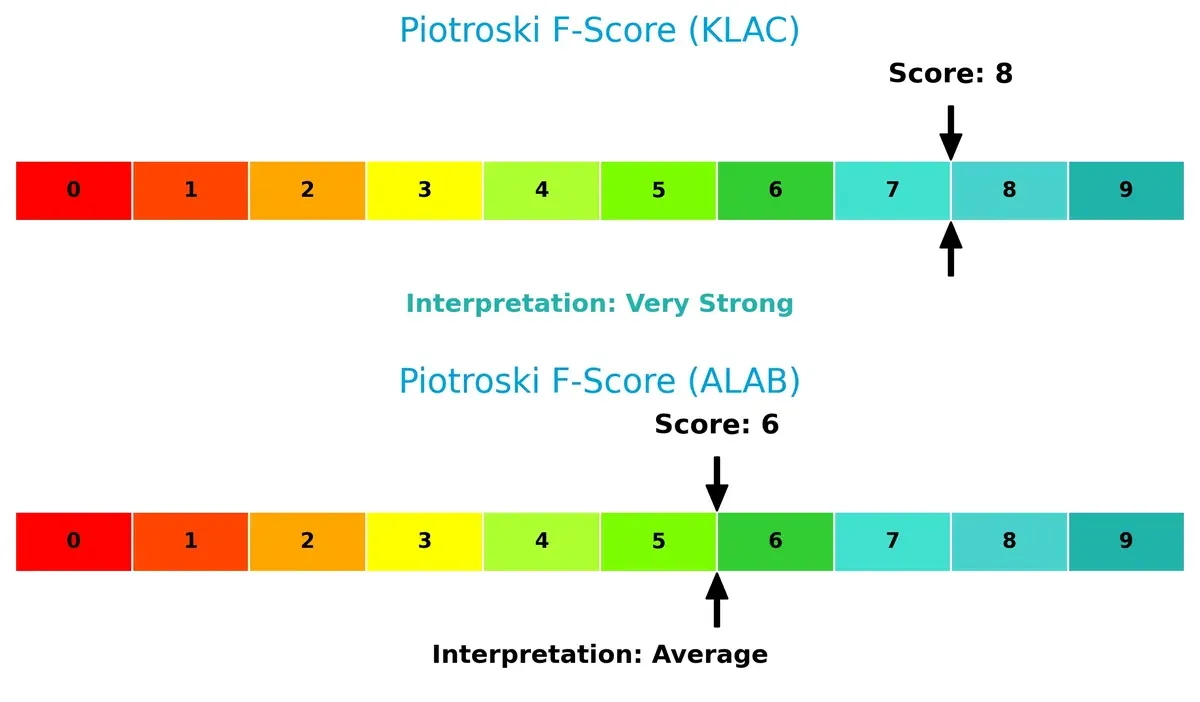
Financial Health: Quality of Operations
KLA’s Piotroski F-Score of 8 signals very strong financial health, outperforming Astera Labs’ average score of 6. This gap suggests KLA maintains superior internal financial controls and operational efficiency:
How are the two companies positioned?
This section dissects KLAC and ALAB’s operational DNA by comparing revenue distribution and internal dynamics. The goal is to confront their economic moats and reveal which model offers the most resilient competitive advantage in today’s semiconductor landscape.
Revenue Segmentation: The Strategic Mix
This visual comparison dissects how KLA Corporation and Astera Labs diversify their income streams and where their primary sector bets lie:
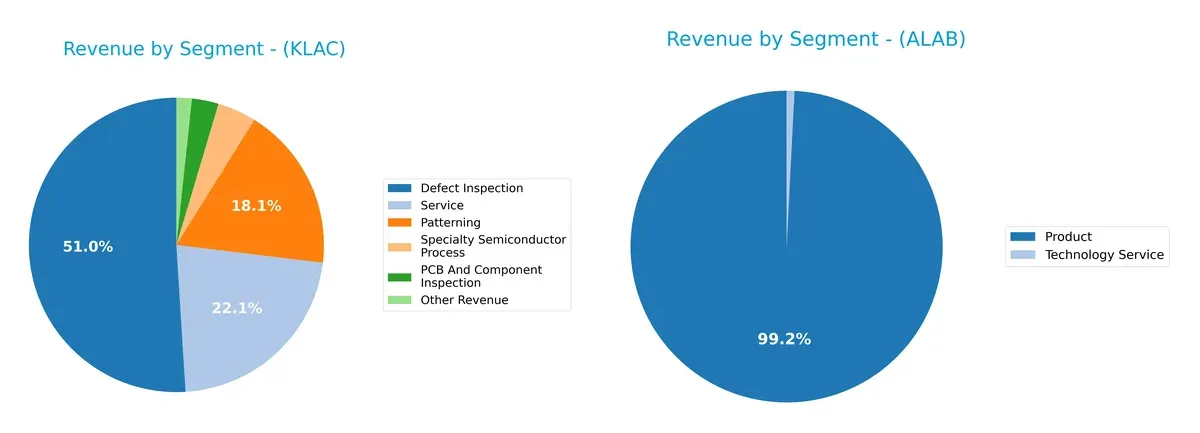
KLA Corporation anchors its revenue with $6.2B from Defect Inspection and $2.7B from Service, showcasing a broad, balanced portfolio. In contrast, Astera Labs relies heavily on a single Product segment at $393M, signaling high concentration risk. KLA’s diversification supports ecosystem lock-in and resilience. Astera’s focus could yield faster growth but exposes it to volatility if that segment faces headwinds.
Strengths and Weaknesses Comparison
This table compares the Strengths and Weaknesses of KLA Corporation and Astera Labs, Inc. Common Stock:
KLA Corporation Strengths
- Diverse revenue streams across inspection, patterning, service, and specialty semiconductor processes
- Strong profitability with 33.41% net margin and 86.56% ROE
- Favorable liquidity ratios (current 2.62, quick 1.83)
- Solid global presence with significant sales in China, Taiwan, North America, and Asia
Astera Labs Strengths
- Favorable capital structure with zero debt and low debt to assets (0.12%)
- Quick ratio strong at 11.21 indicating excellent short-term liquidity
- High fixed asset turnover (11.12) suggesting efficient asset use
- Concentrated product revenue stream focused on product and tech service
KLA Corporation Weaknesses
- Elevated valuation multiples (PE 29.34, PB 25.39) may pressure future stock performance
- Debt to equity ratio of 1.3 signals higher leverage risk
- WACC (10.42%) higher than desirable, raising capital costs
- Dividend yield low at 0.76%, limiting income appeal
Astera Labs Weaknesses
- Negative profitability metrics including -21.05% net margin and -8.65% ROE
- Unfavorable interest coverage at 0, risking solvency under stress
- Poor asset turnover of 0.38 reduces revenue generation efficiency
- Current ratio flagged as unfavorable at 11.71, possibly reflecting asset mismanagement
Overall, KLA exhibits robust profitability, diversified revenue, and a strong global footprint, though with elevated leverage and valuation concerns. Astera Labs shows liquidity strength and capital discipline but faces significant profitability and efficiency challenges. These factors distinctly shape each company’s strategic priorities in 2026.
The Moat Duel: Analyzing Competitive Defensibility
A structural moat is the only reliable shield protecting long-term profits from relentless competitive erosion in dynamic industries like semiconductors:
KLA Corporation: Precision Control with a Durable Economic Moat
KLA’s moat stems from intangible assets and specialized process control technology. Its 27.5% ROIC premium over WACC and 40% ROIC growth show efficient capital use and pricing power. Ongoing innovation in semiconductor inspection deepens its lead through 2026.
Astera Labs, Inc. Common Stock: Emerging Connectivity with Growth Potential
Astera Labs leverages a software-defined architecture as its moat, unlike KLA’s hardware dominance. Despite negative ROIC versus WACC, its rapid revenue growth signals nascent scale advantages. Profitability gains in 2026 could transform this into a stronger economic moat.
Market Control vs. Innovation Edge: The Semiconductor Moat Battle
KLA boasts a wider, deeper moat with sustained value creation and margin stability. Astera Labs shows promise but must convert growth into durable profitability to defend market share effectively. KLA remains the better-equipped incumbent to withstand competitive pressures.
Which stock offers better returns?
The past year shows strong bullish trends for both stocks, with KLA Corporation and Astera Labs accelerating price gains amid rising trading volumes and recent mixed buyer-seller dominance.
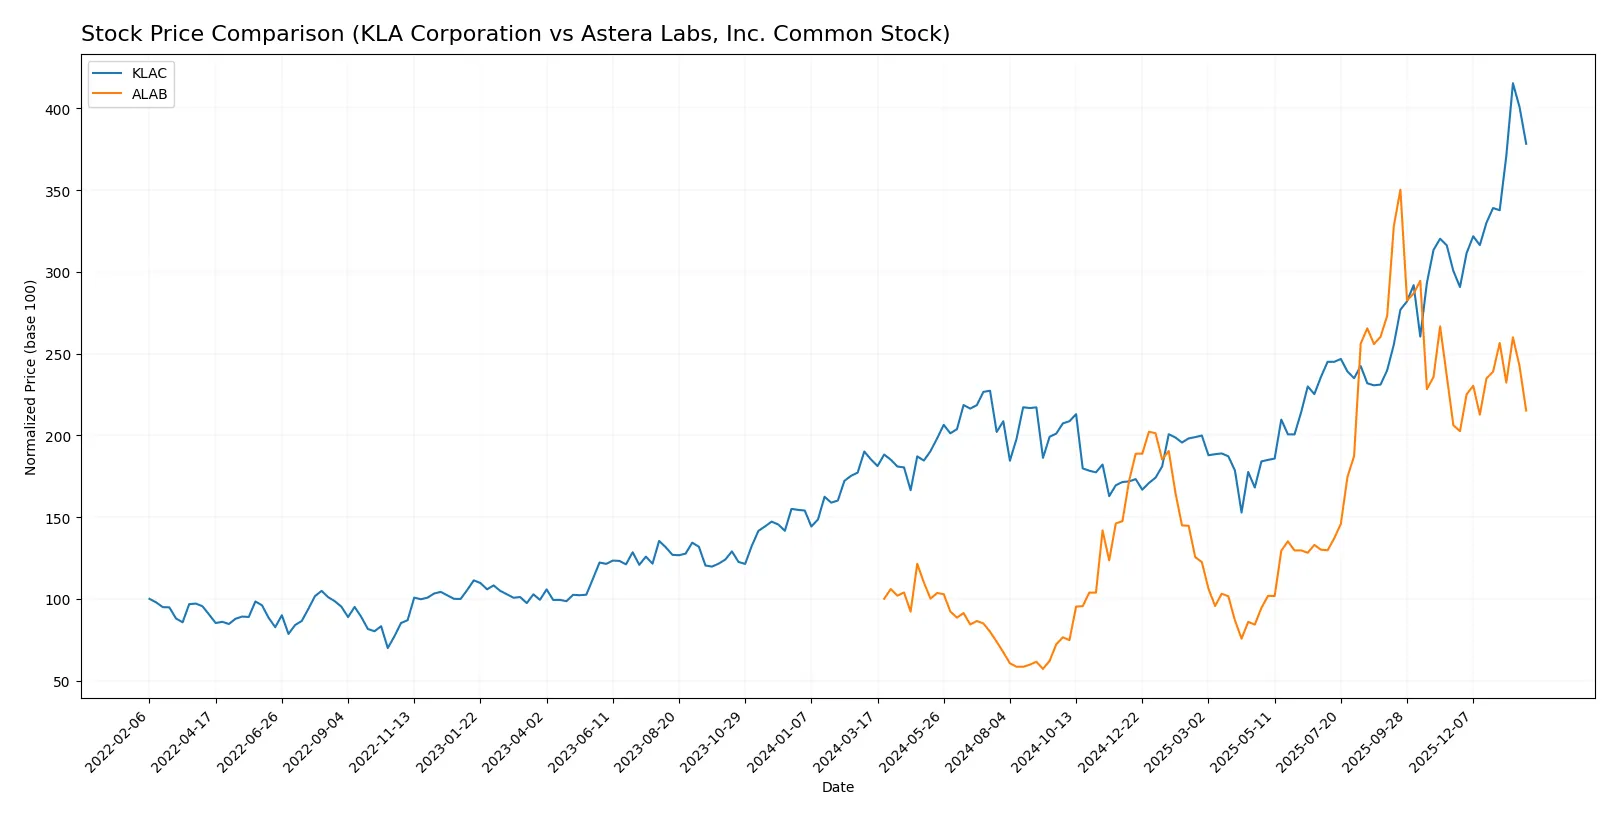
Trend Comparison
KLA Corporation’s stock rose 104.22% over the past year, marking a bullish trend with price acceleration. It reached a high of 1567.82 and a low of 576.53, reflecting significant volatility (std dev 213.25).
Astera Labs surged 115.17% in the same period, also bullish with acceleration. It exhibited lower volatility (std dev 50.39), with a high of 245.2 and a low of 40.0, indicating steadier upward momentum.
Astera Labs delivered the highest market performance, outperforming KLA Corporation by approximately 11%. Both stocks show bullish trends, but Astera Labs gained more consistently.
Target Prices
Analysts present a clear target price consensus for KLA Corporation and Astera Labs, Inc.
| Company | Target Low | Target High | Consensus |
|---|---|---|---|
| KLA Corporation | 1400 | 1900 | 1672.25 |
| Astera Labs, Inc. | 165 | 225 | 202.14 |
The consensus target for KLA is roughly 17% above its current price of 1427.94, signaling moderate upside. Astera Labs’ target price exceeds its current 150.62, implying strong growth expectations.

Don’t Let Luck Decide Your Entry Point
Optimize your entry points with our advanced ProRealTime indicators. You’ll get efficient buy signals with precise price targets for maximum performance. Start outperforming now!
How do institutions grade them?
KLA Corporation Grades
Here are the latest grades issued by reputable financial institutions for KLA Corporation:
| Grading Company | Action | New Grade | Date |
|---|---|---|---|
| RBC Capital | maintain | Sector Perform | 2026-01-30 |
| Needham | maintain | Buy | 2026-01-30 |
| Cantor Fitzgerald | maintain | Overweight | 2026-01-30 |
| Wells Fargo | maintain | Overweight | 2026-01-30 |
| Jefferies | maintain | Buy | 2026-01-30 |
| Barclays | maintain | Overweight | 2026-01-30 |
| Stifel | maintain | Buy | 2026-01-30 |
| Oppenheimer | maintain | Outperform | 2026-01-30 |
| Deutsche Bank | maintain | Hold | 2026-01-21 |
| UBS | maintain | Neutral | 2026-01-20 |
Astera Labs, Inc. Common Stock Grades
These are the most recent grades from verified sources for Astera Labs, Inc.:
| Grading Company | Action | New Grade | Date |
|---|---|---|---|
| Northland Capital Markets | maintain | Outperform | 2025-12-09 |
| Northland Capital Markets | upgrade | Outperform | 2025-11-17 |
| Needham | maintain | Buy | 2025-11-05 |
| JP Morgan | maintain | Overweight | 2025-11-05 |
| TD Cowen | maintain | Hold | 2025-11-05 |
| Morgan Stanley | maintain | Overweight | 2025-11-05 |
| Roth Capital | maintain | Buy | 2025-11-05 |
| Stifel | maintain | Buy | 2025-11-05 |
| Barclays | downgrade | Equal Weight | 2025-10-20 |
| Stifel | maintain | Buy | 2025-10-17 |
Which company has the best grades?
KLA Corporation holds a stronger consensus with multiple “Buy,” “Overweight,” and “Outperform” grades from top firms. Astera Labs shows a mix, including a recent downgrade to “Equal Weight” from Barclays. Investors might view KLA as more favorably rated, potentially reflecting greater confidence in its near-term prospects.
Risks specific to each company
The following categories identify the critical pressure points and systemic threats facing both firms in the 2026 market environment:
1. Market & Competition
KLA Corporation
- Established leader in semiconductor process control with a broad product portfolio and strong market share.
Astera Labs, Inc. Common Stock
- Emerging player focused on semiconductor connectivity for cloud and AI, facing intense competition and rapid technological shifts.
2. Capital Structure & Debt
KLA Corporation
- Moderate debt-to-equity ratio at 1.3 signals leveraged balance sheet; interest coverage strong at 16.37.
Astera Labs, Inc. Common Stock
- Virtually no debt, signaling low financial risk but zero interest coverage due to lack of earnings.
3. Stock Volatility
KLA Corporation
- Beta of 1.44 indicates above-market volatility; wide price range suggests sensitivity to semiconductor cycles.
Astera Labs, Inc. Common Stock
- Higher beta at 1.51 reflects elevated volatility typical for a smaller, growth-stage firm.
4. Regulatory & Legal
KLA Corporation
- Subject to global semiconductor export controls and IP regulations; established compliance frameworks.
Astera Labs, Inc. Common Stock
- Newer company with less regulatory history; potential exposure to evolving AI and cloud infrastructure regulations.
5. Supply Chain & Operations
KLA Corporation
- Operates complex, global supply chains; risks from component shortages and geopolitical disruptions persist.
Astera Labs, Inc. Common Stock
- Smaller scale operations with concentrated suppliers; supply chain less diversified, increasing operational risk.
6. ESG & Climate Transition
KLA Corporation
- Focus on sustainable manufacturing and energy efficiency; longer track record on ESG initiatives.
Astera Labs, Inc. Common Stock
- Limited public ESG disclosures; risk of lagging peers in climate transition efforts.
7. Geopolitical Exposure
KLA Corporation
- Significant international exposure, especially in Asia-Pacific; vulnerable to US-China tensions affecting semiconductor trade.
Astera Labs, Inc. Common Stock
- Also exposed to US-China dynamics but with smaller global footprint; less diversified geopolitical risk.
Which company shows a better risk-adjusted profile?
KLA Corporation’s most impactful risk is its leveraged capital structure despite strong profitability and coverage ratios. Astera Labs faces critical risks from negative profitability and operational scale limitations. I see KLA as having a better risk-adjusted profile, supported by its robust Altman Z-Score of 12.6 and a very strong Piotroski score of 8. Astera’s negative margins and high volatility heighten its risk, despite a clean balance sheet. The recent steep price correction in KLA (-15%) suggests market sensitivity but does not undermine its financial resilience.
Final Verdict: Which stock to choose?
KLA Corporation’s superpower lies in its durable competitive advantage, reflected in a very favorable moat with consistently growing ROIC well above its WACC. Its efficiency in converting invested capital into high returns makes it a powerful cash machine. The key point of vigilance is its elevated valuation multiples, which may pressure future gains. KLAC suits investors targeting aggressive growth with a tolerance for premium pricing.
Astera Labs offers a strategic moat grounded in rapid revenue expansion and a lean balance sheet with minimal debt, which enhances its safety profile relative to KLAC. However, it currently struggles to generate profits, reflecting a value-destroying phase despite improving profitability trends. ALAB fits portfolios seeking GARP (Growth at a Reasonable Price) opportunities, where growth potential compensates for early-stage challenges.
If you prioritize a proven value creator with stable and expanding returns, KLA Corporation outshines due to its strong economic moat and operational excellence. However, if you seek high-growth exposure with a longer runway and are comfortable with near-term profitability risks, Astera Labs offers superior growth dynamics but demands higher risk tolerance. Both present analytical scenarios suited to distinct investor profiles.
Disclaimer: Investment carries a risk of loss of initial capital. The past performance is not a reliable indicator of future results. Be sure to understand risks before making an investment decision.
Go Further
I encourage you to read the complete analyses of KLA Corporation and Astera Labs, Inc. Common Stock to enhance your investment decisions: