Home > Comparison > Technology > INTC vs ALAB
The strategic rivalry between Intel Corporation and Astera Labs defines the current trajectory of the semiconductor industry. Intel operates as a capital-intensive, diversified semiconductor giant with broad product lines. Astera Labs, in contrast, is a nimble innovator focused on high-performance connectivity solutions for cloud and AI infrastructure. This head-to-head pits scale and legacy strength against specialized growth potential. This analysis will identify which corporate path offers superior risk-adjusted returns for diversified investors.
Table of contents
Companies Overview
Intel Corporation and Astera Labs are pivotal players in the semiconductor industry with distinct market roles and growth trajectories.
Intel Corporation: Global Semiconductor Powerhouse
Intel dominates the semiconductor sector by designing and manufacturing a vast array of computer products, including CPUs, chipsets, and accelerators. Its core revenue stems from platform products and high-performance compute solutions targeting cloud, enterprise, and embedded markets. In 2026, Intel sharpens its focus on advanced AI integration and autonomous driving technologies, leveraging its broad product portfolio as a competitive advantage.
Astera Labs, Inc. Common Stock: Innovator in Connectivity Solutions
Astera Labs specializes in semiconductor-based connectivity solutions for cloud and AI infrastructure. Its Intelligent Connectivity Platform, built on a software-defined architecture, drives revenue by enabling scalable, high-performance data and network connectivity. Founded recently, Astera Labs concentrates on expanding its footprint in the growing AI infrastructure segment, emphasizing cutting-edge innovation in data center connectivity.
Strategic Collision: Similarities & Divergences
Intel and Astera Labs both operate in semiconductors but diverge sharply in scale and approach. Intel embraces a broad, vertically integrated ecosystem while Astera Labs pursues a niche, software-driven connectivity model. Their primary battleground lies in cloud and AI infrastructure, where Intel’s scale meets Astera’s agility. This contrast underlines distinct investment profiles: Intel as a mature industry giant, Astera as a high-growth innovator.
Income Statement Comparison
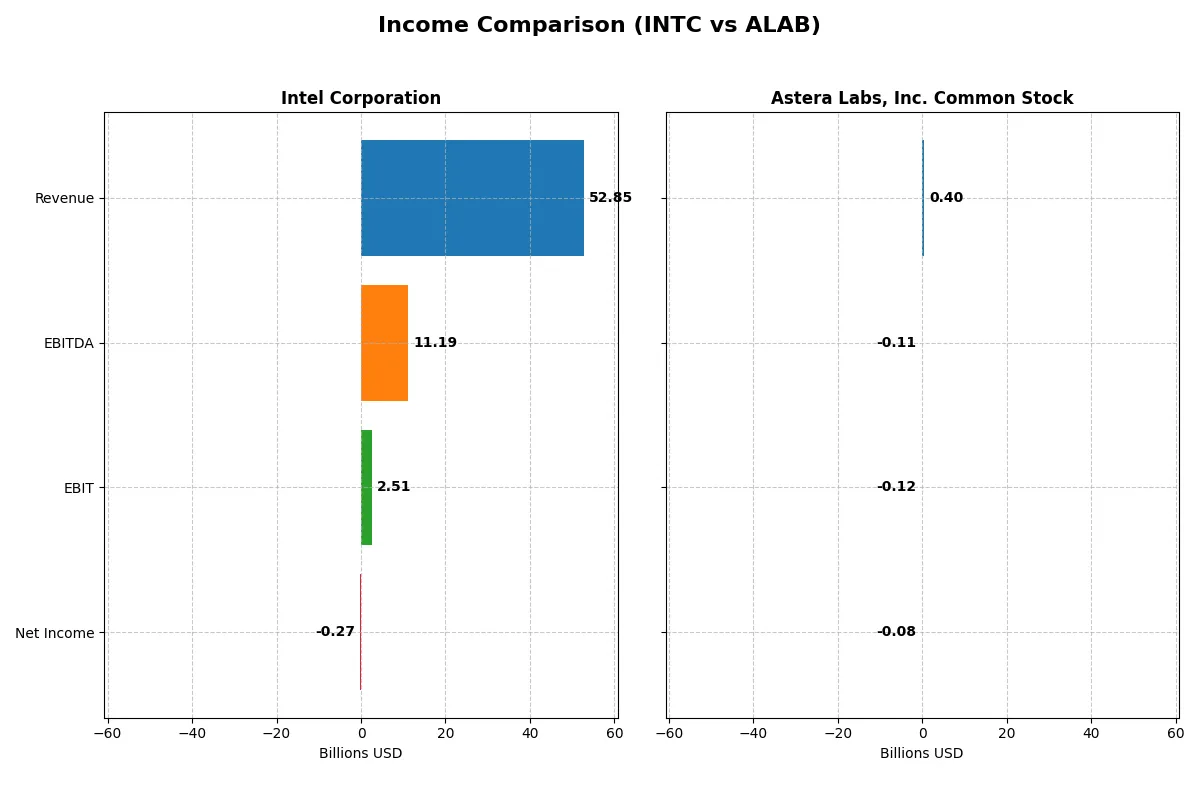
This data dissects the core profitability and scalability of both corporate engines to reveal who dominates the bottom line:
| Metric | Intel Corporation (INTC) | Astera Labs, Inc. Common Stock (ALAB) |
|---|---|---|
| Revenue | 52.9B | 396M |
| Cost of Revenue | 34.4B | 94M |
| Operating Expenses | 20.6B | 419M |
| Gross Profit | 18.5B | 303M |
| EBITDA | 11.2B | -113M |
| EBIT | 2.5B | -116M |
| Interest Expense | 953M | 0 |
| Net Income | -267M | -83M |
| EPS | -0.08 | -0.64 |
| Fiscal Year | 2025 | 2024 |
Income Statement Analysis: The Bottom-Line Duel
Comparing these income statements reveals each company’s operational efficiency and profitability momentum over recent years.
Intel Corporation Analysis
Intel’s revenue declined slightly by 0.5% to $52.9B in 2025, while net income turned negative at -$267M. Gross margin improved to a favorable 34.96%, but net margin slipped to -0.51%. Despite top-line pressure, Intel’s EBIT surged 125%, signaling operational recovery and margin stabilization.
Astera Labs, Inc. Common Stock Analysis
Astera Labs soared revenue by 242% to $396M in 2024, with gross margin an impressive 76.4%. However, net income deepened its loss to -$83M, reflecting heavy operating expenses. EBIT margin remained unfavorable at -29%, indicating ongoing challenges converting growth into profits.
Growth Surge vs. Profitability Recovery
Astera Labs leads in rapid revenue and gross profit expansion but struggles with profitability and cost control. Intel shows declining revenue but improves earnings quality and operating income. For investors, Intel’s margin recovery suggests greater fundamental stability over Astera’s high-growth yet loss-heavy profile.
Financial Ratios Comparison
These vital ratios act as a diagnostic tool to expose the underlying fiscal health, valuation premiums, and capital efficiency of the companies compared:
| Ratios | Intel Corporation (INTC) | Astera Labs, Inc. Common Stock (ALAB) |
|---|---|---|
| ROE | -0.23% | -8.65% |
| ROIC | -0.02% | -11.97% |
| P/E | -658.4 | -208.4 |
| P/B | 1.54 | 18.02 |
| Current Ratio | 2.02 | 11.71 |
| Quick Ratio | 1.65 | 11.21 |
| D/E (Debt-to-Equity) | 0.41 | 0.0013 |
| Debt-to-Assets | 22.0% | 0.12% |
| Interest Coverage | -2.23 | 0 |
| Asset Turnover | 0.25 | 0.38 |
| Fixed Asset Turnover | 0.50 | 11.12 |
| Payout ratio | 0 | 0 |
| Dividend yield | 0 | 0 |
| Fiscal Year | 2025 | 2024 |
Efficiency & Valuation Duel: The Vital Signs
Financial ratios act as a company’s DNA, exposing hidden risks and operational strengths critical for investors’ decision-making.
Intel Corporation
Intel shows weak profitability with a negative ROE of -0.23% and a net margin of -0.51%. Its valuation appears favorable with a negative P/E reflecting losses, while a P/B of 1.54 remains neutral. The company maintains a healthy current ratio of 2.02 and a low debt-to-equity of 0.41, but it pays no dividends, likely reinvesting heavily in R&D for growth.
Astera Labs, Inc. Common Stock
Astera Labs suffers from steep losses, with ROE at -8.65% and a net margin of -21.05%. Despite a favorable negative P/E, its P/B ratio is stretched at 18.02, signaling high market expectations. The current ratio is exceptionally high at 11.71 but flagged unfavorable due to liquidity imbalance. No dividends exist; the firm focuses on heavy R&D investment, evident from a high R&D-to-revenue ratio.
Premium Valuation vs. Operational Safety
Intel balances moderate valuation risk with better operational stability, while Astera Labs faces harsher losses and stretched valuation multiples. Intel’s profile suits investors prioritizing financial resilience; Astera appeals to those chasing aggressive growth despite elevated risk.
Which one offers the Superior Shareholder Reward?
I compare Intel Corporation (INTC) and Astera Labs, Inc. (ALAB) on dividends, buybacks, and sustainability for 2026. Intel yields 1.84% with no dividend payout in 2025, showing inconsistent dividend discipline and negative free cash flow (-$1B). Intel’s buyback activity is limited by cash constraints and negative net margins. Astera Labs pays no dividend but reinvests aggressively in R&D and growth, boasting free cash flow of $0.78 per share and robust cash ratios. ALAB’s negligible debt and high current ratio (11.7) support sustainable capital allocation. For total shareholder return, Intel’s yield is eroding, while ALAB’s growth-focused reinvestment and strong cash flow suggest a more sustainable value creation path. I find ALAB offers a superior shareholder reward profile in 2026.
Comparative Score Analysis: The Strategic Profile
The radar chart reveals the fundamental DNA and trade-offs of Intel Corporation and Astera Labs, Inc. Common Stock, highlighting their core financial strengths and weaknesses:
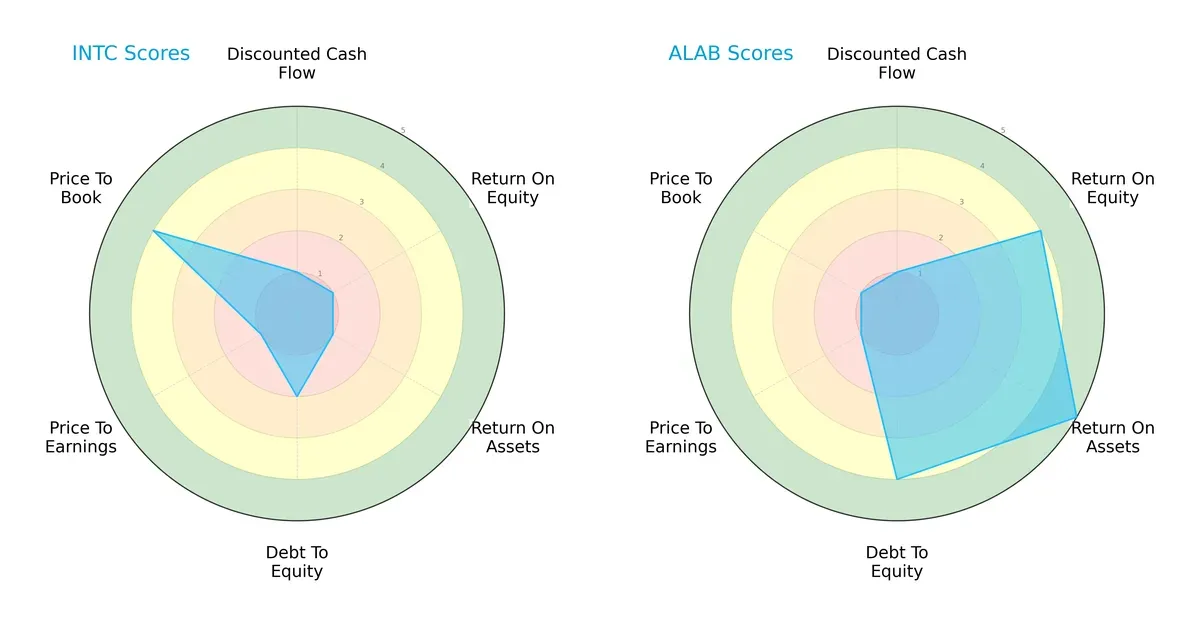
Intel shows a more favorable price-to-book score (4) but struggles with low returns on equity and assets (both 1), signaling operational inefficiencies. Astera Labs delivers superior returns (ROE 4, ROA 5) and a stronger debt-to-equity profile (4), but trades at less attractive valuation multiples (P/B 1). Astera Labs has a more balanced and growth-oriented profile, while Intel leans heavily on asset base valuation.
Bankruptcy Risk: Solvency Showdown
Astera Labs’ Altman Z-Score of 129.58 places it comfortably in the safe zone, while Intel’s 2.49 positions it in the grey zone, indicating moderate risk. This implies:
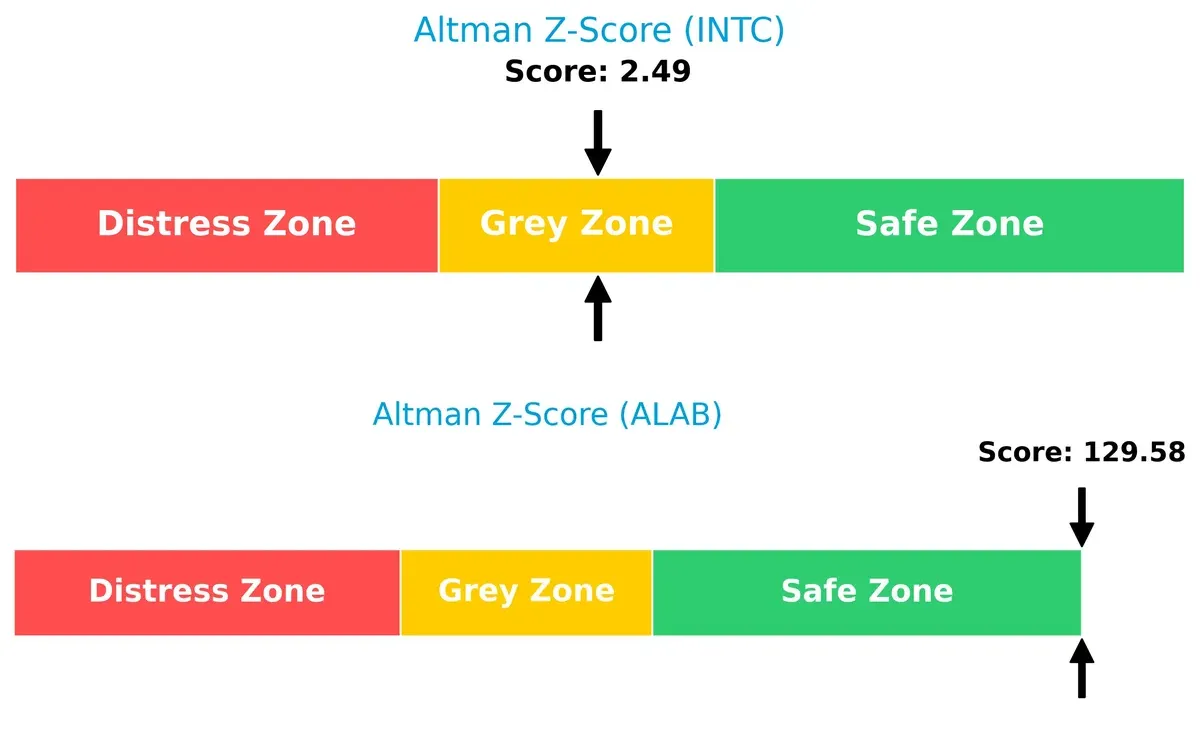
Astera Labs has a rock-solid financial foundation, reducing bankruptcy risk significantly. Intel’s score warns of potential solvency concerns if industry headwinds persist, urging caution for long-term investors.
Financial Health: Quality of Operations
Astera Labs scores a 6 on the Piotroski F-Score, outperforming Intel’s 4. This suggests:
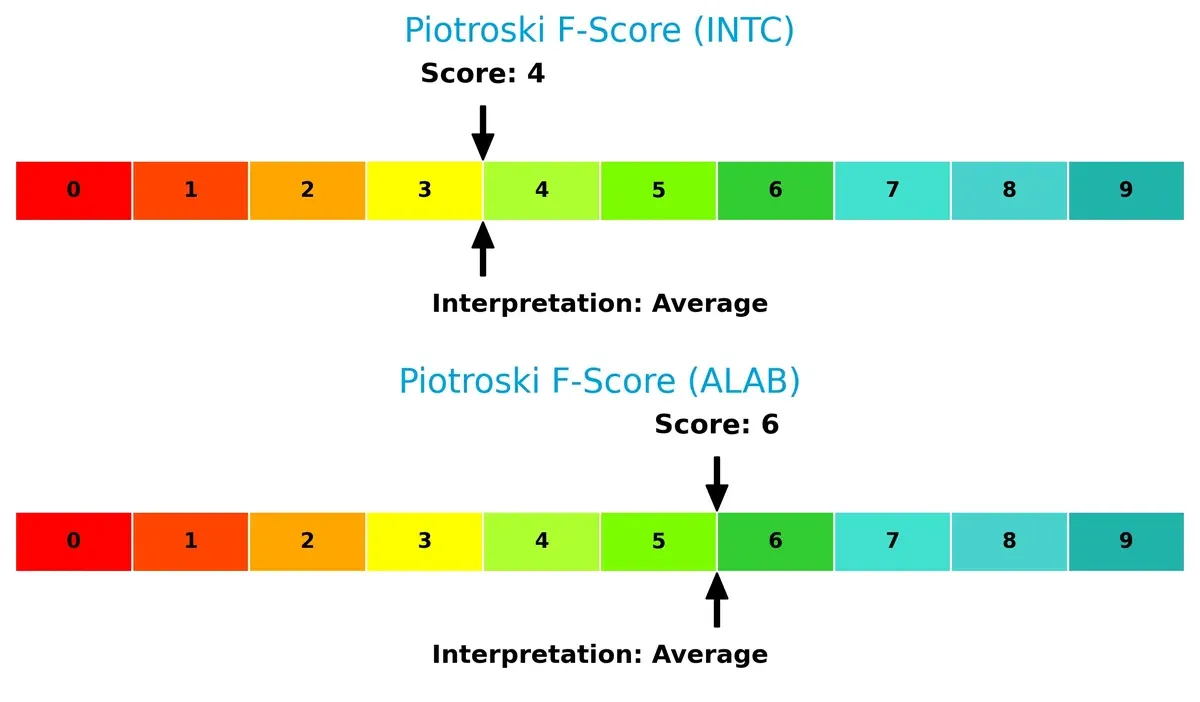
Astera Labs demonstrates stronger internal financial controls and operational quality. Intel’s lower score raises red flags on profitability and efficiency metrics, signaling room for improvement in financial health.
How are the two companies positioned?
This section dissects Intel’s and Astera Labs’ operational DNA by comparing their revenue distribution and internal strengths and weaknesses. The goal is to confront their economic moats to reveal which business model offers the most resilient, sustainable competitive advantage today.
Revenue Segmentation: The Strategic Mix
This visual comparison dissects how Intel Corporation and Astera Labs diversify their income streams and where their primary sector bets lie:
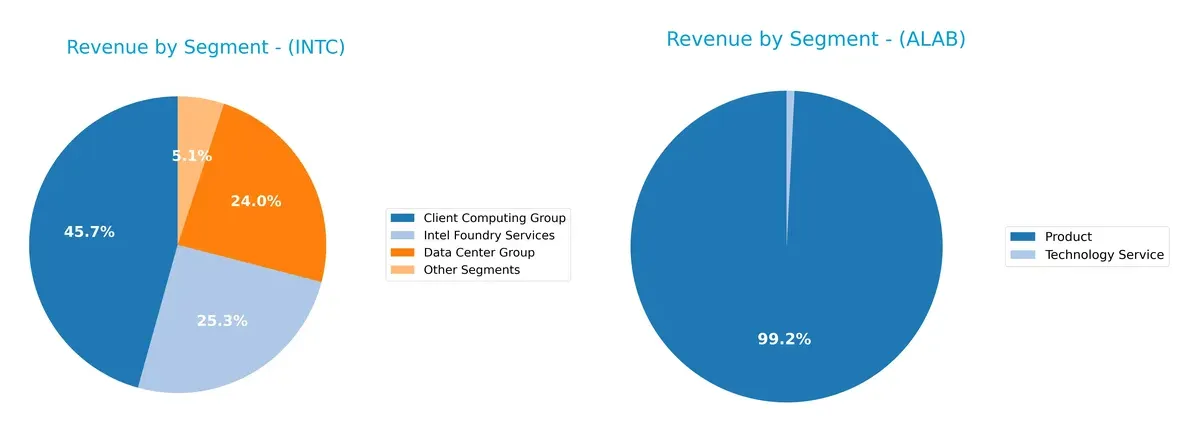
Intel’s revenue dwarfs Astera Labs, anchored by a broad mix: Client Computing Group leads with $32.2B, followed by Data Center Group at $16.9B and Foundry Services at $17.8B. Intel’s diverse portfolio reflects ecosystem lock-in and infrastructure dominance. Conversely, Astera Labs pivots almost entirely on a single Product segment of $393M, exposing it to concentration risk and limited revenue streams. This contrast highlights Intel’s strategic scale advantage.
Strengths and Weaknesses Comparison
This table compares the strengths and weaknesses of Intel Corporation and Astera Labs, Inc. Common Stock:
Intel Corporation Strengths
- Diversified revenue streams across multiple segments
- Strong global presence with significant sales in US, Asia, and Singapore
- Favorable leverage ratios and solid current and quick ratios
Astera Labs Strengths
- Favorable quick ratio and zero debt enhance liquidity
- Strong fixed asset turnover indicates efficient asset use
- Clear product focus supports targeted innovation
Intel Corporation Weaknesses
- Unfavorable profitability metrics: negative net margin, ROE, and ROIC
- Low asset turnover ratios indicate less efficient asset use
- No dividend yield may deter income investors
Astera Labs Weaknesses
- Unfavorable profitability and ROIC metrics reflect operational challenges
- High price-to-book ratio signals valuation concerns
- Very high current ratio may indicate inefficient working capital
Intel’s broad global footprint and diversified products provide resilience but are offset by profitability and efficiency issues. Astera Labs shows liquidity and asset efficiency strengths but faces significant profitability and valuation headwinds, implying strategic focus on operational improvement.
The Moat Duel: Analyzing Competitive Defensibility
A structural moat is the only reliable shield protecting long-term profits from relentless competitive erosion. Let’s dissect how two semiconductor players defend their turf:
Intel Corporation: Legacy Scale and Platform Moat
Intel’s competitive edge lies in its scale and integrated platform. This generates stable margins and broad customer relationships. However, its declining ROIC signals profit pressures. New AI and autonomous driving products could revitalize its moat in 2026.
Astera Labs, Inc.: Innovation-Driven Connectivity Moat
Astera Labs builds its moat on cutting-edge connectivity solutions for cloud and AI infrastructure, differentiating sharply from Intel’s scale. Its soaring revenue growth fuels expanding market presence, but sustained profitability remains a challenge. Future expansion hinges on commercializing AI-scale deployments.
Verdict: Scale Legacy vs. Innovation Agility
Intel’s wide, entrenched platform offers deeper moat breadth but suffers value erosion and margin pressure. Astera Labs shows a narrower yet evolving moat fueled by innovation and growth. Intel remains better positioned to defend market share today, but Astera’s improving profitability hints at a rising challenger.
Which stock offers better returns?
The past year shows distinct price movements: Intel Corporation’s stock gained steadily with accelerating momentum, while Astera Labs, Inc. soared with more volatility and rapid price appreciation.
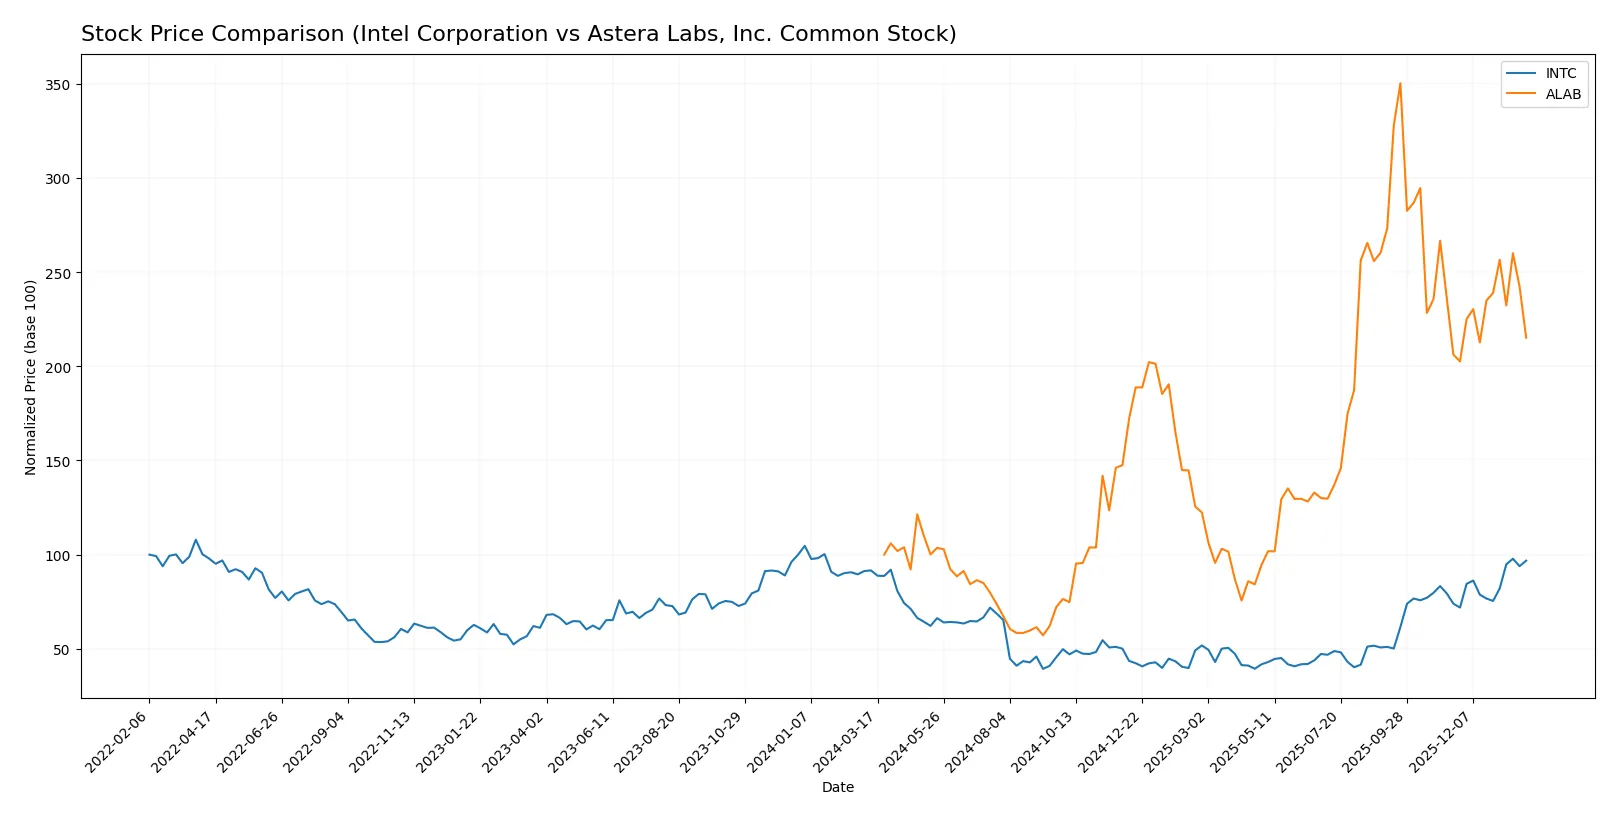
Trend Comparison
Intel Corporation’s stock rose 5.61% over 12 months, marking a bullish trend with accelerating gains and a price range between $18.89 and $46.96. Volatility measured by standard deviation stands at 8.11.
Astera Labs, Inc. surged 115.17% in the same period, showing a strong bullish trend and acceleration. Price fluctuated widely from $40.0 to $245.2, and volatility is high with a 50.39 standard deviation.
Astera Labs delivered the highest market performance with a 115.17% gain versus Intel’s 5.61%, despite greater volatility and recent seller dominance in volume.
Target Prices
Analysts present a wide but optimistic target consensus for Intel Corporation and Astera Labs, reflecting differing growth profiles.
| Company | Target Low | Target High | Consensus |
|---|---|---|---|
| Intel Corporation | 20 | 66 | 46.95 |
| Astera Labs, Inc. Common Stock | 165 | 225 | 202.14 |
Intel’s consensus target of $46.95 aligns closely with its current price of $46.47, indicating limited upside. Astera Labs shows a strong premium, with a consensus target about 34% above its $150.62 market price, signaling higher growth expectations.

Don’t Let Luck Decide Your Entry Point
Optimize your entry points with our advanced ProRealTime indicators. You’ll get efficient buy signals with precise price targets for maximum performance. Start outperforming now!
How do institutions grade them?
Intel Corporation Grades
This table summarizes recent institutional grades for Intel Corporation.
| Grading Company | Action | New Grade | Date |
|---|---|---|---|
| RBC Capital | maintain | Sector Perform | 2026-01-23 |
| Wedbush | maintain | Neutral | 2026-01-23 |
| Stifel | maintain | Hold | 2026-01-23 |
| UBS | maintain | Neutral | 2026-01-23 |
| Keybanc | maintain | Overweight | 2026-01-23 |
| Roth Capital | maintain | Neutral | 2026-01-23 |
| Needham | maintain | Hold | 2026-01-23 |
| Morgan Stanley | maintain | Equal Weight | 2026-01-23 |
| Benchmark | maintain | Buy | 2026-01-23 |
| Evercore ISI Group | maintain | In Line | 2026-01-23 |
Astera Labs, Inc. Common Stock Grades
This table summarizes recent institutional grades for Astera Labs, Inc. Common Stock.
| Grading Company | Action | New Grade | Date |
|---|---|---|---|
| Northland Capital Markets | maintain | Outperform | 2025-12-09 |
| Northland Capital Markets | upgrade | Outperform | 2025-11-17 |
| Needham | maintain | Buy | 2025-11-05 |
| JP Morgan | maintain | Overweight | 2025-11-05 |
| TD Cowen | maintain | Hold | 2025-11-05 |
| Morgan Stanley | maintain | Overweight | 2025-11-05 |
| Roth Capital | maintain | Buy | 2025-11-05 |
| Stifel | maintain | Buy | 2025-11-05 |
| Barclays | downgrade | Equal Weight | 2025-10-20 |
| Stifel | maintain | Buy | 2025-10-17 |
Which company has the best grades?
Astera Labs consistently earns Outperform and Buy ratings from multiple firms, indicating stronger institutional confidence. Intel’s grades cluster around Neutral and Hold, suggesting more cautious views. Investors may interpret this as higher growth expectations for Astera Labs versus more measured outlooks for Intel.
Risks specific to each company
The following categories identify critical pressure points and systemic threats facing both Intel Corporation and Astera Labs in the 2026 market environment:
1. Market & Competition
Intel Corporation
- Faces intense competition from established semiconductor giants, impacting margin recovery.
Astera Labs, Inc. Common Stock
- Operates in a niche connectivity segment but faces rapid innovation demands and emerging rivals.
2. Capital Structure & Debt
Intel Corporation
- Maintains moderate leverage with a debt-to-equity ratio of 0.41, balancing risk and capital needs.
Astera Labs, Inc. Common Stock
- Virtually no debt, implying low financial risk but possible constraints on growth capital.
3. Stock Volatility
Intel Corporation
- Exhibits beta of 1.35, indicating above-market volatility but relative stability for a large cap.
Astera Labs, Inc. Common Stock
- Higher beta at 1.51, reflecting greater price swings typical for a smaller, growth-stage firm.
4. Regulatory & Legal
Intel Corporation
- Subject to extensive global regulatory scrutiny due to size and international operations.
Astera Labs, Inc. Common Stock
- Faces regulatory risks typical for emerging tech companies but less exposure due to smaller scale.
5. Supply Chain & Operations
Intel Corporation
- Large, complex supply chain vulnerable to geopolitical tensions and chip shortages.
Astera Labs, Inc. Common Stock
- More agile operations but dependent on key suppliers for advanced connectivity components.
6. ESG & Climate Transition
Intel Corporation
- Pressured to meet aggressive ESG targets; large carbon footprint and resource use pose challenges.
Astera Labs, Inc. Common Stock
- ESG profile less established, with potential risks in environmental compliance as it scales.
7. Geopolitical Exposure
Intel Corporation
- Significant exposure to US-China tensions affecting manufacturing and sales.
Astera Labs, Inc. Common Stock
- Limited global footprint reduces geopolitical risk but constrains market access.
Which company shows a better risk-adjusted profile?
Intel’s key risk lies in its operational complexity and competitive pressures that weigh on profitability. Astera Labs’ main threat is its high stock volatility amid early-stage financial losses. Intel’s moderate leverage and established market position offer a more balanced risk profile. Astera’s lack of debt is a strength, but its unfavorable margins and valuation multiples raise caution. Recent financials reveal Intel’s slight operational distress with a grey-zone Altman Z-score, while Astera remains in the safe zone but with weaker profitability metrics. Overall, Intel shows a better risk-adjusted profile amid market turbulence.
Final Verdict: Which stock to choose?
Intel Corporation’s superpower lies in its resilient cash-generating capacity and solid balance sheet, which anchor its long-term industrial relevance. However, its declining return on invested capital signals a point of vigilance on value creation. Intel fits portfolios seeking steady income with cyclical exposure.
Astera Labs boasts a strategic moat through rapid revenue growth fueled by cutting-edge R&D investment and a lean debt profile. Its high current ratio ensures liquidity safety, making it relatively less risky than Intel despite early profitability challenges. Astera suits growth-oriented portfolios with higher risk tolerance.
If you prioritize capital preservation and consistent cash flow, Intel is the compelling choice due to its established market position and financial stability. However, if you seek aggressive growth underpinned by innovation and improving profitability, Astera offers superior upside potential despite its volatility and earnings uncertainty.
Disclaimer: Investment carries a risk of loss of initial capital. The past performance is not a reliable indicator of future results. Be sure to understand risks before making an investment decision.
Go Further
I encourage you to read the complete analyses of Intel Corporation and Astera Labs, Inc. Common Stock to enhance your investment decisions: