Astera Labs, Inc. (ALAB) and GLOBALFOUNDRIES Inc. (GFS) are two prominent players in the semiconductor industry, each driving innovation in cloud infrastructure and chip manufacturing. Astera Labs focuses on cutting-edge connectivity solutions for AI and cloud systems, while GLOBALFOUNDRIES excels in wafer fabrication and diverse semiconductor products. This article will explore their strengths and market positions to help you identify the most compelling investment opportunity.
Table of contents
Companies Overview
I will begin the comparison between Astera Labs and GLOBALFOUNDRIES by providing an overview of these two companies and their main differences.
Astera Labs Overview
Astera Labs, Inc. focuses on designing, manufacturing, and selling semiconductor-based connectivity solutions aimed at cloud and AI infrastructure. Its Intelligent Connectivity Platform offers a portfolio of data, network, and memory connectivity products built on a software-defined architecture. Founded in 2017 and based in Santa Clara, California, Astera Labs positions itself as a provider of scalable high-performance infrastructure solutions.
GLOBALFOUNDRIES Overview
GLOBALFOUNDRIES Inc. operates as a global semiconductor foundry, manufacturing integrated circuits that power a wide range of electronic devices. It produces microprocessors, network processors, and power management units, among other semiconductor devices, and offers wafer fabrication services. Established in 2009 and headquartered in Malta, New York, GLOBALFOUNDRIES serves as a key player in semiconductor manufacturing.
Key similarities and differences
Both companies operate in the semiconductor industry and are listed on NASDAQ, yet they differ significantly in scale and focus. Astera Labs specializes in connectivity solutions for cloud and AI infrastructure, emphasizing software-defined architectures with 440 employees. In contrast, GLOBALFOUNDRIES concentrates on semiconductor manufacturing and wafer fabrication with a workforce of 13,000, highlighting a broader product range in integrated circuits. Their market caps also reflect different scales, with Astera Labs at about 29.5B USD and GLOBALFOUNDRIES at roughly 23B USD.
Income Statement Comparison
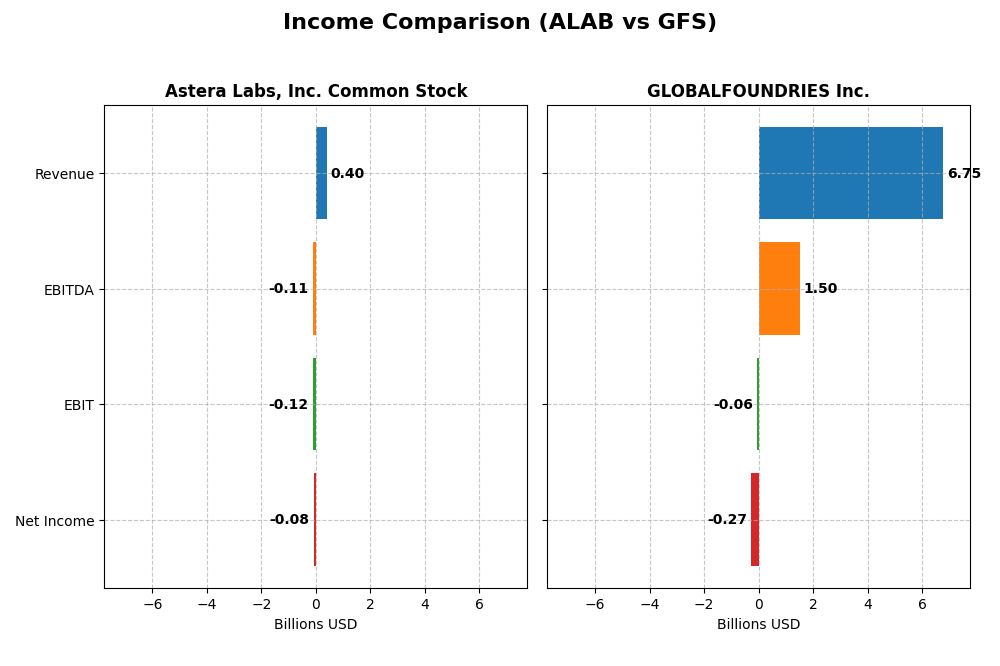
This table presents a side-by-side comparison of key income statement figures for Astera Labs, Inc. and GLOBALFOUNDRIES Inc. for the fiscal year 2024.
| Metric | Astera Labs, Inc. Common Stock (ALAB) | GLOBALFOUNDRIES Inc. (GFS) |
|---|---|---|
| Market Cap | 29.5B | 23.0B |
| Revenue | 396M | 6.75B |
| EBITDA | -113M | 1.50B |
| EBIT | -116M | -64M |
| Net Income | -83M | -265M |
| EPS | -0.64 | -0.48 |
| Fiscal Year | 2024 | 2024 |
Income Statement Interpretations
Astera Labs, Inc. Common Stock
Astera Labs experienced strong revenue growth from $79.9M in 2022 to $396.3M in 2024, a 396% increase over three years. Despite growing gross margins favorably to 76.4% in 2024, the company reported persistent net losses, with a net margin of -21.1%. The latest year saw revenue and gross profit surge, but operating expenses scaled similarly, deepening EBIT losses.
GLOBALFOUNDRIES Inc.
GLOBALFOUNDRIES showed a revenue decline from $8.11B in 2022 to $6.75B in 2024, reflecting an 8.7% drop in the last year. Gross margin decreased but remained positive at 24.5%. Net income turned negative in 2024 with a -3.9% net margin after prior profitability, signaling operational and market challenges. EBIT swung from positive to a slight loss, indicating margin pressure.
Which one has the stronger fundamentals?
Astera Labs demonstrates rapid top-line growth and high gross margins but continues to face significant net losses and negative EBIT margins, reflecting investment phase challenges. GLOBALFOUNDRIES, while generating larger revenues, suffered recent declines in revenue and profitability, with negative net and EBIT margins in 2024. Both show fundamental weaknesses, with Astera’s growth offset by losses and GLOBALFOUNDRIES facing margin contraction and shrinking sales.
Financial Ratios Comparison
The table below presents the most recent key financial ratios for Astera Labs, Inc. Common Stock (ALAB) and GLOBALFOUNDRIES Inc. (GFS) based on their 2024 fiscal year data.
| Ratios | Astera Labs, Inc. (ALAB) | GLOBALFOUNDRIES Inc. (GFS) |
|---|---|---|
| ROE | -8.65% | -2.46% |
| ROIC | -11.97% | -1.47% |
| P/E | -208.4 | -89.5 |
| P/B | 18.02 | 2.20 |
| Current Ratio | 11.71 | 2.11 |
| Quick Ratio | 11.21 | 1.57 |
| D/E (Debt-to-Equity) | 0.0013 | 0.215 |
| Debt-to-Assets | 0.12% | 13.81% |
| Interest Coverage | 0 | -1.48 |
| Asset Turnover | 0.38 | 0.40 |
| Fixed Asset Turnover | 11.12 | 0.82 |
| Payout ratio | 0 | 0 |
| Dividend yield | 0 | 0 |
Interpretation of the Ratios
Astera Labs, Inc. Common Stock
Astera Labs shows several unfavorable financial ratios in 2024, including a negative net margin of -21.05% and return on equity at -8.65%. Its high current ratio of 11.71 suggests strong liquidity but may indicate inefficient asset use. The company does not pay dividends, likely reflecting its reinvestment focus and growth phase with no distribution to shareholders.
GLOBALFOUNDRIES Inc.
GLOBALFOUNDRIES presents mixed ratios with a less negative net margin of -3.93% and a slightly negative ROE at -2.46% in 2024. It maintains a more balanced current ratio of 2.11, indicating reasonable liquidity. Like Astera Labs, it does not pay dividends, possibly prioritizing reinvestment and operational needs over shareholder returns at this stage.
Which one has the best ratios?
Both companies have unfavorable overall ratio assessments, with Astera Labs showing more severe profitability and efficiency weaknesses. GLOBALFOUNDRIES, while also negative in key returns, exhibits more moderate liquidity and leverage metrics. Neither company pays dividends, reflecting growth or reinvestment priorities rather than shareholder income distributions.
Strategic Positioning
This section compares the strategic positioning of Astera Labs (ALAB) and GLOBALFOUNDRIES (GFS), assessing their market position, key segments, and exposure to technological disruption:
Astera Labs, Inc. Common Stock (ALAB)
- Smaller market cap (~29.5B USD) with higher beta, facing competition in semiconductor connectivity solutions.
- Focuses on semiconductor-based connectivity for cloud and AI infrastructure, with products like Intelligent Connectivity Platform.
- Exposure to disruption through software-defined connectivity architecture targeting high-performance cloud and AI infrastructure.
GLOBALFOUNDRIES Inc. (GFS)
- Slightly smaller market cap (~23B USD) with broad semiconductor foundry market exposure and competitive pressures.
- Concentrates on manufacturing integrated circuits and wafer fabrication services for diverse semiconductor devices.
- Technological risks linked to wafer fabrication and integrated circuit manufacturing innovation and efficiency.
Astera Labs vs GLOBALFOUNDRIES Positioning
ALAB pursues a concentrated strategy in semiconductor connectivity with a focus on cloud and AI, while GFS adopts a more diversified approach across semiconductor manufacturing and wafer fabrication, offering breadth but facing broad industry pressures.
Which has the best competitive advantage?
Both companies exhibit slightly unfavorable moat evaluations, shedding value despite growing ROIC trends, indicating limited sustainable competitive advantage based on current capital efficiency data.
Stock Comparison
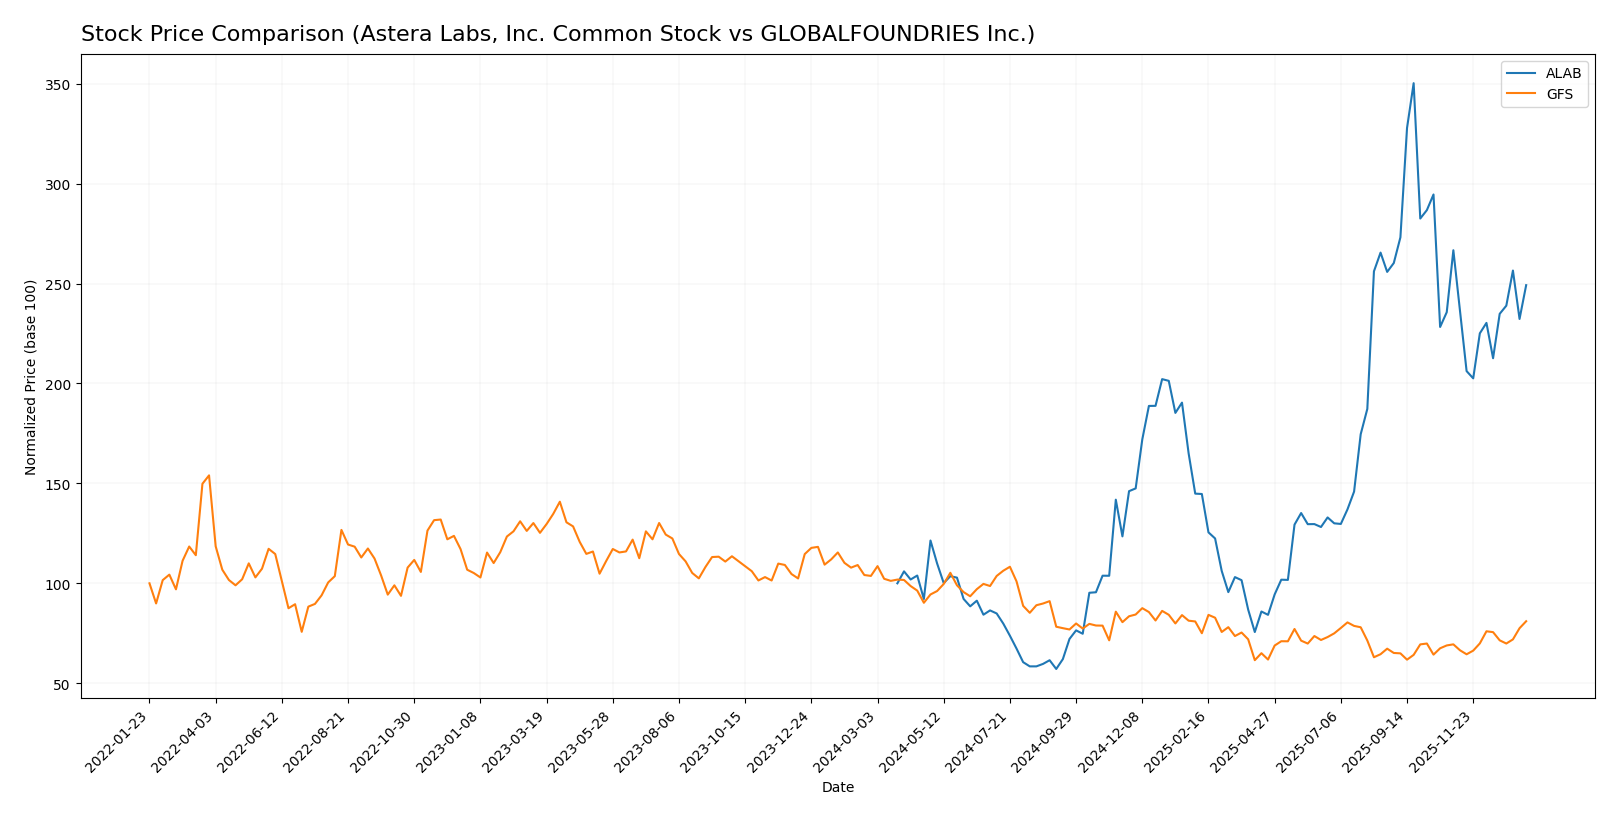
The past year reveals contrasting price dynamics between Astera Labs, Inc. Common Stock (ALAB) and GLOBALFOUNDRIES Inc. (GFS), with ALAB showing a strong bullish momentum despite recent deceleration, while GFS has experienced a bearish trend with signs of recent recovery.
Trend Analysis
Astera Labs, Inc. (ALAB) exhibited a bullish trend over the past 12 months with a 149.21% price increase, showing deceleration and high volatility, reaching a peak of 245.2 and a low of 40.0.
GLOBALFOUNDRIES Inc. (GFS) showed a bearish trend over the past year with a -21.86% price change, accelerating downward but with lower volatility, hitting a high of 55.66 and a low of 31.54.
Comparing the two, ALAB delivered the highest market performance over the past 12 months, significantly outperforming GFS in price appreciation despite recent short-term fluctuations.
Target Prices
The target price consensus from recognized analysts provides valuable insight into expected stock performance.
| Company | Target High | Target Low | Consensus |
|---|---|---|---|
| Astera Labs, Inc. Common Stock | 225 | 165 | 202.14 |
| GLOBALFOUNDRIES Inc. | 40 | 37 | 38.5 |
Analysts expect Astera Labs to trade significantly above its current price of 174.45, indicating strong growth potential. GLOBALFOUNDRIES’ consensus target is slightly below its current price of 41.53, suggesting a more cautious outlook.
Analyst Opinions Comparison
This section compares analysts’ ratings and grades for Astera Labs, Inc. Common Stock (ALAB) and GLOBALFOUNDRIES Inc. (GFS):
Rating Comparison
ALAB Rating
- Rating: B, considered Very Favorable by analysts.
- Discounted Cash Flow Score: 1, indicating a Very Unfavorable valuation outlook.
- ROE Score: 4, showing Favorable efficiency in generating profit from equity.
- ROA Score: 5, demonstrating Very Favorable asset utilization.
- Debt To Equity Score: 4, representing Favorable financial risk management.
- Overall Score: 3, classified as Moderate overall financial standing.
GFS Rating
- Rating: C+, also considered Very Favorable by analysts.
- Discounted Cash Flow Score: 3, reflecting a Moderate valuation outlook.
- ROE Score: 1, indicating Very Unfavorable profit generation from equity.
- ROA Score: 1, showing Very Unfavorable asset utilization.
- Debt To Equity Score: 3, indicating Moderate financial risk management.
- Overall Score: 2, also classified as Moderate overall financial standing.
Which one is the best rated?
Based strictly on provided data, ALAB is better rated overall with a higher rating (B vs. C+) and stronger scores in ROE, ROA, and debt management. GFS scores better on discounted cash flow but has weaker profitability and asset efficiency metrics.
Scores Comparison
The scores comparison between Astera Labs (ALAB) and GLOBALFOUNDRIES (GFS) is as follows:
ALAB Scores
- Altman Z-Score: 136.88, indicating a safe zone.
- Piotroski Score: 6, categorized as average.
GFS Scores
- Altman Z-Score: 2.61, indicating a grey zone.
- Piotroski Score: 6, categorized as average.
Which company has the best scores?
Astera Labs shows a significantly higher Altman Z-Score in the safe zone, compared to GLOBALFOUNDRIES’ grey zone score. Both companies have an identical Piotroski Score of 6, reflecting average financial strength.
Grades Comparison
The following presents the recent grades for Astera Labs, Inc. Common Stock and GLOBALFOUNDRIES Inc.:
Astera Labs, Inc. Common Stock Grades
Below is a summary table of recent analyst grades for Astera Labs, Inc. Common Stock.
| Grading Company | Action | New Grade | Date |
|---|---|---|---|
| Northland Capital Markets | Maintain | Outperform | 2025-12-09 |
| Northland Capital Markets | Upgrade | Outperform | 2025-11-17 |
| Stifel | Maintain | Buy | 2025-11-05 |
| Morgan Stanley | Maintain | Overweight | 2025-11-05 |
| Roth Capital | Maintain | Buy | 2025-11-05 |
| Needham | Maintain | Buy | 2025-11-05 |
| JP Morgan | Maintain | Overweight | 2025-11-05 |
| TD Cowen | Maintain | Hold | 2025-11-05 |
| Barclays | Downgrade | Equal Weight | 2025-10-20 |
| Stifel | Maintain | Buy | 2025-10-17 |
Astera Labs has predominantly received Buy and Outperform ratings with a few Hold and Equal Weight grades, indicating a generally positive analyst sentiment.
GLOBALFOUNDRIES Inc. Grades
Below is a summary table of recent analyst grades for GLOBALFOUNDRIES Inc.
| Grading Company | Action | New Grade | Date |
|---|---|---|---|
| Wedbush | Downgrade | Neutral | 2025-12-31 |
| B of A Securities | Maintain | Underperform | 2025-12-04 |
| Evercore ISI Group | Maintain | Outperform | 2025-11-13 |
| JP Morgan | Maintain | Neutral | 2025-11-13 |
| Citigroup | Maintain | Neutral | 2025-11-13 |
| Wedbush | Maintain | Outperform | 2025-11-13 |
| B of A Securities | Downgrade | Underperform | 2025-10-13 |
| Deutsche Bank | Maintain | Buy | 2025-08-06 |
| Morgan Stanley | Maintain | Equal Weight | 2025-08-06 |
| Wedbush | Maintain | Outperform | 2025-08-06 |
GLOBALFOUNDRIES shows mixed analyst ratings with a combination of Outperform, Neutral, Underperform, and Buy grades, suggesting more varied views among analysts.
Which company has the best grades?
Astera Labs has received consistently stronger grades, mostly Buy and Outperform, compared to GLOBALFOUNDRIES, which has a more mixed rating profile including Neutral and Underperform grades. For investors, this may indicate a clearer positive analyst consensus around Astera Labs relative to GLOBALFOUNDRIES.
Strengths and Weaknesses
The table below summarizes key strengths and weaknesses of Astera Labs, Inc. (ALAB) and GLOBALFOUNDRIES Inc. (GFS) based on recent financial and operational data.
| Criterion | Astera Labs, Inc. (ALAB) | GLOBALFOUNDRIES Inc. (GFS) |
|---|---|---|
| Diversification | Limited product range: mainly Product (393M) and small Technology Service segment (3.2M) | More diversified with Engineering Services (652M) and Water Fabrication (6.1B) |
| Profitability | Negative profitability: net margin -21.05%, ROIC -11.97%, ROE -8.65% | Negative profitability but improving: net margin -3.93%, ROIC -1.47%, ROE -2.46% |
| Innovation | High fixed asset turnover (11.12) suggests efficient use of assets, but overall profitability weak | Lower fixed asset turnover (0.82) indicates less asset efficiency; innovation impact uncertain |
| Global presence | Smaller scale, less global diversification evident | Large-scale operations and global footprint in semiconductor fabrication |
| Market Share | Smaller market presence and value destruction | Larger revenue base (~6.7B) but still shedding value, improving ROIC |
In summary, both companies currently face profitability challenges, though GLOBALFOUNDRIES shows stronger diversification and scale with improving returns. Astera Labs is more focused but struggles with value creation despite improving ROIC trends. Investors should watch for sustained profitability improvements before committing.
Risk Analysis
Below is a comparative table summarizing key risks for Astera Labs, Inc. (ALAB) and GLOBALFOUNDRIES Inc. (GFS) based on the latest 2024 data:
| Metric | Astera Labs, Inc. (ALAB) | GLOBALFOUNDRIES Inc. (GFS) |
|---|---|---|
| Market Risk | High beta 1.51, volatile range (47.1-262.9) | High beta 1.48, moderate range (29.8-47.7) |
| Debt level | Very low debt (D/E = 0.0), very favorable | Moderate debt (D/E = 0.22), favorable |
| Regulatory Risk | Moderate; semiconductor industry subject to export controls and IP regulations | Moderate; foundry operations face environmental and trade regulations |
| Operational Risk | Small size (440 employees), risk in scaling production and innovation | Large scale (13K employees), complexity in global operations |
| Environmental Risk | Low debt but no dividend, possibly reinvesting in green tech | Higher resource use; environmental compliance pressures |
| Geopolitical Risk | US-based tech firm, exposed to US-China tech tensions | US-based with global footprint, sensitive to trade disputes |
The most likely and impactful risks stem from market volatility and operational challenges. Astera Labs shows strong leverage control but faces high price swings and scaling risks as a younger firm. GLOBALFOUNDRIES has moderate debt and geopolitical exposure due to its global operations. Both companies have unfavorable profitability metrics, which heightens caution for investors.
Which Stock to Choose?
Astera Labs, Inc. (ALAB) shows strong revenue growth of 242% in 2024 but suffers from negative profitability with a net margin of -21.05% and returns on equity and invested capital both unfavorable. Its debt levels are low, and the rating is very favorable (B), though its overall financial ratios evaluation is unfavorable.
GLOBALFOUNDRIES Inc. (GFS) experienced a revenue decline of -8.7% in 2024 and maintains a smaller net margin loss of -3.93%. Despite negative returns on equity and assets, it has moderate debt and a very favorable rating (C+). The financial ratios evaluation is also unfavorable but with slightly better liquidity metrics than ALAB.
For investors prioritizing growth, ALAB’s rapid revenue expansion and improving profitability might appear attractive despite its financial challenges. Conversely, GFS may appear more suitable for those seeking a company with steadier financial ratios and moderate debt levels amid declining revenues. Both companies show value destruction per ROIC vs. WACC, but with improving profitability trends.
Disclaimer: Investment carries a risk of loss of initial capital. The past performance is not a reliable indicator of future results. Be sure to understand risks before making an investment decision.
Go Further
I encourage you to read the complete analyses of Astera Labs, Inc. Common Stock and GLOBALFOUNDRIES Inc. to enhance your investment decisions: