Astera Labs, Inc. (ALAB) and CEVA, Inc. (CEVA) are two prominent players in the semiconductor industry, each shaping the future of connectivity and AI infrastructure. While Astera Labs focuses on high-performance cloud and AI data connectivity, CEVA leads in wireless connectivity and smart sensing technologies. This comparison highlights their market positions and innovation strategies to help you decide which company holds the most promise for your investment portfolio.

Table of contents
Companies Overview
I will begin the comparison between Astera Labs and CEVA by providing an overview of these two companies and their main differences.
Astera Labs Overview
Astera Labs, Inc. designs, manufactures, and sells semiconductor-based connectivity solutions targeting cloud and AI infrastructure. Its Intelligent Connectivity Platform includes data, network, and memory connectivity products built on a software-defined architecture. Founded in 2017 and headquartered in Santa Clara, California, Astera Labs focuses on enabling high-performance cloud and AI infrastructure deployment at scale.
CEVA Overview
CEVA, Inc. operates as a licensor of wireless connectivity and smart sensing technologies to semiconductor and OEM companies globally. It designs and licenses digital signal processors, AI processors, wireless platforms, and software for applications including 5G, IoT, imaging, and AI. Founded in 1999 and based in Rockville, Maryland, CEVA serves diverse markets such as mobile, automotive, robotics, and aerospace through licensing its integrated IP solutions.
Key similarities and differences
Both companies operate in the semiconductor industry and focus on enabling advanced technologies such as AI and wireless connectivity. Astera Labs develops and sells its own semiconductor connectivity products primarily for cloud infrastructure, while CEVA licenses its technology platforms and IP cores to other semiconductor and OEM companies across multiple markets. Astera Labs is newer with a larger market cap (~29.5B vs. 535M), whereas CEVA has a longer history and a broader licensing business model.
Income Statement Comparison
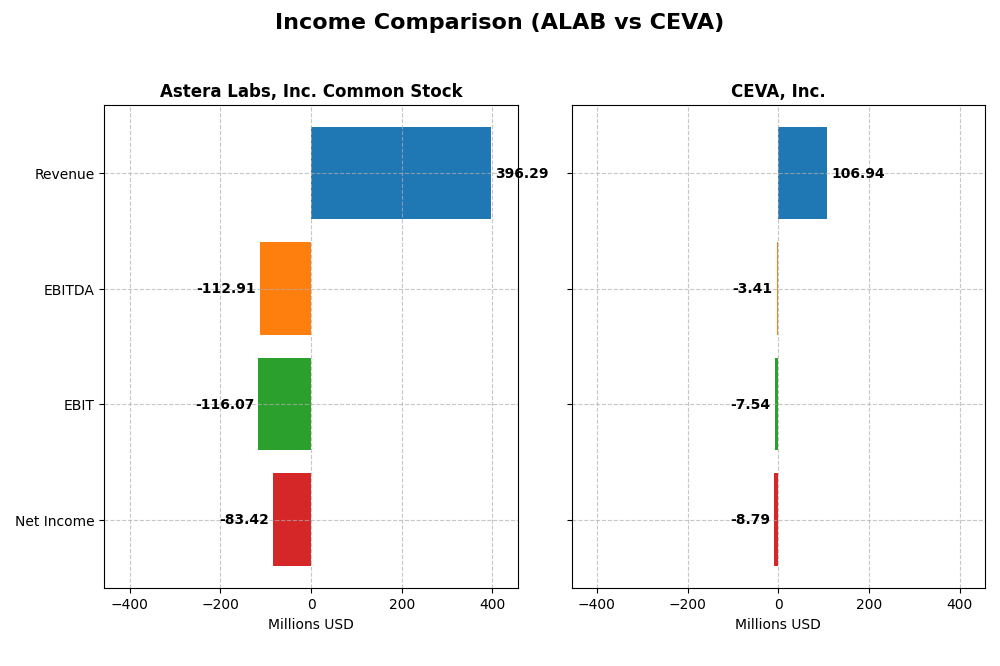
The table below compares key income statement metrics for Astera Labs, Inc. Common Stock and CEVA, Inc. for the fiscal year 2024, providing a snapshot of their financial performance.
| Metric | Astera Labs, Inc. Common Stock (ALAB) | CEVA, Inc. (CEVA) |
|---|---|---|
| Market Cap | 29.5B | 536M |
| Revenue | 396.3M | 106.9M |
| EBITDA | -113M | -3.4M |
| EBIT | -116.1M | -7.5M |
| Net Income | -83.4M | -8.8M |
| EPS | -0.64 | -0.37 |
| Fiscal Year | 2024 | 2024 |
Income Statement Interpretations
Astera Labs, Inc. Common Stock
Astera Labs showed a strong revenue increase from $79.9M in 2022 to $396.3M in 2024, a 396% growth over three years. Despite improving gross margins to 76.38%, net income remained negative, with a slight margin improvement to -21.05% in 2024. The latest year saw slower EBIT growth and continuing losses, reflecting high operating expenses.
CEVA, Inc.
CEVA’s revenue grew moderately from $100.3M in 2020 to $106.9M in 2024, with a 9.77% increase in the last year. Gross margin remained strong at 88.06%, but net margin stayed negative at -8.22%. The company improved EBIT and net margin in 2024, showing better profitability dynamics despite an overall decline in net income over five years.
Which one has the stronger fundamentals?
CEVA exhibits a more favorable income statement profile with higher gross margins, improving EBIT, and net margin growth in 2024, alongside consistent revenue growth. Astera Labs, while showing rapid revenue expansion and improving gross margin, suffers from deeper net losses and negative EBIT margins. CEVA’s margin stability and earnings improvement weigh in its favor compared to Astera Labs’ high expenses and ongoing losses.
Financial Ratios Comparison
The table below presents key financial ratios for Astera Labs, Inc. (ALAB) and CEVA, Inc. for the fiscal year 2024, offering a snapshot of their recent operational and financial performance.
| Ratios | Astera Labs, Inc. (ALAB) | CEVA, Inc. |
|---|---|---|
| ROE | -8.6% | -3.3% |
| ROIC | -12.0% | -2.7% |
| P/E | -208.4 | -84.8 |
| P/B | 18.0 | 2.8 |
| Current Ratio | 11.7 | 7.1 |
| Quick Ratio | 11.2 | 7.1 |
| D/E (Debt-to-Equity) | 0.0013 | 0.021 |
| Debt-to-Assets | 0.12% | 1.8% |
| Interest Coverage | 0 | 0 |
| Asset Turnover | 0.38 | 0.35 |
| Fixed Asset Turnover | 11.1 | 8.4 |
| Payout Ratio | 0 | 0 |
| Dividend Yield | 0 | 0 |
Interpretation of the Ratios
Astera Labs, Inc. Common Stock
Astera Labs shows a mixed ratio profile with significant weaknesses: negative net margin (-21.05%), negative returns on equity (-8.65%) and invested capital (-11.97%), and an unfavorable weighted average cost of capital (10.91%). While the quick ratio (11.21) and debt metrics are favorable, the current ratio is unusually high (11.71), which may indicate inefficient asset use. The company does not pay dividends, reflecting either reinvestment priorities or early-stage growth.
CEVA, Inc.
CEVA also reports unfavorable profitability ratios, including negative net margin (-8.22%), negative ROE (-3.3%), and negative ROIC (-2.68%), alongside a high WACC (10.45%). Positives include a reasonable price-to-book ratio (2.79, neutral) and good quick ratio (7.09), supported by low debt levels. No dividends are paid, likely due to ongoing reinvestment or growth strategies, with no indication of share buybacks.
Which one has the best ratios?
Both companies exhibit unfavorable profitability and coverage ratios, reflecting challenges in generating returns and managing costs. Astera Labs shows more extreme valuation multiples and liquidity imbalances, while CEVA maintains slightly better leverage and asset turnover metrics. Overall, neither company demonstrates a clearly superior ratio profile based on the current data.
Strategic Positioning
This section compares the strategic positioning of Astera Labs and CEVA, including market position, key segments, and exposure to technological disruption:
Astera Labs
- Large market cap of 29.5B, operating in a competitive semiconductor connectivity market.
- Focus on semiconductor-based connectivity solutions for cloud and AI infrastructure.
- Positioned in cloud and AI connectivity, potential sensitivity to rapid tech changes.
CEVA
- Smaller market cap of 536M, faces competitive pressure in wireless connectivity and IP licensing.
- Licenses wireless connectivity, DSP cores, AI processors, and sensing technologies globally.
- Exposure to wireless and smart sensing tech, requiring ongoing innovation in DSP and AI areas.
Astera Labs vs CEVA Positioning
Astera Labs has a concentrated focus on cloud and AI infrastructure connectivity, driving product sales, while CEVA relies on licensing diverse wireless and sensing IP technologies. Astera Labs’ scale contrasts with CEVA’s specialized licensing business model.
Which has the best competitive advantage?
Both companies are shedding value relative to their cost of capital, but Astera Labs shows improving profitability, unlike CEVA’s declining returns, suggesting a slightly stronger competitive moat for Astera Labs despite current value destruction.
Stock Comparison
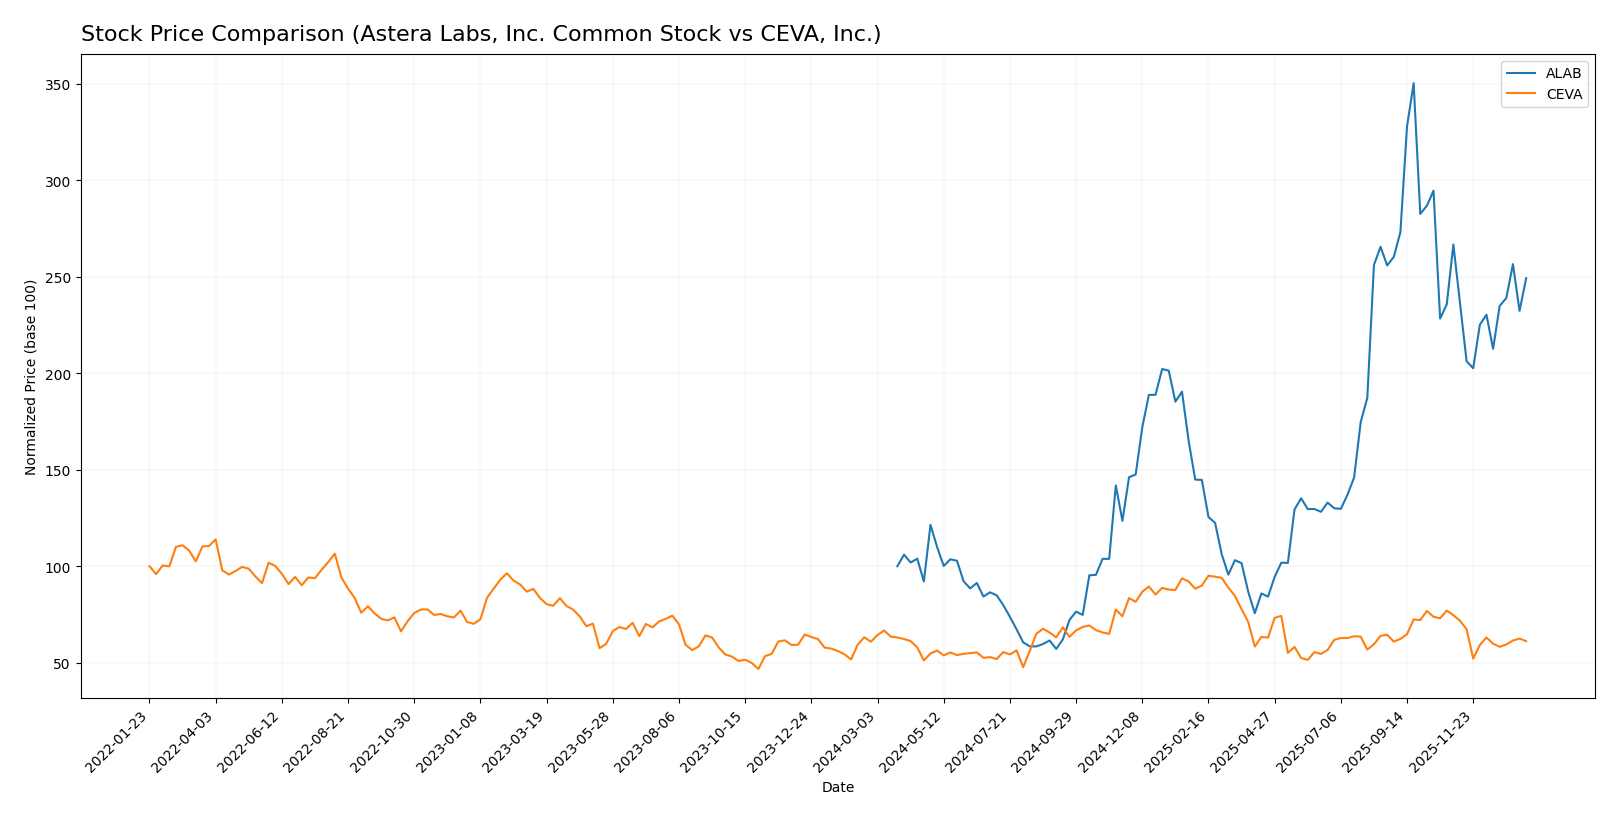
The past year saw Astera Labs, Inc. Common Stock (ALAB) exhibit a strong bullish trend with significant price gains and high volatility, while CEVA, Inc. remained mostly flat, reflecting subdued trading dynamics and modest price fluctuations.
Trend Analysis
Astera Labs, Inc. showed a bullish trend with a 149.21% price increase over the past 12 months, though growth decelerated recently. The stock experienced notable volatility, with a standard deviation of 50.14 and a high of 245.2.
CEVA, Inc. displayed a neutral overall trend with a 0.45% price increase in the same period, accompanied by low volatility (std deviation 4.4) and decelerating momentum. Recent months indicated a bearish short-term movement.
Comparing both, Astera Labs delivered the highest market performance with a strong positive return, while CEVA’s price remained essentially flat over the year.
Target Prices
The consensus target prices reflect optimistic analyst expectations for both Astera Labs, Inc. and CEVA, Inc.
| Company | Target High | Target Low | Consensus |
|---|---|---|---|
| Astera Labs, Inc. Common Stock | 225 | 165 | 202.14 |
| CEVA, Inc. | 28 | 28 | 28 |
Astera Labs’ consensus target of 202.14 USD is above its current price of 174.45 USD, indicating potential upside. CEVA’s fixed target consensus at 28 USD also suggests a positive outlook compared with its current 22.3 USD price.
Analyst Opinions Comparison
This section compares analysts’ ratings and grades for Astera Labs, Inc. Common Stock (ALAB) and CEVA, Inc. (CEVA):
Rating Comparison
ALAB Rating
- Rating: B, considered Very Favorable overall.
- Discounted Cash Flow Score: 1, very unfavorable for valuation.
- ROE Score: 4, favorable efficiency in generating profit from equity.
- ROA Score: 5, very favorable asset utilization.
- Debt To Equity Score: 4, favorable financial risk profile.
- Overall Score: 3, moderate overall financial standing.
CEVA Rating
- Rating: C+, also rated Very Favorable overall.
- Discounted Cash Flow Score: 3, moderate valuation outlook.
- ROE Score: 1, very unfavorable efficiency in generating profit from equity.
- ROA Score: 1, very unfavorable asset utilization.
- Debt To Equity Score: 4, favorable financial risk profile.
- Overall Score: 2, moderate overall financial standing but lower than ALAB.
Which one is the best rated?
Based strictly on provided data, ALAB is better rated overall with a higher rating grade (B vs. C+) and stronger scores in ROE, ROA, and overall financial standing. CEVA shows moderate valuation but weaker profitability metrics.
Scores Comparison
Here is a comparison of the Altman Z-Score and Piotroski Score for both companies:
ALAB Scores
- Altman Z-Score: 136.88, indicating a strong safe zone.
- Piotroski Score: 6, reflecting average financial health.
CEVA Scores
- Altman Z-Score: 9.99, also in the safe zone.
- Piotroski Score: 4, indicating average financial health.
Which company has the best scores?
ALAB shows a significantly higher Altman Z-Score than CEVA, suggesting stronger financial stability. Both have average Piotroski Scores, with ALAB slightly higher than CEVA. Overall, ALAB appears financially stronger based on these scores.
Grades Comparison
Here is the grades comparison for Astera Labs, Inc. Common Stock and CEVA, Inc.:
Astera Labs, Inc. Common Stock Grades
The following table shows recent grades from reputable grading companies for Astera Labs, Inc. Common Stock.
| Grading Company | Action | New Grade | Date |
|---|---|---|---|
| Northland Capital Markets | Maintain | Outperform | 2025-12-09 |
| Northland Capital Markets | Upgrade | Outperform | 2025-11-17 |
| Stifel | Maintain | Buy | 2025-11-05 |
| Morgan Stanley | Maintain | Overweight | 2025-11-05 |
| Roth Capital | Maintain | Buy | 2025-11-05 |
| Needham | Maintain | Buy | 2025-11-05 |
| JP Morgan | Maintain | Overweight | 2025-11-05 |
| TD Cowen | Maintain | Hold | 2025-11-05 |
| Barclays | Downgrade | Equal Weight | 2025-10-20 |
| Stifel | Maintain | Buy | 2025-10-17 |
Astera Labs maintains a predominantly positive grading trend, with most firms recommending Buy or Outperform ratings and only one recent downgrade observed.
CEVA, Inc. Grades
Below are the latest grades from established grading companies for CEVA, Inc.
| Grading Company | Action | New Grade | Date |
|---|---|---|---|
| Barclays | Maintain | Overweight | 2025-11-12 |
| Rosenblatt | Maintain | Buy | 2025-11-11 |
| Rosenblatt | Maintain | Buy | 2025-08-14 |
| Oppenheimer | Maintain | Outperform | 2025-05-09 |
| Rosenblatt | Maintain | Buy | 2025-05-08 |
| Barclays | Maintain | Overweight | 2025-05-08 |
| Rosenblatt | Maintain | Buy | 2025-04-23 |
| Barclays | Maintain | Overweight | 2025-02-14 |
| Rosenblatt | Maintain | Buy | 2025-02-14 |
| Rosenblatt | Maintain | Buy | 2025-02-11 |
CEVA exhibits a consistent pattern of Buy and Overweight ratings with no recent downgrades or negative actions.
Which company has the best grades?
Both Astera Labs and CEVA have received predominantly positive grades, with strong Buy and Outperform recommendations. CEVA shows a more stable pattern with no recent downgrades, which may indicate greater analyst confidence. Investors could interpret these grades as signals of potential performance stability and growth prospects for both companies.
Strengths and Weaknesses
Below is a comparison of key strengths and weaknesses for Astera Labs, Inc. (ALAB) and CEVA, Inc. (CEVA) based on recent financial and operational data.
| Criterion | Astera Labs, Inc. (ALAB) | CEVA, Inc. (CEVA) |
|---|---|---|
| Diversification | Primarily product-driven revenue (393M USD), limited service segment (3.2M USD) | Revenue mainly from licenses (60M USD) and royalties (47M USD), focused on IP licensing |
| Profitability | Negative net margin (-21.05%), ROIC -11.97%, value shedding but improving ROIC trend (+65.5%) | Negative net margin (-8.22%), ROIC -2.68%, value shedding with declining profitability |
| Innovation | High fixed asset turnover (11.12), indicating efficient use of assets in product innovation | Moderate fixed asset turnover (8.43), innovation linked to IP and licensing |
| Global presence | Limited data, but high current and quick ratios suggest strong liquidity | Similar liquidity profile, focus on global IP licensing markets |
| Market Share | Small market presence, no dominant share, struggling profitability | More established in licensing but shrinking returns and profitability |
Key Takeaways: Both companies are currently unprofitable and value-destructive, with ALAB showing improving return trends while CEVA faces declining profitability. ALAB relies heavily on product sales, whereas CEVA’s strength lies in licensing, but both face challenges in turning these into sustainable profits. Caution is advised when considering investment due to profitability risks.
Risk Analysis
Below is a comparative table outlining key risks for Astera Labs, Inc. (ALAB) and CEVA, Inc. based on the most recent 2024 data:
| Metric | Astera Labs, Inc. (ALAB) | CEVA, Inc. |
|---|---|---|
| Market Risk | High beta (1.51) signals volatility | High beta (1.44) indicates elevated market sensitivity |
| Debt level | Very low debt-to-equity (0.0), low debt-to-assets (0.12%) | Low debt-to-equity (0.02), low debt-to-assets (1.8%) |
| Regulatory Risk | Moderate, due to semiconductor industry compliance | Moderate, licensing and tech export regulations apply |
| Operational Risk | Negative net margin (-21.05%), unfavorable ROE and ROIC | Negative net margin (-8.22%), unfavorable ROE and ROIC |
| Environmental Risk | Typical for tech sector; no major exposure reported | Typical for tech sector; no major exposure reported |
| Geopolitical Risk | US-based, subject to US-China tech tensions | US-based, exposed to global trade and licensing risks |
Both companies face notable operational risks reflected in their negative profitability ratios and moderate market volatility. Astera Labs shows very low leverage, reducing financial risk, but its aggressive valuation and negative cash flow pose concerns. CEVA also maintains low debt but suffers from weaker profitability metrics. Market and geopolitical factors, especially semiconductor supply chain and trade tensions, remain critical risks for both. Investors should weigh these risks carefully alongside growth prospects.
Which Stock to Choose?
Astera Labs, Inc. (ALAB) shows strong revenue growth of 242% in 2024 with a favorable gross margin of 76%, but profitability remains negative with a -21% net margin and unfavorable returns on equity and invested capital. Its debt levels are low and stable, supported by a very favorable debt-to-equity ratio and a solid current ratio, though overall financial ratios are mostly unfavorable. The company’s rating is very favorable at B, reflecting moderate overall financial health but some valuation concerns.
CEVA, Inc. (CEVA) reports moderate revenue growth near 10% in 2024 and a high gross margin of 88%, with improving but still negative profitability at an -8% net margin. The company carries higher net debt relative to EBITDA and has mixed financial ratios, with a favorable debt profile but less favorable returns. CEVA’s rating is also very favorable at C+, supported by moderate overall scores despite weaker profitability metrics.
Investors with a preference for companies exhibiting strong growth potential and improving profitability might view ALAB’s expanding revenue and high gross margin as attractive, despite its current losses and financial ratio challenges. Conversely, those seeking more stable operations with moderate growth and solid debt management could interpret CEVA’s profile as more aligned with cautious strategies, given its less volatile revenue and mixed profitability signals. The differing ratings and financial profiles suggest the choice depends largely on an investor’s risk tolerance and investment focus.
Disclaimer: Investment carries a risk of loss of initial capital. The past performance is not a reliable indicator of future results. Be sure to understand risks before making an investment decision.
Go Further
I encourage you to read the complete analyses of Astera Labs, Inc. Common Stock and CEVA, Inc. to enhance your investment decisions: