Broadcom Inc. (AVGO) and Astera Labs, Inc. (ALAB) are two prominent players in the semiconductor industry, yet they differ vastly in scale and focus. Broadcom is a global technology giant with a diverse product portfolio, while Astera Labs is an innovative newcomer specializing in connectivity solutions for cloud and AI infrastructure. This article will explore their strengths and risks to identify which company presents a more compelling opportunity for investors today.

Table of contents
Companies Overview
I will begin the comparison between Broadcom Inc. and Astera Labs, Inc. by providing an overview of these two companies and their main differences.
Broadcom Inc. Overview
Broadcom Inc. is a global technology firm headquartered in San Jose, California, specializing in semiconductor and infrastructure software solutions. With 37,000 employees, it operates through four segments: Wired Infrastructure, Wireless Communications, Enterprise Storage, and Industrial & Other. Broadcom’s diverse product range supports enterprise networking, data centers, telecommunications, and alternative energy systems, positioning it as a major player in the semiconductor industry.
Astera Labs, Inc. Overview
Astera Labs, incorporated in 2017 and based in Santa Clara, California, focuses on semiconductor-based connectivity solutions for cloud and AI infrastructure. Employing around 440 people, the company offers a portfolio of data, network, and memory connectivity products built on a software-defined architecture to support high-performance cloud and AI deployments. Astera Labs is a newer, smaller player targeting specialized connectivity solutions within the semiconductor sector.
Key similarities and differences
Both companies operate in the semiconductor industry and are listed on NASDAQ, serving technology markets in the US. Broadcom is a large, diversified firm with a broad product base across multiple technology segments, while Astera Labs is a smaller, specialized company concentrating on connectivity solutions for cloud and AI infrastructure. Broadcom’s scale and product diversity contrast with Astera Labs’ focused approach on emerging high-performance applications.
Income Statement Comparison
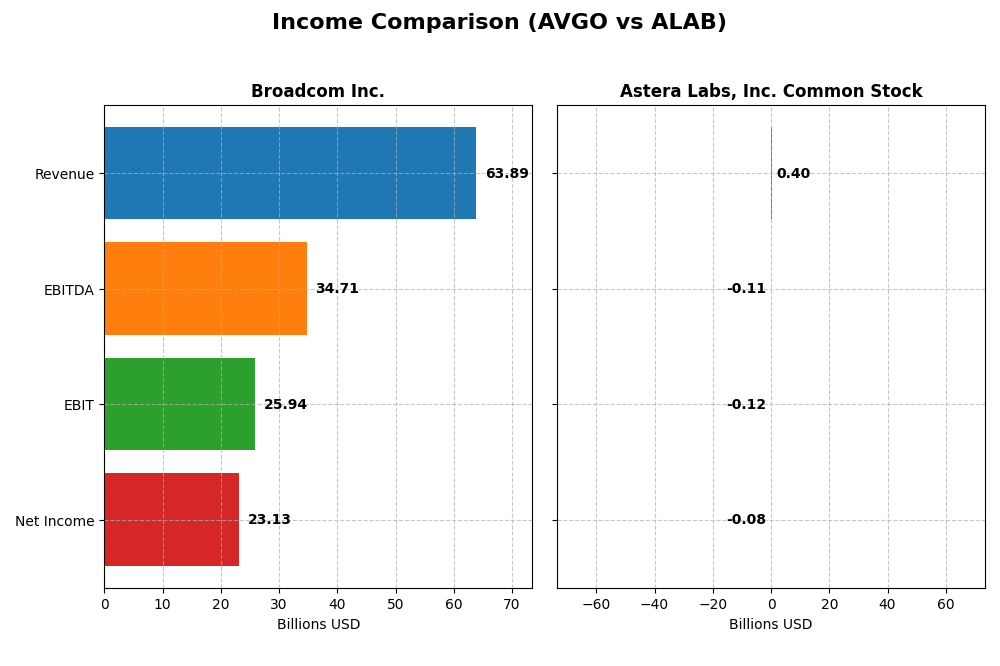
This table provides a side-by-side comparison of the most recent fiscal year income statement metrics for Broadcom Inc. and Astera Labs, Inc. Common Stock.
| Metric | Broadcom Inc. (AVGO) | Astera Labs, Inc. (ALAB) |
|---|---|---|
| Market Cap | 1.60T | 29.1B |
| Revenue | 63.9B | 396M |
| EBITDA | 34.7B | -113M |
| EBIT | 25.9B | -116M |
| Net Income | 23.1B | -83.4M |
| EPS | 4.91 | -0.64 |
| Fiscal Year | 2025 | 2024 |
Income Statement Interpretations
Broadcom Inc.
Broadcom demonstrated strong revenue growth from $27.45B in 2021 to $63.89B in 2025, with net income surging from $6.44B to $23.13B. Margins improved considerably, reflected in a 67.77% gross margin and a 36.2% net margin in 2025. The latest year showed sustained growth momentum with a 23.87% revenue increase and a striking 216.69% net margin expansion.
Astera Labs, Inc. Common Stock
Astera Labs’ revenue jumped significantly from $79.87M in 2022 to $396.3M in 2024, but net income remained negative, widening from -$58.35M to -$83.42M. Despite a favorable gross margin of 76.38%, its EBIT and net margins were negative, indicating ongoing operating losses. The most recent year saw strong revenue growth at 242.24%, though profitability challenges persist with unfavorable EBIT and EPS trends.
Which one has the stronger fundamentals?
Broadcom’s fundamentals are robust, marked by consistent revenue and profit growth, strong margins, and positive earnings per share trends. In contrast, Astera Labs, while growing rapidly in revenue, shows persistent net losses and negative operating margins, reflecting higher risk. Overall, Broadcom’s income statement metrics are substantially more favorable and stable compared to Astera Labs’ mixed performance.
Financial Ratios Comparison
The table below presents the most recent key financial ratios for Broadcom Inc. and Astera Labs, Inc. Common Stock, enabling a straightforward comparison of their financial performance and stability.
| Ratios | Broadcom Inc. (2025) | Astera Labs, Inc. (2024) |
|---|---|---|
| ROE | 28.4% | -8.6% |
| ROIC | 16.4% | -12.0% |
| P/E | 73.9 | -208.4 |
| P/B | 21.0 | 18.0 |
| Current Ratio | 1.71 | 11.7 |
| Quick Ratio | 1.58 | 11.2 |
| D/E | 0.80 | 0.0013 |
| Debt-to-Assets | 38.1% | 0.12% |
| Interest Coverage | 7.94 | 0 |
| Asset Turnover | 0.37 | 0.38 |
| Fixed Asset Turnover | 25.3 | 11.1 |
| Payout ratio | 48.2% | 0% |
| Dividend yield | 0.65% | 0% |
Interpretation of the Ratios
Broadcom Inc.
Broadcom shows strong profitability with a 36.2% net margin and 28.45% return on equity, indicating efficient operations and shareholder value creation. Its liquidity ratios are solid, but high price-to-earnings (PE) and price-to-book (PB) ratios raise valuation concerns. The company pays dividends with a 0.65% yield, though this is relatively low, suggesting cautious distribution to shareholders.
Astera Labs, Inc. Common Stock
Astera Labs exhibits weak financial health, with negative net margin (-21.05%) and return on equity (-8.65%), reflecting operational losses and inefficiency. The firm holds no dividend payouts, consistent with its high research and development spend and growth focus. Liquidity ratios are mixed, with a very high current ratio but zero interest coverage, signaling financial stress.
Which one has the best ratios?
Broadcom’s ratios are generally stronger, with favorable profitability, liquidity, and coverage metrics, despite some valuation concerns. Astera Labs displays mostly unfavorable ratios, driven by losses and weak returns, reflecting its early-stage growth phase and reinvestment strategy. Overall, Broadcom holds a more balanced and slightly favorable financial profile.
Strategic Positioning
This section compares the strategic positioning of Broadcom Inc. and Astera Labs, Inc. Common Stock, including market position, key segments, and exposure to disruption:
Broadcom Inc.
- Large market cap of 1.6T USD with established competitive pressure in semiconductors.
- Operates through multiple segments: Wired Infrastructure, Wireless Communications, Enterprise Storage, Industrial & Other.
- Exposure to disruption through diverse semiconductor and infrastructure software products.
Astera Labs, Inc. Common Stock
- Smaller market cap near 29B USD, competing in niche cloud and AI infrastructure.
- Focuses on semiconductor-based connectivity solutions for cloud and AI infrastructure.
- Specialized in software-defined architectures enabling scalable cloud and AI deployments.
Broadcom Inc. vs Astera Labs, Inc. Common Stock Positioning
Broadcom’s diversified segments provide broad market exposure and revenue streams, while Astera Labs concentrates on connectivity solutions for cloud and AI infrastructure. Broadcom benefits from scale; Astera Labs targets a high-growth niche but with less diversification.
Which has the best competitive advantage?
Broadcom shows a very favorable moat evaluation with a durable competitive advantage and growing profitability. Astera Labs has a slightly unfavorable moat, indicating value destruction despite improving profitability.
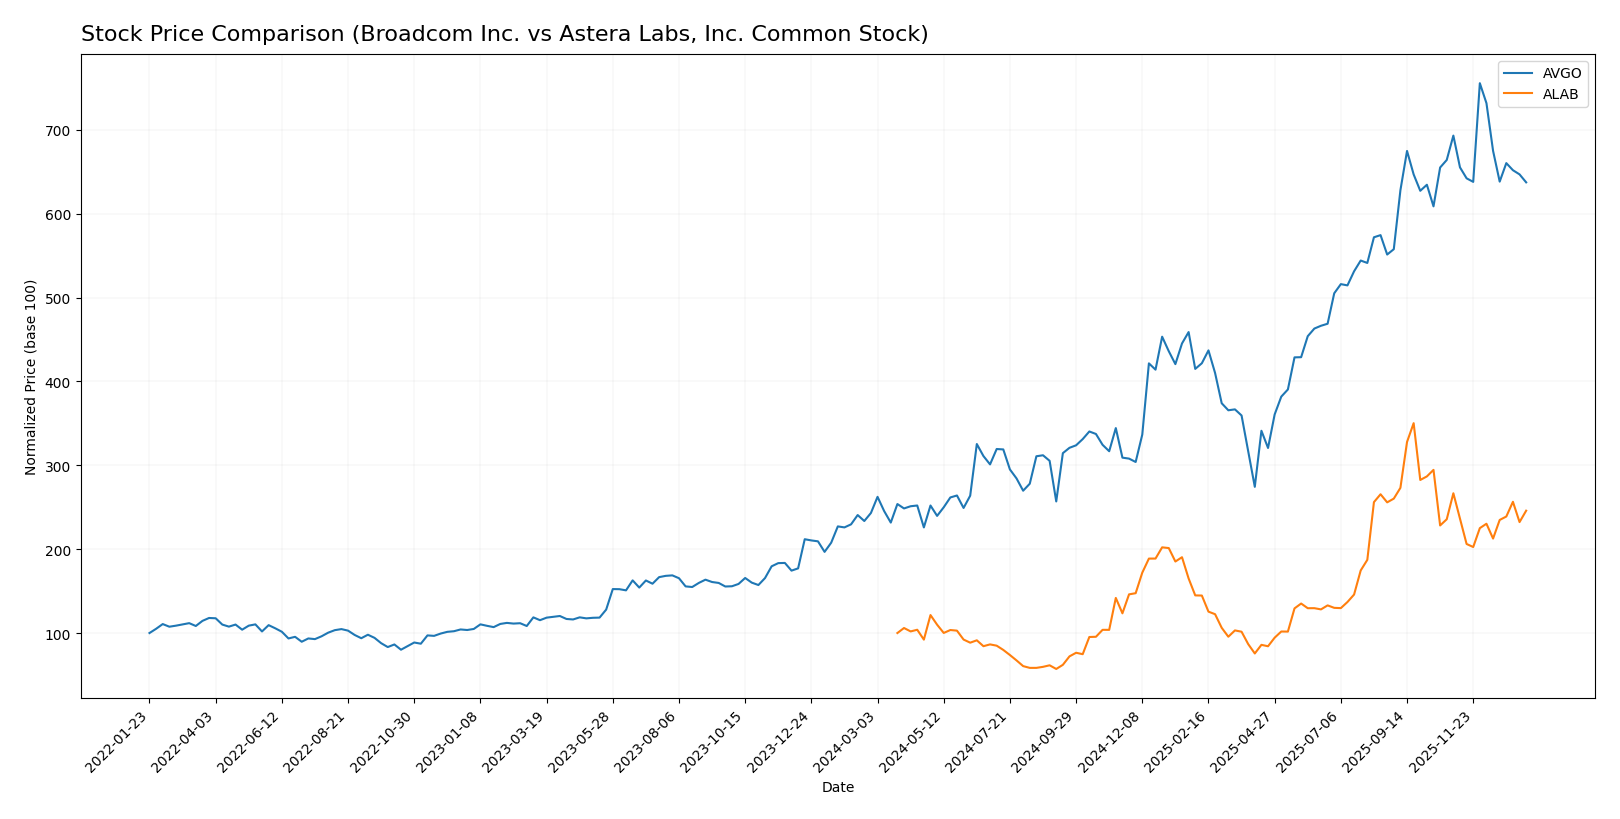
Stock Comparison
The stock price chart highlights significant bullish trends for both Broadcom Inc. (AVGO) and Astera Labs, Inc. (ALAB) over the past 12 months, with notable deceleration in growth and contrasting recent trading dynamics.
Trend Analysis
Broadcom Inc. (AVGO) exhibited a strong bullish trend over the past 12 months with a 162.18% price increase, though this growth showed signs of deceleration. Recent months reflected a bearish trend with an 8.05% decline.
Astera Labs, Inc. (ALAB) also showed a bullish trend with a 145.91% gain over the year, alongside deceleration. The recent period saw a slight bearish dip of 7.79%, but the trend slope indicated mild recovery.
Comparing both, AVGO delivered the highest market performance with a 162.18% increase versus ALAB’s 145.91% over the past year, despite recent short-term declines in both stocks.
Target Prices
The current analyst consensus suggests promising upside potential for both Broadcom Inc. and Astera Labs, Inc.
| Company | Target High | Target Low | Consensus |
|---|---|---|---|
| Broadcom Inc. | 510 | 370 | 454.8 |
| Astera Labs, Inc. | 225 | 155 | 200.71 |
Analysts expect Broadcom’s stock to trade significantly above its current price of $339.89, while Astera Labs shows a similar positive target consensus well above its current $172.14 price. This reflects overall bullish sentiment in the semiconductor sector.
Analyst Opinions Comparison
This section compares analysts’ ratings and grades for Broadcom Inc. and Astera Labs, Inc. Common Stock:
Rating Comparison
Broadcom Inc. Rating
- Rating: Both companies have a “B” rating indicating a very favorable status.
- Discounted Cash Flow Score: Moderate score of 3 suggests average valuation based on future cash flows.
- ROE Score: Very favorable score of 5 reflects strong profit generation from equity.
- ROA Score: Very favorable score of 5 indicates excellent asset utilization to generate earnings.
- Debt To Equity Score: Very unfavorable score of 1 indicates high financial risk from debt.
- Overall Score: Moderate score of 3 reflects a balanced overall financial standing.
Astera Labs, Inc. Common Stock Rating
- Rating: Both companies have a “B” rating indicating a very favorable status.
- Discounted Cash Flow Score: Very unfavorable score of 1 indicating potential overvaluation.
- ROE Score: Favorable score of 4 shows good but lower efficiency in profit generation.
- ROA Score: Very favorable score of 5 indicates excellent asset utilization to generate earnings.
- Debt To Equity Score: Favorable score of 4 shows relatively low financial risk and better balance sheet strength.
- Overall Score: Moderate score of 3 reflects a balanced overall financial standing.
Which one is the best rated?
Both Broadcom and Astera Labs share the same overall rating of “B” and an overall score of 3. Broadcom leads in profitability metrics with higher ROE but carries more financial risk due to debt, while Astera Labs has a stronger debt profile but weaker valuation scores.
Scores Comparison
Here is a comparison of the Altman Z-Score and Piotroski Score for Broadcom Inc. and Astera Labs, Inc. Common Stock:
Broadcom Inc. Scores
- Altman Z-Score of 12.13, indicating a safe zone.
- Piotroski Score of 8, classified as very strong.
Astera Labs Scores
- Altman Z-Score of 136.88, indicating a safe zone.
- Piotroski Score of 6, classified as average.
Which company has the best scores?
Astera Labs has a higher Altman Z-Score, suggesting stronger bankruptcy safety, while Broadcom shows a higher Piotroski Score, indicating better financial strength.
Grades Comparison
Here is a detailed comparison of the grades issued by recognized grading companies for both Broadcom Inc. and Astera Labs, Inc. Common Stock:
Broadcom Inc. Grades
The table below summarizes recent grades assigned by reputable firms for Broadcom Inc.:
| Grading Company | Action | New Grade | Date |
|---|---|---|---|
| Mizuho | Maintain | Outperform | 2026-01-09 |
| Truist Securities | Maintain | Buy | 2025-12-19 |
| UBS | Maintain | Buy | 2025-12-15 |
| Benchmark | Maintain | Buy | 2025-12-12 |
| Rosenblatt | Maintain | Buy | 2025-12-12 |
| Piper Sandler | Maintain | Overweight | 2025-12-12 |
| TD Cowen | Maintain | Buy | 2025-12-12 |
| B of A Securities | Maintain | Buy | 2025-12-12 |
| JP Morgan | Maintain | Overweight | 2025-12-12 |
| Mizuho | Maintain | Outperform | 2025-12-12 |
Overall, Broadcom Inc. maintains a strong positive trend with multiple Buy and Outperform ratings sustained by leading institutions.
Astera Labs, Inc. Common Stock Grades
The following table presents recent grades given by established grading companies for Astera Labs:
| Grading Company | Action | New Grade | Date |
|---|---|---|---|
| Northland Capital Markets | Maintain | Outperform | 2025-12-09 |
| Northland Capital Markets | Upgrade | Outperform | 2025-11-17 |
| Stifel | Maintain | Buy | 2025-11-05 |
| Morgan Stanley | Maintain | Overweight | 2025-11-05 |
| Roth Capital | Maintain | Buy | 2025-11-05 |
| Needham | Maintain | Buy | 2025-11-05 |
| JP Morgan | Maintain | Overweight | 2025-11-05 |
| TD Cowen | Maintain | Hold | 2025-11-05 |
| Barclays | Downgrade | Equal Weight | 2025-10-20 |
| Stifel | Maintain | Buy | 2025-10-17 |
Astera Labs shows a generally favorable grading pattern with multiple Buy and Outperform ratings, though with some downgrades and Hold ratings indicating mixed sentiment.
Which company has the best grades?
Broadcom Inc. has consistently received higher and more stable grades, predominantly Buy and Outperform, compared to Astera Labs, which displays some variability including downgrades and Hold ratings. This difference could influence investors seeking more consensus-driven positive outlooks.
Strengths and Weaknesses
Here is a comparative overview of the key strengths and weaknesses of Broadcom Inc. (AVGO) and Astera Labs, Inc. (ALAB) based on the most recent data.
| Criterion | Broadcom Inc. (AVGO) | Astera Labs, Inc. (ALAB) |
|---|---|---|
| Diversification | Highly diversified with strong segments in Infrastructure Software ($27B) and Semiconductor Solutions ($37B) | Limited diversification; primarily focused on product sales ($393M) with minor technology services |
| Profitability | Strong profitability with 36.2% net margin, 28.45% ROE, and 16.36% ROIC; creating value | Negative profitability; net margin -21.05%, ROE -8.65%, ROIC -11.97%; currently shedding value |
| Innovation | Consistent investment in innovation reflected in growing ROIC (+34.4%) and durable competitive advantage | Improving ROIC trend (+65.5%) but still value destructive; innovation may be emerging but not yet profitable |
| Global presence | Established global footprint in multiple tech sectors with large revenue base | Smaller scale with limited global reach indicated by revenue size and niche market focus |
| Market Share | Significant market share in semiconductor and software infrastructure markets | Small market share as an emerging company in semiconductor components |
Key takeaways: Broadcom shows a robust and diversified business model with strong profitability and a sustainable competitive edge. Astera Labs, while demonstrating improving profitability trends, remains in a value-destructive phase with limited scale and diversification. Careful risk management favors Broadcom for stability, with Astera Labs suitable only for higher-risk, growth-oriented portfolios.
Risk Analysis
Below is a comparison of key risks for Broadcom Inc. (AVGO) and Astera Labs, Inc. (ALAB) based on their latest financial and market data:
| Metric | Broadcom Inc. (AVGO) | Astera Labs, Inc. (ALAB) |
|---|---|---|
| Market Risk | Beta 1.22, large cap 1.6T USD, price volatility moderate | Beta 1.51, smaller cap 29B USD, higher volatility |
| Debt level | Debt-to-Equity 0.8 (neutral), Debt/Assets 38% (neutral) | Debt-to-Equity 0.0 (favorable), Debt/Assets 0.12% (favorable) |
| Regulatory Risk | Moderate, operates globally with exposure to trade policies | Moderate, newer company focusing on AI/cloud infrastructure |
| Operational Risk | Diverse segments, large scale operations, some asset turnover inefficiency | Smaller scale, newer operations with lower asset turnover |
| Environmental Risk | Moderate, semiconductor manufacturing footprint | Moderate, focused on connectivity solutions, less resource intensive |
| Geopolitical Risk | Exposure to US-China tech tensions, supply chain risks | Exposure to global chip supply chain disruptions |
Synthesis: Broadcom’s market risk is tempered by its scale and diversified portfolio, but it faces moderate leverage and geopolitical exposure, particularly from US-China tensions. Astera Labs shows higher market volatility and operational risk due to its startup profile but benefits from minimal debt. Both require monitoring of semiconductor industry cycles and regulatory changes, with Broadcom’s debt level and geopolitical risks being more impactful currently.
Which Stock to Choose?
Broadcom Inc. (AVGO) shows strong income growth with a 132.74% revenue increase over five years and a favorable income statement marked by high net and EBIT margins. Its profitability ratios, including a 28.45% ROE and 16.36% ROIC, are favorable, supported by moderate debt levels and a very favorable overall rating.
Astera Labs, Inc. (ALAB) exhibits rapid revenue growth of 396.16% over three years but has an overall neutral income statement due to negative EBIT and net margins. Financial ratios reveal unfavorable profitability metrics, though it maintains low debt and a slightly unfavorable moat status; its rating is very favorable overall but with several unfavorable valuation ratios.
Investors prioritizing durable profitability and value creation may find Broadcom’s profile more aligned with their goals, while those focused on high growth potential despite current profitability challenges might consider Astera Labs. The differing income stability and financial ratio profiles suggest distinct risk and opportunity balances depending on investor tolerance.
Disclaimer: Investment carries a risk of loss of initial capital. The past performance is not a reliable indicator of future results. Be sure to understand risks before making an investment decision.
Go Further
I encourage you to read the complete analyses of Broadcom Inc. and Astera Labs, Inc. Common Stock to enhance your investment decisions: