Home > Comparison > Technology > ASML vs TSEM
The strategic rivalry between ASML Holding N.V. and Tower Semiconductor Ltd. shapes the semiconductor industry’s evolution. ASML, a capital-intensive technology leader, specializes in advanced lithography systems, while Tower Semiconductor operates as a versatile analog mixed-signal foundry with customizable process technologies. This clash highlights a battle between cutting-edge equipment manufacturing and flexible chip production. This analysis will identify which business model delivers superior risk-adjusted returns for diversified investors navigating the semiconductor sector.
Table of contents
Companies Overview
ASML Holding N.V. and Tower Semiconductor Ltd. shape the semiconductor industry’s advanced manufacturing and foundry landscapes.
ASML Holding N.V.: Semiconductor Equipment Powerhouse
ASML dominates the semiconductor equipment sector with cutting-edge lithography and metrology systems. Its revenue hinges on selling and servicing extreme ultraviolet and deep ultraviolet lithography machines, vital for chipmakers’ node shrinkage. In 2026, ASML sharpens its focus on enhancing computational lithography and expanding customer support globally, reinforcing its technological edge.
Tower Semiconductor Ltd.: Independent Foundry Specialist
Tower Semiconductor operates as a nimble independent semiconductor foundry, producing analog-intensive mixed-signal devices. Its core revenue comes from wafer fabrication and customizable process technologies spanning SiGe to MEMS, serving diverse markets like automotive and aerospace. The 2026 strategy centers on broadening design enablement platforms and optimizing transfer processes to attract fabless customers.
Strategic Collision: Similarities & Divergences
ASML and Tower both push semiconductor innovation but from divergent angles: ASML with a closed ecosystem of lithography tools, Tower with an open foundry infrastructure. Their primary battleground is wafer production efficiency and technology adoption. ASML exhibits a capital-intensive moat with high barriers to entry, while Tower offers flexibility and market diversification, defining distinct investment profiles in this high-stakes sector.
Income Statement Comparison
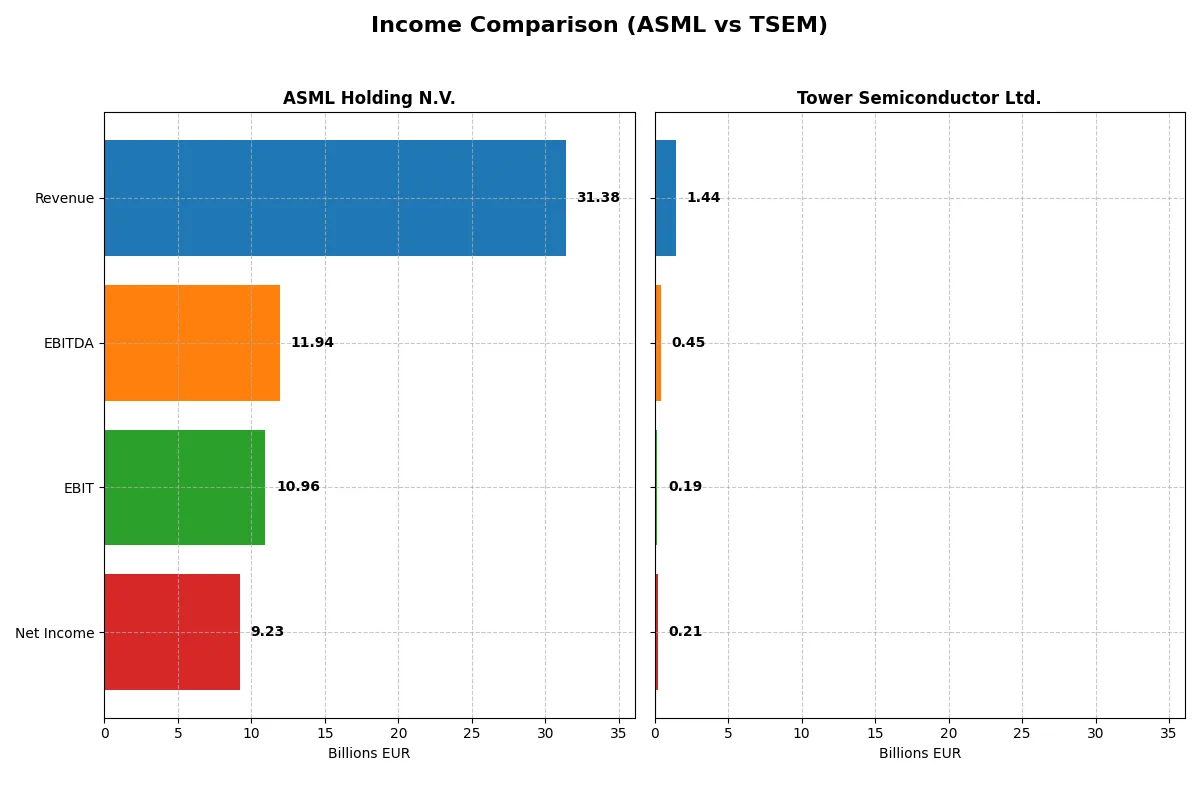
This data dissects the core profitability and scalability of both corporate engines to reveal who dominates the bottom line:
| Metric | ASML Holding N.V. (ASML) | Tower Semiconductor Ltd. (TSEM) |
|---|---|---|
| Revenue | 31.4B EUR | 1.44B USD |
| Cost of Revenue | 14.8B EUR | 1.10B USD |
| Operating Expenses | 5.72B EUR | 148M USD |
| Gross Profit | 16.6B EUR | 339M USD |
| EBITDA | 11.9B EUR | 451M USD |
| EBIT | 11.0B EUR | 185M USD |
| Interest Expense | 0 | 5.86M USD |
| Net Income | 9.23B EUR | 208M USD |
| EPS | 23.76 EUR | 1.87 USD |
| Fiscal Year | 2025 | 2024 |
Income Statement Analysis: The Bottom-Line Duel
This income statement comparison reveals the operational efficiency and profitability momentum of two semiconductor industry leaders.
ASML Holding N.V. Analysis
ASML’s revenue surged from 18.6B EUR in 2021 to 31.4B EUR in 2025, with net income climbing from 5.9B to 9.2B EUR. Gross and net margins remain robust at 52.8% and 29.4%, respectively. In 2025, ASML accelerated earnings growth, reflecting disciplined cost control and high R&D investment fueling innovation and market leadership.
Tower Semiconductor Ltd. Analysis
Tower’s revenue grew modestly from 1.27B USD in 2020 to 1.44B USD in 2024, while net income expanded from 82M to 208M USD. Margins stand lower, with a 23.6% gross margin and 14.5% net margin in 2024. Despite overall growth, recent declines in profitability and EBIT margin highlight challenges in scaling efficiency amid competitive pressures.
Margin Dominance vs. Earnings Resilience
ASML clearly outpaces Tower in scale and margin quality, with superior EBITDA and net income growth confirming operational strength. Tower exhibits resilience with net income growth over time but faces margin compression and recent earnings volatility. For investors, ASML’s profile signals a commanding industry moat and earnings power, while Tower’s outlook demands cautious scrutiny.
Financial Ratios Comparison
These vital ratios act as a diagnostic tool to expose the underlying fiscal health, valuation premiums, and capital efficiency of the companies analyzed:
| Ratios | ASML Holding N.V. (ASML) | Tower Semiconductor Ltd. (TSEM) |
|---|---|---|
| ROE | 47.1% | 7.8% |
| ROIC | 34.1% | 6.4% |
| P/E | 38.3 | 27.5 |
| P/B | 18.0 | 2.16 |
| Current Ratio | 1.26 | 6.18 |
| Quick Ratio | 0.79 | 5.23 |
| D/E | 0.14 | 0.07 |
| Debt-to-Assets | 5.4% | 5.9% |
| Interest Coverage | N/A | 32.6 |
| Asset Turnover | 0.62 | 0.47 |
| Fixed Asset Turnover | 3.81 | 1.11 |
| Payout ratio | 26.5% | 0% |
| Dividend yield | 0.69% | 0% |
| Fiscal Year | 2025 | 2024 |
Efficiency & Valuation Duel: The Vital Signs
Financial ratios serve as a company’s DNA, uncovering hidden risks and revealing operational strengths essential for investment analysis.
ASML Holding N.V.
ASML delivers exceptional profitability with a 47.1% ROE and a robust 29.4% net margin, signaling strong operational efficiency. Its valuation appears stretched, trading at a high 38.3 P/E and 18.1 P/B. The stock yields a modest 0.7% dividend, balancing shareholder returns with significant reinvestment in R&D for growth.
Tower Semiconductor Ltd.
Tower Semiconductor posts a modest 7.8% ROE and a 14.5% net margin, reflecting moderate profitability. Its P/E of 27.5 and P/B near 2.2 indicate a more reasonable valuation. The company pays no dividend, opting instead to reinvest heavily in growth and maintain a very strong liquidity position, evident in a 6.18 current ratio.
Premium Valuation vs. Operational Safety
ASML commands a premium valuation justified by superior profitability and disciplined capital allocation. Tower Semiconductor offers a more conservative valuation with solid liquidity but weaker returns. Investors seeking high operational efficiency may favor ASML, while those prioritizing financial safety might lean toward Tower’s profile.
Which one offers the Superior Shareholder Reward?
I see ASML Holding offers a balanced distribution with a 0.97% dividend yield and a 27% payout ratio, covered comfortably by free cash flow at 3.07x. ASML’s significant buyback programs enhance shareholder returns sustainably, supported by strong operating cash flows. Tower Semiconductor pays no dividends, focusing on reinvestment and modest buybacks, but its free cash flow coverage is weak at 0.03x. Given ASML’s robust capital allocation, dividend sustainability, and active buybacks, I conclude ASML provides a superior total shareholder reward in 2026.
Comparative Score Analysis: The Strategic Profile
The radar chart reveals the fundamental DNA and trade-offs of ASML Holding N.V. and Tower Semiconductor Ltd., highlighting their financial strengths and valuation differences:
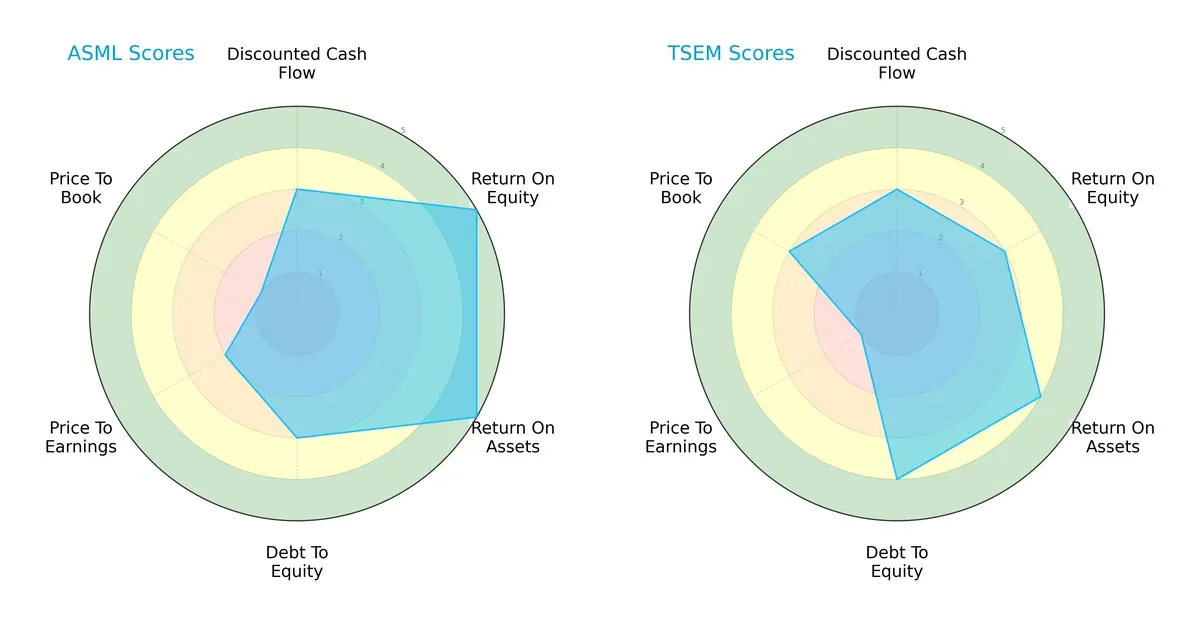
ASML leads with superior profitability metrics, scoring 5 in ROE and ROA, reflecting efficient capital use and asset management. Tower Semiconductor shows a stronger balance sheet with a better debt-to-equity score of 4 versus ASML’s 3. Valuation scores favor Tower Semiconductor on price-to-book but penalize both on price-to-earnings. ASML’s profile is more skewed toward operational excellence, while Tower Semiconductor balances financial stability with moderate returns.
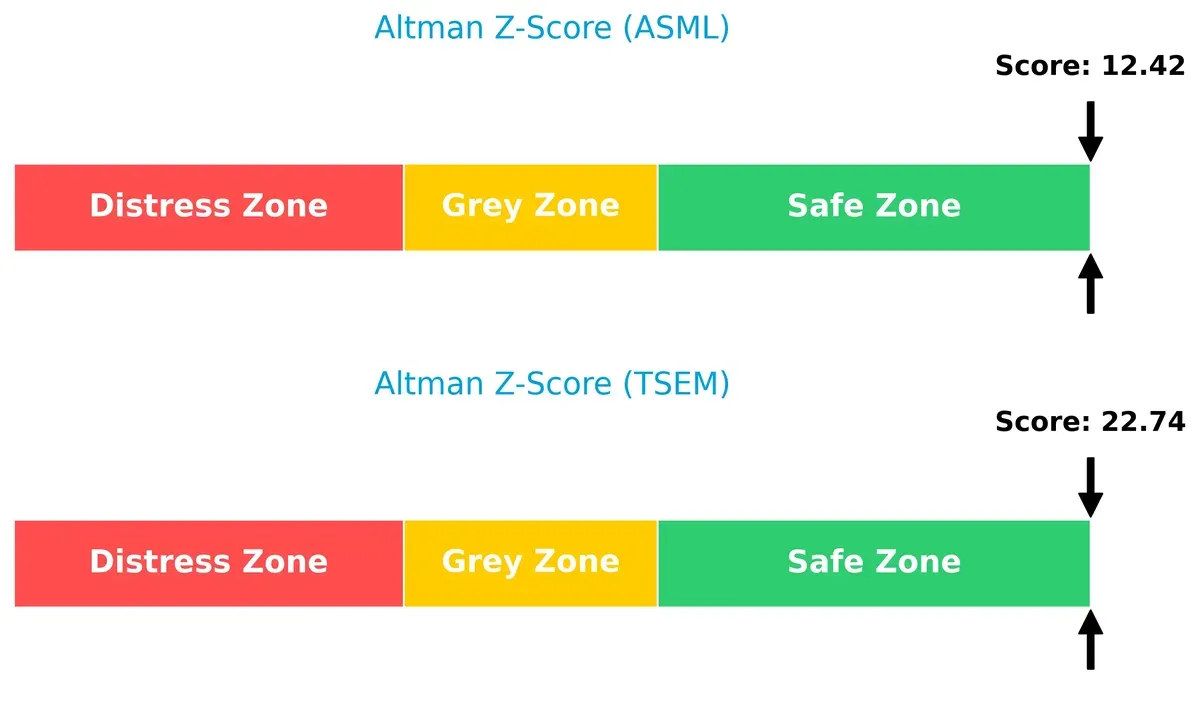
Bankruptcy Risk: Solvency Showdown
The Altman Z-Score gap favors Tower Semiconductor at 22.7 versus ASML’s 12.4, both well within the safe zone, implying robust solvency and low bankruptcy risk in this cycle:
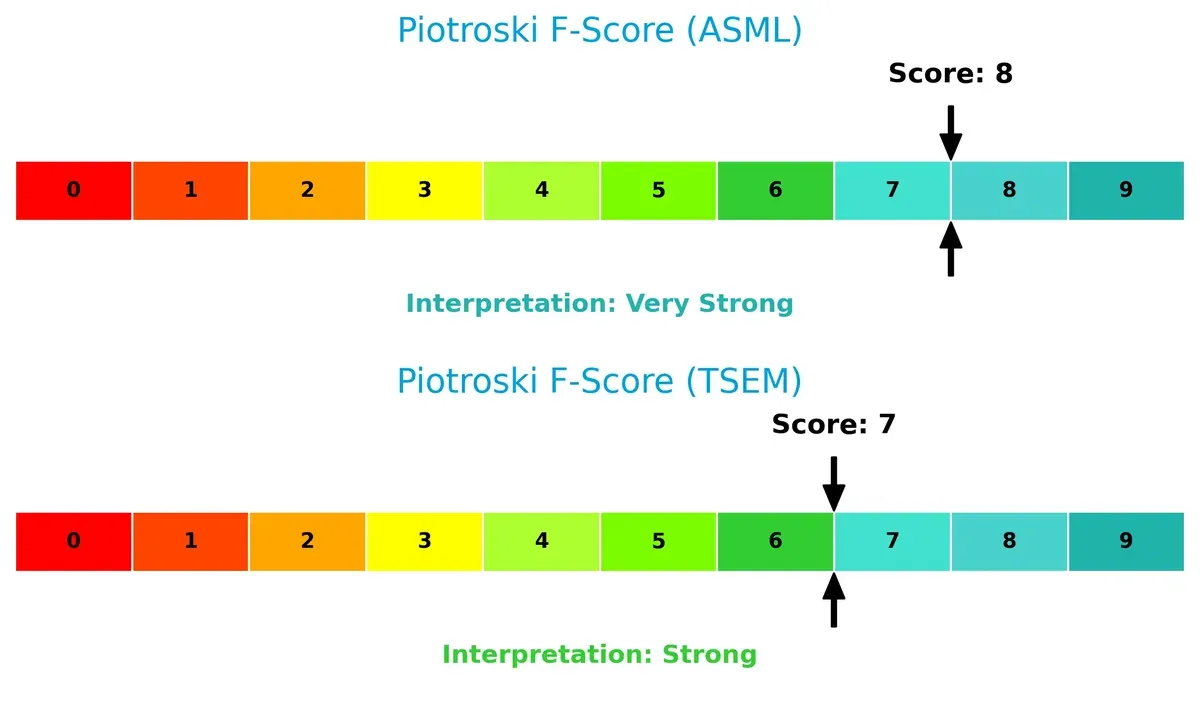
Financial Health: Quality of Operations
ASML scores an 8 on the Piotroski F-Score, indicating very strong financial health, slightly outperforming Tower Semiconductor’s strong 7, signaling minor operational red flags relative to ASML:
How are the two companies positioned?
This section dissects ASML and TSEM’s operational DNA by comparing revenue distribution and internal dynamics. The final aim is to confront their economic moats to identify the most resilient, sustainable advantage today.
Revenue Segmentation: The Strategic Mix
This visual comparison dissects how ASML Holding N.V. and Tower Semiconductor Ltd. diversify their income streams and where their primary sector bets lie:
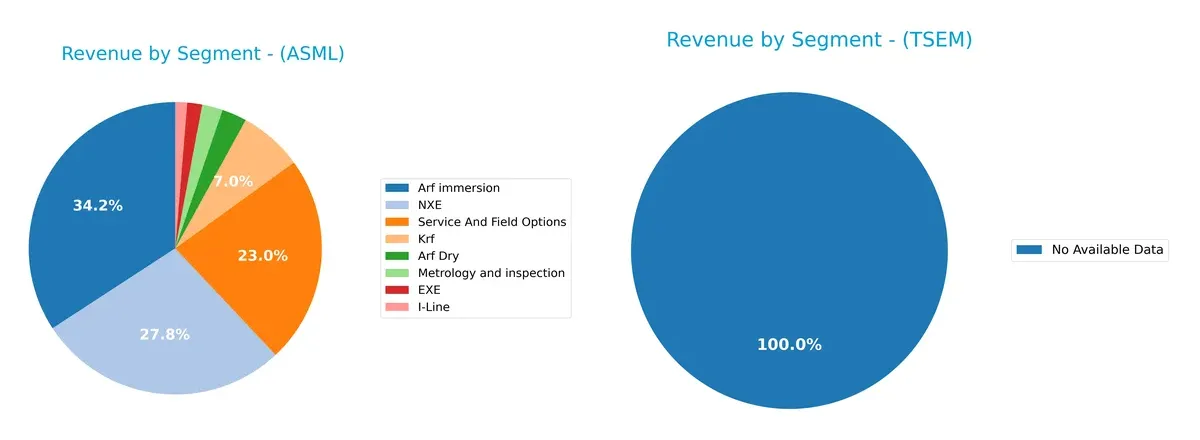
ASML’s revenue concentrates heavily in Arf immersion (9.7B) and NXE (7.9B), anchoring its dominance in advanced lithography. It also generates 6.5B from Service And Field Options, reflecting strong aftermarket ecosystem lock-in. Tower Semiconductor lacks available data, preventing segmentation comparison. ASML’s reliance on a few high-value segments suggests infrastructure dominance but exposes it to concentration risk if market dynamics shift.
Strengths and Weaknesses Comparison
This table compares the Strengths and Weaknesses of ASML and TSEM based on diversification, profitability, financials, innovation, global presence, and market share:
ASML Strengths
- High profitability with 29.42% net margin and 47.08% ROE
- Strong ROIC at 34.14% well above WACC
- Low debt levels with 0.14 D/E ratio
- Global presence including China, USA, Korea, and Taiwan
- Diverse product segments including EUV and metrology systems
- Favorable fixed asset turnover at 3.81
TSEM Strengths
- Favorable net margin at 14.47%
- Low debt with 0.07 D/E ratio and strong interest coverage
- Quick ratio strong at 5.23 indicating liquidity
- Favorable WACC at 7.87% supporting efficient capital use
- Presence in semiconductor niche markets
- Neutral P/B ratio of 2.16
ASML Weaknesses
- High valuation multiples with PE 38.33 and PB 18.05
- Quick ratio weak at 0.79 signaling liquidity risk
- Dividend yield low at 0.69%
- WACC high at 10.08% increasing capital costs
- Moderate current ratio at 1.26 limits short-term flexibility
- Moderate asset turnover at 0.62
TSEM Weaknesses
- Low ROE at 7.83% below sector standards
- Current ratio very high at 6.18 indicating inefficient asset use
- Asset turnover weak at 0.47 limiting revenue generation
- PE ratio elevated at 27.54
- Zero dividend yield may deter income investors
- Neutral fixed asset turnover at 1.11
ASML’s strengths lie in high profitability, global diversification, and capital efficiency, though stretched valuation and liquidity ratios warrant caution. TSEM shows solid liquidity and low leverage but faces challenges in profitability and asset utilization. Both companies exhibit slightly favorable overall financial health but must address their respective weaknesses to optimize strategy execution.
The Moat Duel: Analyzing Competitive Defensibility
A structural moat is the only thing protecting long-term profits from relentless competition erosion. Here’s how ASML Holding N.V. and Tower Semiconductor Ltd. stack up:
ASML Holding N.V.: Technological and Intellectual Property Fortress
ASML’s moat stems from its exclusive advanced lithography technology and deep intangible assets. This translates into a robust 34.9% EBIT margin and a 24% ROIC premium over WACC. In 2026, expanding EUV systems and software upgrades will deepen this moat, reinforcing its industry-leading position.
Tower Semiconductor Ltd.: Niche Process Specialization with Growth Challenges
Tower’s moat lies in customizable analog and mixed-signal fabrication, distinct from ASML’s tech dominance. Despite a 44.6% ROIC growth trend, it posts a negative ROIC vs. WACC spread, signaling value destruction. Opportunities lie in expanding specialty foundry services, but rising competition threatens margin stability.
Moat Supremacy: Advanced Lithography vs. Specialty Foundry
ASML commands a wider and more durable moat, evidenced by its substantial economic profit and margin leadership. Tower’s improving ROIC trend is positive but insufficient to offset value loss. ASML is clearly better positioned to defend and grow its market share through unmatched technology and intellectual property control.
Which stock offers better returns?
Over the past 12 months, ASML Holding N.V. and Tower Semiconductor Ltd. showed strong price growth with distinct acceleration patterns and notable highs, reflecting robust trading momentum.
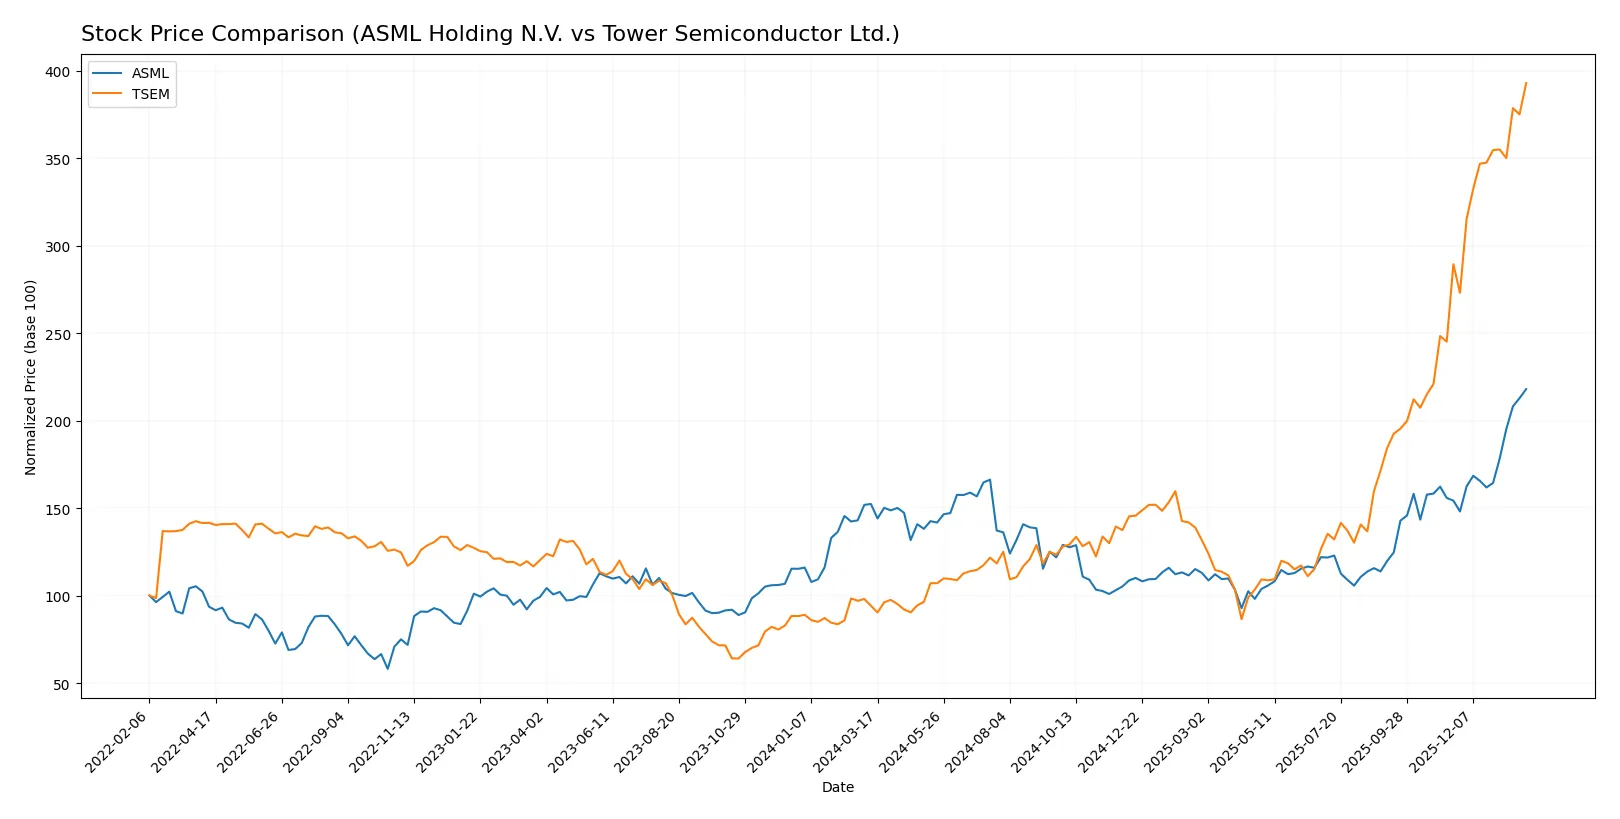
Trend Comparison
ASML Holding N.V. recorded a 43.11% price increase over the past year, signaling a bullish trend with accelerating momentum and a high price peak at 1423.0.
Tower Semiconductor Ltd. surged 316.99%, also bullish with acceleration, reaching a high of 134.73, but with much lower volatility compared to ASML.
Tower Semiconductor’s stock outperformed ASML, delivering the highest market return and stronger buyer dominance throughout the analyzed period.
Target Prices
Analysts project a mixed but generally positive outlook for ASML Holding N.V. and Tower Semiconductor Ltd.
| Company | Target Low | Target High | Consensus |
|---|---|---|---|
| ASML Holding N.V. | 1150 | 1911 | 1458.5 |
| Tower Semiconductor Ltd. | 66 | 125 | 96 |
The ASML consensus target of 1458.5 is slightly above its current price of 1423, indicating modest upside potential. Tower Semiconductor’s consensus target of 96 trails its current price of 134.73, suggesting market optimism may exceed analyst expectations.

Don’t Let Luck Decide Your Entry Point
Optimize your entry points with our advanced ProRealTime indicators. You’ll get efficient buy signals with precise price targets for maximum performance. Start outperforming now!
How do institutions grade them?
ASML Holding N.V. Grades
The latest institutional grades for ASML Holding N.V. are summarized in the table below.
| Grading Company | Action | New Grade | Date |
|---|---|---|---|
| Barclays | Upgrade | Overweight | 2026-01-29 |
| Wells Fargo | Maintain | Overweight | 2026-01-29 |
| RBC Capital | Maintain | Outperform | 2026-01-29 |
| Bernstein | Maintain | Outperform | 2026-01-22 |
| KGI Securities | Upgrade | Outperform | 2026-01-15 |
| Wells Fargo | Maintain | Overweight | 2026-01-15 |
| JP Morgan | Maintain | Overweight | 2026-01-14 |
| Bernstein | Upgrade | Outperform | 2026-01-05 |
| B of A Securities | Maintain | Buy | 2025-12-03 |
| JP Morgan | Maintain | Overweight | 2025-12-01 |
Tower Semiconductor Ltd. Grades
The latest institutional grades for Tower Semiconductor Ltd. are summarized in the table below.
| Grading Company | Action | New Grade | Date |
|---|---|---|---|
| Benchmark | Maintain | Buy | 2026-01-09 |
| Wedbush | Downgrade | Neutral | 2025-12-31 |
| Benchmark | Maintain | Buy | 2025-11-11 |
| Susquehanna | Maintain | Positive | 2025-11-11 |
| Wedbush | Maintain | Outperform | 2025-11-11 |
| Barclays | Maintain | Equal Weight | 2025-11-11 |
| Benchmark | Maintain | Buy | 2025-09-08 |
| Susquehanna | Maintain | Positive | 2025-08-05 |
| Benchmark | Maintain | Buy | 2025-08-05 |
| Benchmark | Maintain | Buy | 2025-08-04 |
Which company has the best grades?
ASML Holding N.V. consistently receives higher grades, including multiple Outperform and Overweight ratings. Tower Semiconductor Ltd. shows mixed grades with downgrades and neutral ratings. ASML’s stronger grades may signal better institutional confidence and impact investor sentiment positively.
Risks specific to each company
In 2026’s complex market environment, these categories expose the critical pressure points and systemic threats facing ASML Holding N.V. and Tower Semiconductor Ltd.:
1. Market & Competition
ASML Holding N.V.
- Dominates advanced lithography niche with high entry barriers but faces tech disruption risks.
Tower Semiconductor Ltd.
- Competes in analog and mixed-signal foundry space with intense pricing pressure and smaller scale.
2. Capital Structure & Debt
ASML Holding N.V.
- Low debt-to-equity (0.14) and strong interest coverage signal financial stability.
Tower Semiconductor Ltd.
- Also low leverage (0.07), but high current ratio (6.18) suggests inefficient capital use.
3. Stock Volatility
ASML Holding N.V.
- Beta at 1.34 indicates higher volatility, reflecting sensitivity to semiconductor cycles.
Tower Semiconductor Ltd.
- Lower beta of 0.88 shows relative stability, less sensitive to market swings.
4. Regulatory & Legal
ASML Holding N.V.
- Exposed to export controls impacting high-tech equipment sales, especially to China.
Tower Semiconductor Ltd.
- Faces regulatory scrutiny in multiple jurisdictions but less impacted by export bans.
5. Supply Chain & Operations
ASML Holding N.V.
- Complex global supply chain for rare components, vulnerable to geopolitical disruptions.
Tower Semiconductor Ltd.
- More diversified manufacturing footprint but smaller scale limits bargaining power.
6. ESG & Climate Transition
ASML Holding N.V.
- High energy consumption in manufacturing; strong ESG initiatives underway.
Tower Semiconductor Ltd.
- Moderate ESG risks; sustainability still evolving in foundry operations.
7. Geopolitical Exposure
ASML Holding N.V.
- Significant exposure to Asia-Pacific tensions affecting sales and supply chains.
Tower Semiconductor Ltd.
- Israeli base adds Middle East geopolitical risk but diversified client base partly offsets.
Which company shows a better risk-adjusted profile?
ASML’s most impactful risk is geopolitical exposure and export control constraints, which could throttle its growth despite strong market dominance. Tower Semiconductor’s key risk lies in intense competition and pricing pressure in a commoditized foundry sector. ASML’s superior financial health and operational scale grant it a better risk-adjusted profile. Its Altman Z-score of 12.4 and Piotroski score of 8 demonstrate robust financial resilience. Meanwhile, Tower’s strong Altman Z-score of 22.7 contrasts with a weaker ROE and pricing challenges, indicating cautious optimism but heightened business risks.
Final Verdict: Which stock to choose?
ASML’s superpower lies in its durable competitive advantage supported by a soaring ROIC well above WACC. It consistently generates robust cash flows and commands pricing power in a high-barrier tech sector. A point of vigilance remains its premium valuation, which could pressure returns if growth slows. ASML fits an Aggressive Growth portfolio seeking market leadership.
Tower Semiconductor’s strategic moat centers on its niche manufacturing capabilities and strong balance sheet liquidity, providing safety amid industry volatility. While its profitability metrics trail ASML, TSEM offers a more conservative risk profile and potential for operational improvement. It suits a GARP portfolio balancing reasonable valuation with growth prospects.
If you prioritize durable economic moats and commanding market positions, ASML outshines due to its proven value creation and growth trajectory. However, if you seek better stability and liquidity with modest growth, Tower Semiconductor offers a safer analytical scenario despite a less dominant moat. Both appeal to distinct investor profiles navigating the semiconductor landscape.
Disclaimer: Investment carries a risk of loss of initial capital. The past performance is not a reliable indicator of future results. Be sure to understand risks before making an investment decision.
Go Further
I encourage you to read the complete analyses of ASML Holding N.V. and Tower Semiconductor Ltd. to enhance your investment decisions: