Home > Comparison > Technology > ASML vs TXN
The strategic rivalry between ASML Holding N.V. and Texas Instruments Incorporated defines the current trajectory of the semiconductor industry. ASML operates as a capital-intensive pioneer in advanced lithography equipment, while Texas Instruments excels as a diversified analog and embedded processing manufacturer. This head-to-head reflects a contest between cutting-edge manufacturing innovation and broad-based semiconductor product leadership. This analysis aims to identify which path delivers superior risk-adjusted returns for a diversified technology portfolio.
Table of contents
Companies Overview
ASML Holding N.V. and Texas Instruments Incorporated dominate key niches within the semiconductor industry, shaping global technology supply chains.
ASML Holding N.V.: Advanced Semiconductor Equipment Leader
ASML stands as the leading provider of lithography systems essential for semiconductor manufacturing. Its revenue hinges on supplying extreme ultraviolet and deep ultraviolet lithography machines, critical for producing advanced chip nodes. In 2026, ASML focuses strategically on expanding its metrology and inspection systems to enhance chip yield and precision.
Texas Instruments Incorporated: Analog and Embedded Processing Powerhouse
Texas Instruments commands a strong position in the analog and embedded semiconductor markets. It generates revenue through power management and signal chain products, alongside microcontrollers and digital signal processors. Its 2026 strategy emphasizes broadening product applications across industrial, automotive, and personal electronics sectors.
Strategic Collision: Similarities & Divergences
ASML pursues a highly specialized, capital-intensive model centered on cutting-edge manufacturing equipment, while Texas Instruments adopts a diversified, volume-driven approach in analog and embedded solutions. They primarily compete on semiconductor innovation but target different value chain segments. ASML offers a unique technological moat; Texas Instruments provides steady cash flow with broad market penetration.
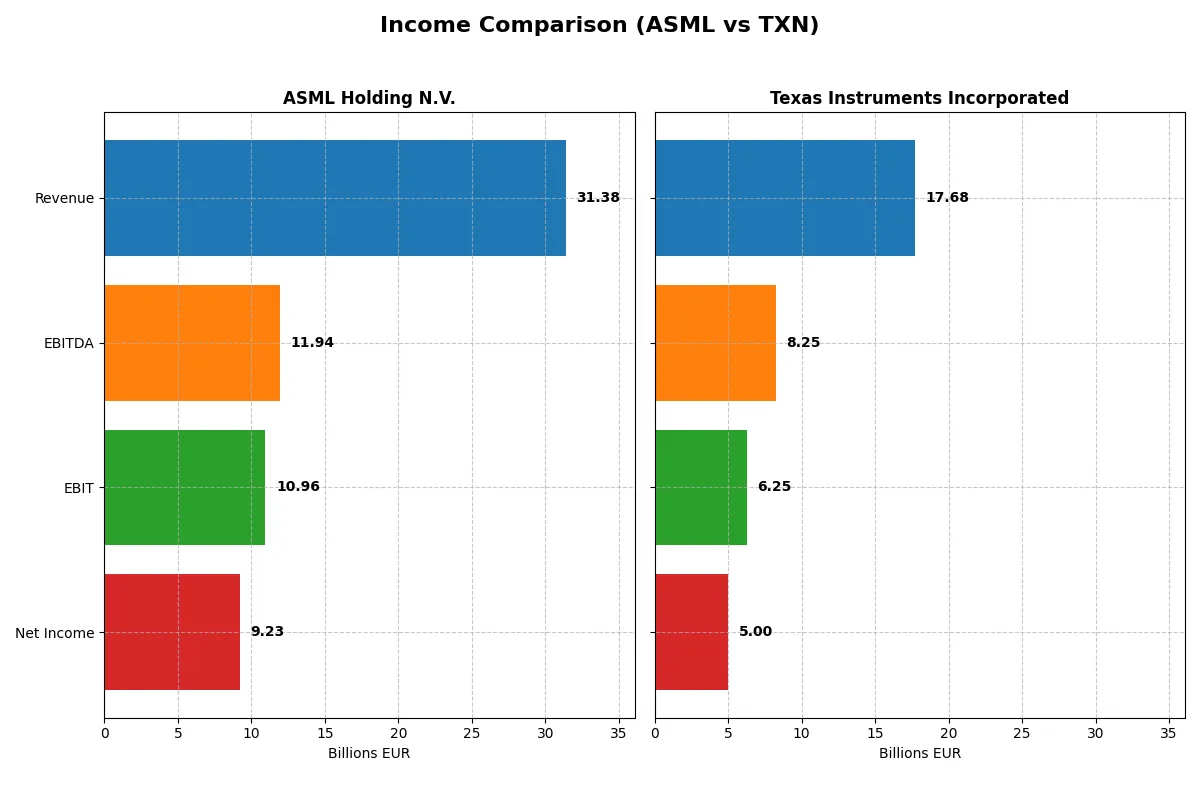
Income Statement Comparison
This data dissects the core profitability and scalability of both corporate engines to reveal who dominates the bottom line:
| Metric | ASML Holding N.V. (ASML) | Texas Instruments Inc. (TXN) |
|---|---|---|
| Revenue | 31.4B EUR | 17.7B USD |
| Cost of Revenue | 14.8B EUR | 7.6B USD |
| Operating Expenses | 5.7B EUR | 4.1B USD |
| Gross Profit | 16.6B EUR | 10.1B USD |
| EBITDA | 11.9B EUR | 8.3B USD |
| EBIT | 11.0B EUR | 6.3B USD |
| Interest Expense | 0 | 543M USD |
| Net Income | 9.2B EUR | 5.0B USD |
| EPS | 23.76 EUR | 5.45 USD |
| Fiscal Year | 2025 | 2025 |
Income Statement Analysis: The Bottom-Line Duel
This comparison will reveal which company runs its financial engine with greater efficiency and sustained profitability over recent years.
ASML Holding N.V. Analysis
ASML’s revenue climbs steadily, hitting €31.4B in 2025, up 11% year-over-year. Net income rises to €9.2B, reflecting strong operational momentum. Gross margin remains robust at 52.8%, and net margin holds a healthy 29.4%. The company’s disciplined expense management fuels a 19% EBIT growth, underscoring efficiency gains and consistent margin strength.
Texas Instruments Incorporated Analysis
Texas Instruments posts $17.7B revenue in 2025, growing 13% from the prior year but below its 2021 peak. Net income contracts to $5.0B, pressured by a net margin decline to 28.3%. Gross margin stands at 57%, higher than ASML’s, but EBIT growth stalls at 4.9%. Rising interest expenses and uneven net margin trends highlight operational challenges despite solid revenue gains.
Margin Power vs. Revenue Scale
ASML outpaces Texas Instruments with superior net income growth (57% vs. -36% over five years) and stronger margin expansion. While TXN boasts higher gross margins, ASML’s scalable revenue growth and margin improvements create a clearer fundamental advantage. Investors seeking consistent profit growth may find ASML’s profile more compelling.
Financial Ratios Comparison
These vital ratios act as a diagnostic tool to expose the underlying fiscal health, valuation premiums, and capital efficiency of the companies compared below:
| Ratios | ASML Holding N.V. (ASML) | Texas Instruments Inc. (TXN) |
|---|---|---|
| ROE | 47.1% | 30.7% |
| ROIC | 34.1% | 16.5% |
| P/E | 38.3 | 31.5 |
| P/B | 18.0 | 9.7 |
| Current Ratio | 1.26 | 4.35 |
| Quick Ratio | 0.79 | 2.83 |
| D/E | 0.14 | 0.86 |
| Debt-to-Assets | 5.4% | 40.6% |
| Interest Coverage | N/A | 11.1 |
| Asset Turnover | 0.62 | 0.51 |
| Fixed Asset Turnover | 3.81 | 1.44 |
| Payout Ratio | 26.5% | 100% |
| Dividend Yield | 0.69% | 3.17% |
| Fiscal Year | 2025 | 2025 |
Efficiency & Valuation Duel: The Vital Signs
Financial ratios serve as a company’s DNA, uncovering hidden risks and operational strengths that shape investment outcomes.
ASML Holding N.V.
ASML impresses with a robust 47.08% ROE and a strong 29.42% net margin, signaling high profitability. The valuation is stretched, with a P/E of 38.33 and P/B of 18.05. Shareholders receive a modest 0.69% dividend yield, while significant R&D investment underpins future growth.
Texas Instruments Incorporated
Texas Instruments posts solid profitability with a 30.73% ROE and 28.28% net margin. Its valuation, though high (P/E 31.53, P/B 9.69), appears less stretched than ASML’s. TI offers a healthy 3.17% dividend yield, balancing shareholder returns with steady operational efficiency.
Premium Valuation vs. Operational Safety
ASML commands a premium valuation justified by exceptional returns but carries greater valuation risk. Texas Instruments delivers a better dividend yield and lower leverage, providing a safer risk-reward profile. Growth-oriented investors may prefer ASML; income-focused ones might lean toward Texas Instruments.
Which one offers the Superior Shareholder Reward?
I compare ASML Holding N.V. and Texas Instruments on dividends, payout ratios, and buybacks. ASML yields 0.97% with a 34% payout ratio, supported by robust free cash flow coverage (~3x). Texas Instruments offers a 3.17% yield but nearly 100% payout ratio, straining sustainability. Buybacks favor ASML’s steady capital allocation, enhancing long-term value. I find ASML’s balanced distribution model more sustainable and attractive for total returns in 2026.
Comparative Score Analysis: The Strategic Profile
The radar chart exposes the core DNA and strategic trade-offs of ASML Holding N.V. and Texas Instruments Incorporated:
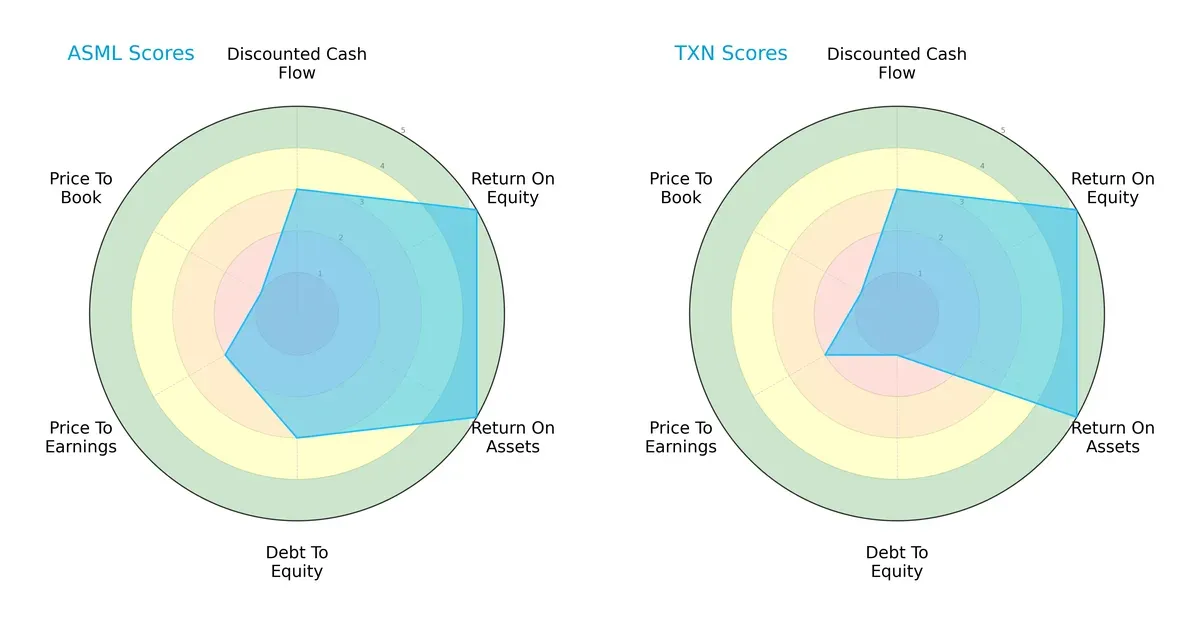
Both firms demonstrate strong operational efficiency with top-tier ROE and ROA scores of 5. ASML balances this with moderate debt management (Debt/Equity score 3), while Texas Instruments shows higher financial risk (score 1). Valuation metrics reveal challenges; both exhibit unfavorable P/E (2) and very unfavorable P/B (1) scores. ASML’s profile is more balanced, leveraging steadier leverage control, whereas Texas Instruments relies heavily on operational excellence despite elevated financial risk.
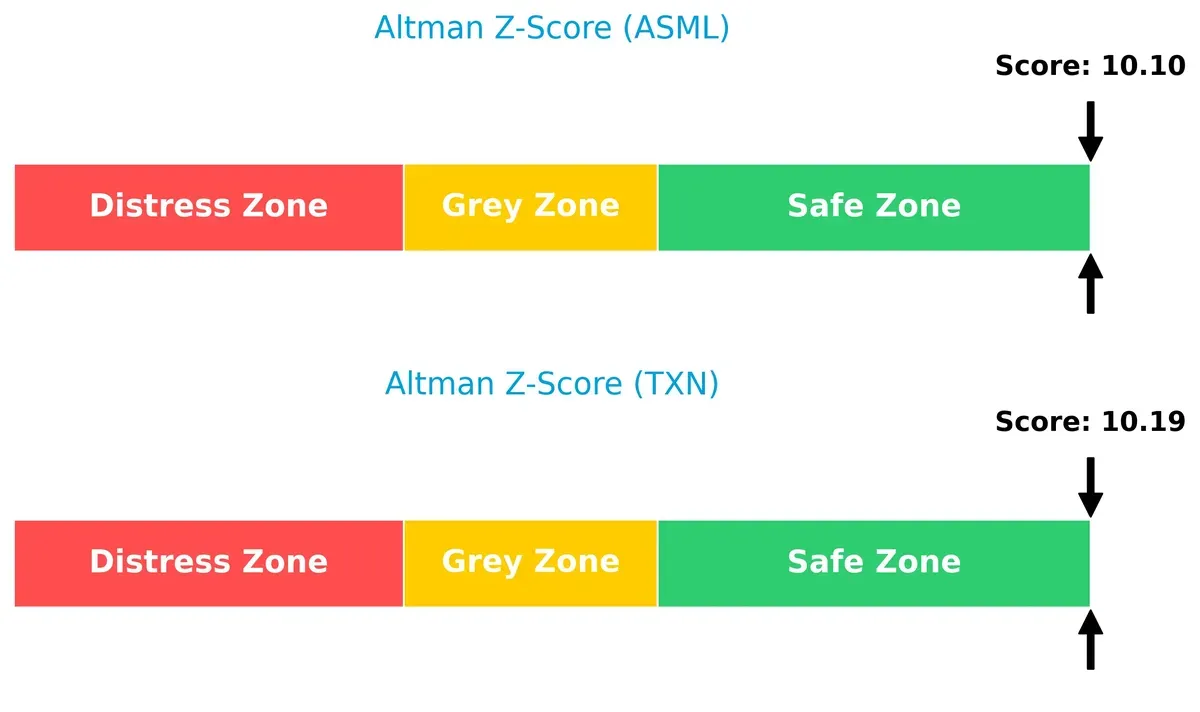
Bankruptcy Risk: Solvency Showdown
ASML’s Altman Z-Score of 10.1 and Texas Instruments’ 10.2 place both deep in the safe zone, indicating minimal bankruptcy risk and robust long-term survival prospects in this cycle:
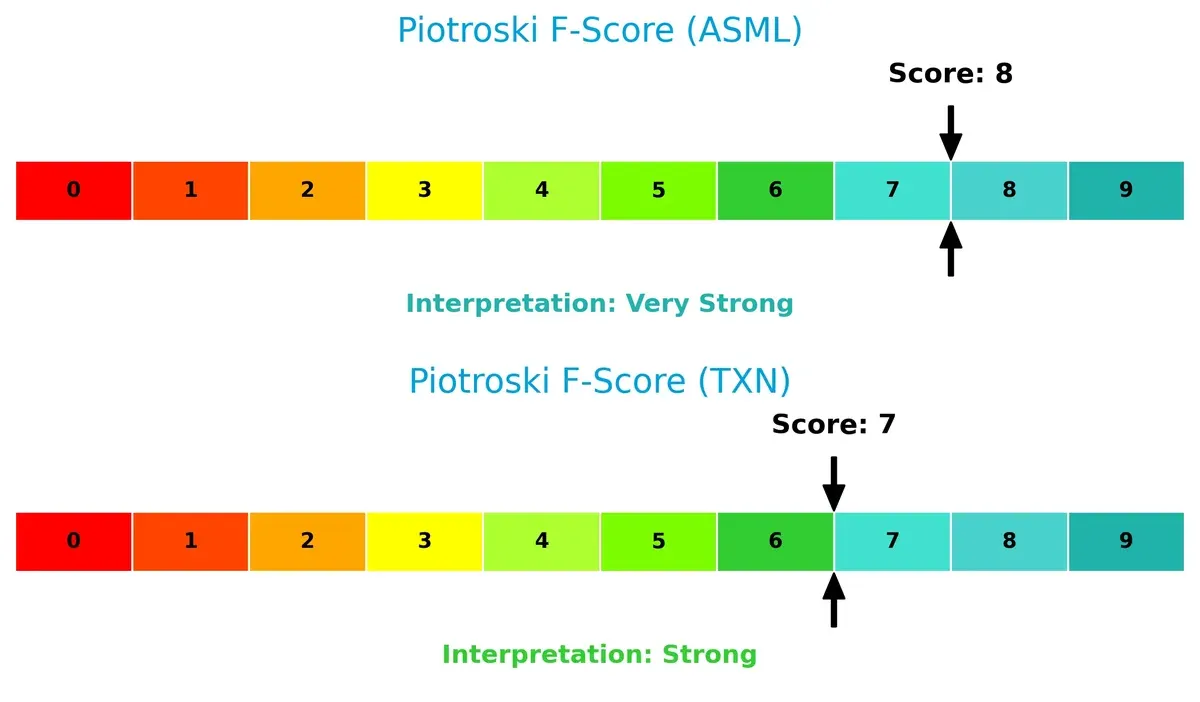
Financial Health: Quality of Operations
ASML scores an 8 on the Piotroski F-Score, signaling very strong financial health. Texas Instruments follows closely with a 7, indicating strong but slightly less robust internal metrics:
How are the two companies positioned?
This section dissects the operational DNA of ASML and TXN by comparing their revenue distribution and internal dynamics, including strengths and weaknesses. The goal is to confront their economic moats and identify which model offers the most resilient, sustainable competitive advantage today.
Revenue Segmentation: The Strategic Mix
This visual comparison dissects how ASML Holding N.V. and Texas Instruments Incorporated diversify their income streams and where their primary sector bets lie:
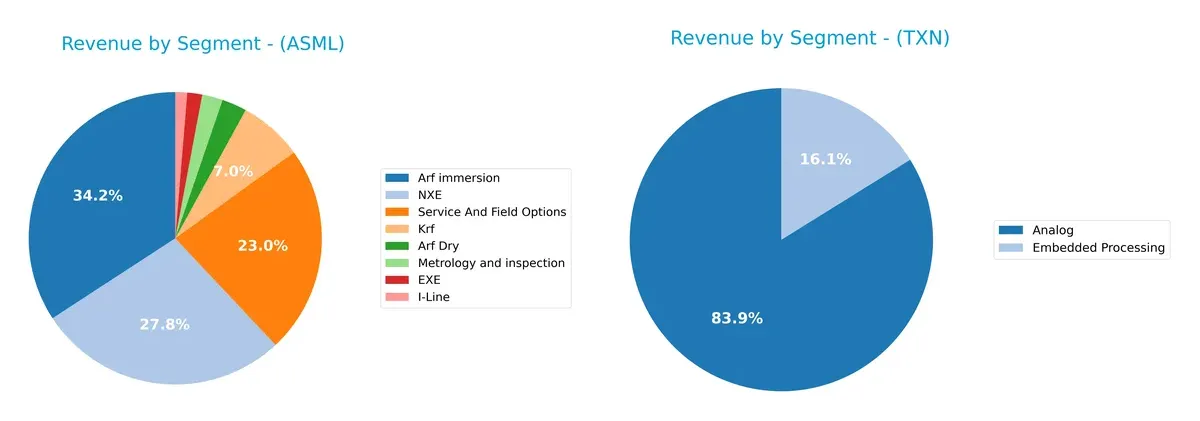
ASML’s revenue pivots around its Arf immersion (€9.67B) and NXE (€7.86B) segments, anchored by Service and Field Options (€6.49B). Texas Instruments dwarfs ASML in Analog sales ($14B), which dominates its revenue, complemented by Embedded Processing ($2.7B). ASML’s diversified portfolio reduces concentration risk, leveraging advanced lithography ecosystems. In contrast, Texas Instruments relies heavily on Analog, exposing it to market cyclicality but benefiting from infrastructure dominance.
Strengths and Weaknesses Comparison
This table compares the Strengths and Weaknesses of ASML Holding N.V. and Texas Instruments Incorporated:
ASML Strengths
- High ROE at 47.08% and ROIC at 34.14% indicating strong profitability
- Low debt-to-assets at 5.36% with excellent interest coverage
- Diverse product lines including advanced lithography and metrology
- Significant revenue from key Asian markets, especially China and Taiwan
TXN Strengths
- Solid net margin of 28.28% with favorable ROE at 30.73%
- Strong quick ratio at 2.83 indicating good liquidity
- Broad geographic presence including strong US and EMEA sales
- Diverse segments with dominant Analog revenue and embedded processing
ASML Weaknesses
- Elevated WACC at 10.62% and high valuation multiples (PE 38.33, PB 18.05) may pressure returns
- Quick ratio below 1 at 0.79 signals liquidity risk
- Dividend yield is low at 0.69%, less attractive for income investors
TXN Weaknesses
- High debt-to-equity at 0.86 and considerable debt-to-assets at 40.62%
- Current ratio very high at 4.35, possibly indicating inefficient asset use
- PE and PB still unfavorable, though better than ASML
Overall, ASML excels in profitability and low leverage but faces valuation and liquidity concerns. TXN shows balanced profitability with stronger liquidity but higher leverage. These contrasting profiles suggest different strategic trade-offs between growth investment and financial structure.
The Moat Duel: Analyzing Competitive Defensibility
A structural moat alone preserves long-term profits from relentless competitive pressure and market erosion. Here is how ASML and Texas Instruments defend their turf:
ASML Holding N.V.: Technological Leadership and Intellectual Property Fortress
ASML’s moat rests on intangible assets and cutting-edge EUV lithography technology. Its 23.5% ROIC spread over WACC and growing profitability confirm strong value creation. New product advances in 2026 should deepen this lead.
Texas Instruments Incorporated: Cost Advantage and Analog Market Prowess
Texas Instruments leverages cost advantages and diversified analog products. Though it maintains positive ROIC above WACC at 8.4%, its declining ROIC trend signals margin pressure. Expansion into industrial and automotive sectors offers growth potential but risks margin dilution.
Moat Battle: Technological Innovation vs. Cost Leadership
ASML’s wider and deepening moat outpaces Texas Instruments’ cost-based advantage and shrinking profitability. I see ASML better positioned to defend and grow market share amid intensifying semiconductor complexity.
Which stock offers better returns?
Both ASML Holding N.V. and Texas Instruments Incorporated have shown strong price appreciation over the past year, with distinct dynamics in price growth and trading volume dominance.
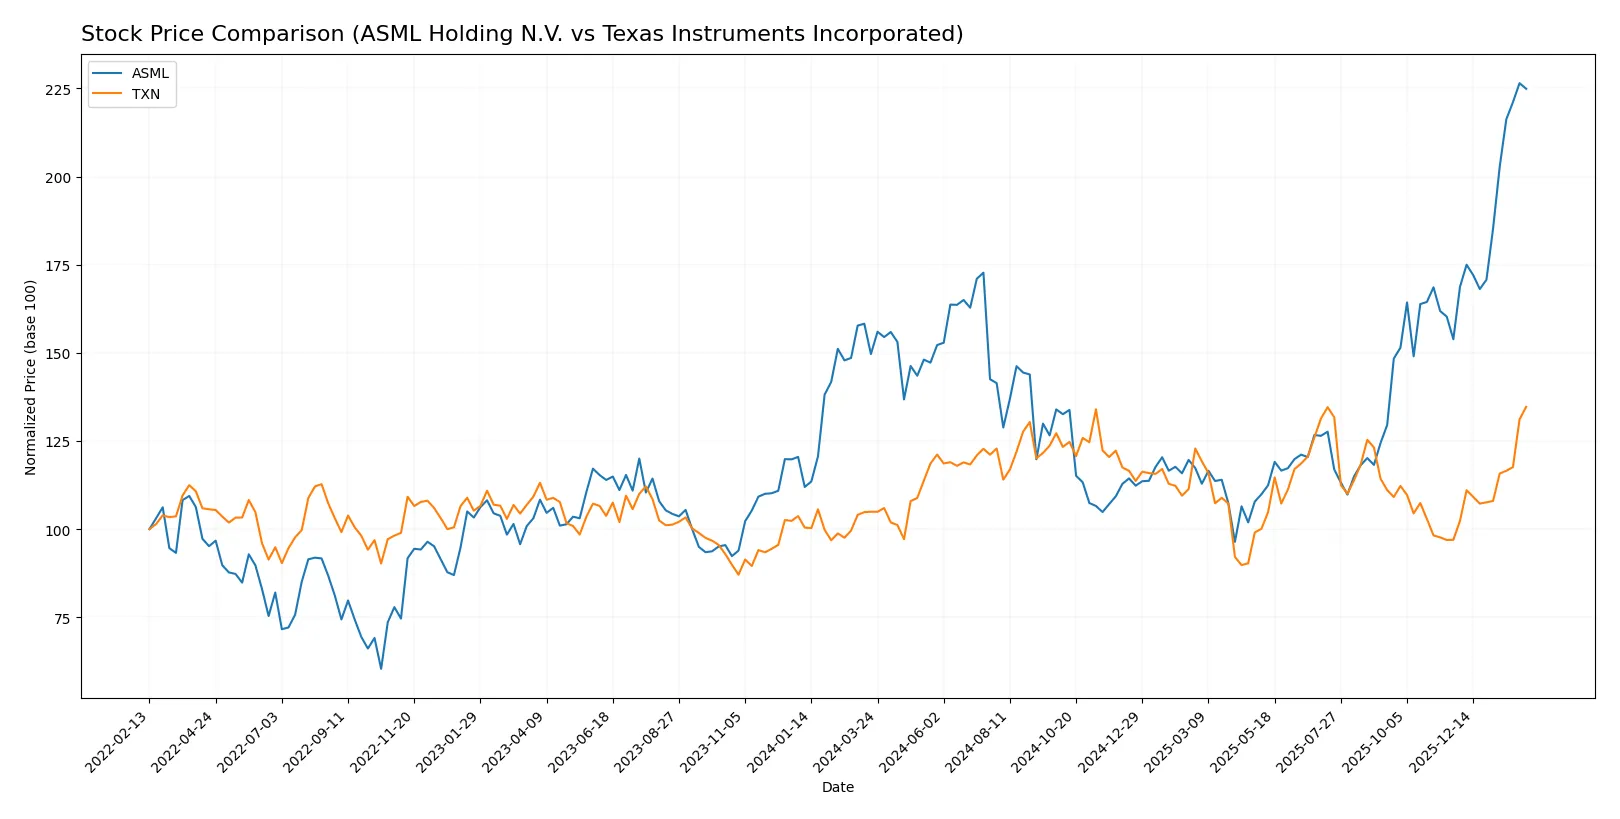
Trend Comparison
ASML Holding N.V. exhibits a bullish trend with a 50.29% price increase over 12 months, showing acceleration and a high volatility level with a 178.25 standard deviation. The stock reached a high of 1423.0 and a low of 605.55.
Texas Instruments Incorporated also trends bullish, rising 28.36% over the same period with accelerating momentum. Its volatility is significantly lower, with a standard deviation of 16.2, and price ranged between 147.6 and 221.44.
Comparing both, ASML delivers the highest market return with more volatile but accelerating price gains, outperforming Texas Instruments in total price appreciation.
Target Prices
Analysts present a broad but constructive target range for ASML Holding N.V. and Texas Instruments Incorporated.
| Company | Target Low | Target High | Consensus |
|---|---|---|---|
| ASML Holding N.V. | 1150 | 1911 | 1458.5 |
| Texas Instruments Incorporated | 160 | 260 | 204.64 |
ASML’s consensus target of 1458.5 sits slightly above its current price of 1413, signaling modest upside potential. Texas Instruments’ target consensus at 204.64 is below today’s 221.44 price, suggesting limited near-term appreciation.

Don’t Let Luck Decide Your Entry Point
Optimize your entry points with our advanced ProRealTime indicators. You’ll get efficient buy signals with precise price targets for maximum performance. Start outperforming now!
How do institutions grade them?
ASML Holding N.V. Grades
The following table summarizes recent institutional grades for ASML Holding N.V.:
| Grading Company | Action | New Grade | Date |
|---|---|---|---|
| Barclays | Buy | Overweight | 2026-01-29 |
| Wells Fargo | Buy | Overweight | 2026-01-29 |
| RBC Capital | Buy | Outperform | 2026-01-29 |
| Bernstein | Buy | Outperform | 2026-01-22 |
| Wells Fargo | Buy | Overweight | 2026-01-15 |
| KGI Securities | Buy | Outperform | 2026-01-15 |
| JP Morgan | Buy | Overweight | 2026-01-14 |
| Bernstein | Buy | Outperform | 2026-01-05 |
| B of A Securities | Buy | Buy | 2025-12-03 |
| JP Morgan | Buy | Overweight | 2025-12-01 |
Texas Instruments Incorporated Grades
The following table summarizes recent institutional grades for Texas Instruments Incorporated:
| Grading Company | Action | New Grade | Date |
|---|---|---|---|
| Rosenblatt | Buy | Buy | 2026-02-05 |
| JP Morgan | Buy | Overweight | 2026-01-28 |
| Cantor Fitzgerald | Hold | Neutral | 2026-01-28 |
| Wells Fargo | Hold | Equal Weight | 2026-01-28 |
| Truist Securities | Hold | Hold | 2026-01-28 |
| Stifel | Hold | Hold | 2026-01-28 |
| UBS | Buy | Buy | 2026-01-28 |
| Mizuho | Sell | Underperform | 2026-01-28 |
| Jefferies | Hold | Hold | 2026-01-28 |
| Benchmark | Buy | Buy | 2026-01-28 |
Which company has the best grades?
ASML Holding N.V. consistently receives upgrades and maintains mostly “Buy,” “Overweight,” and “Outperform” ratings. Texas Instruments shows a wider grade range, including several “Hold” and an “Underperform.” ASML’s stronger grades may signal higher institutional confidence, potentially attracting more investor interest.
Risks specific to each company
The following categories identify critical pressure points and systemic threats facing ASML Holding N.V. and Texas Instruments Incorporated in the 2026 market environment:
1. Market & Competition
ASML Holding N.V.
- Dominates advanced lithography with high barriers but faces intense competition in EUV technology development.
Texas Instruments Incorporated
- Strong in analog and embedded processing but competes in commoditized markets with pricing pressure.
2. Capital Structure & Debt
ASML Holding N.V.
- Low debt-to-equity (0.14) and debt-to-assets (5.36%) indicate conservative leverage and financial stability.
Texas Instruments Incorporated
- Higher leverage (debt-to-equity 0.86, debt-to-assets 40.62%) raises financial risk despite solid interest coverage (11.52x).
3. Stock Volatility
ASML Holding N.V.
- Beta of 1.462 signals above-market volatility, reflecting sensitivity to tech cycles and innovation risks.
Texas Instruments Incorporated
- Beta near 1.0 indicates market-level volatility, suggesting a more stable share price relative to sector swings.
4. Regulatory & Legal
ASML Holding N.V.
- Subject to export controls and geopolitical tech restrictions due to critical semiconductor equipment.
Texas Instruments Incorporated
- Faces regulatory scrutiny in multiple end markets, but less exposed to export controls than ASML.
5. Supply Chain & Operations
ASML Holding N.V.
- Complex supply chain reliant on specialized components and global manufacturing hubs increases disruption risk.
Texas Instruments Incorporated
- More diversified supplier base and product lines mitigate operational risks but still vulnerable to raw material costs.
6. ESG & Climate Transition
ASML Holding N.V.
- Faces pressure to reduce carbon footprint in energy-intensive manufacturing and in supply chain emissions.
Texas Instruments Incorporated
- Moderate ESG risks, with opportunities in energy-efficient products and sustainable operations.
7. Geopolitical Exposure
ASML Holding N.V.
- High exposure to Asia and US-China tensions due to semiconductor equipment demand and export restrictions.
Texas Instruments Incorporated
- US-based operations reduce geopolitical risk, but global sales still subject to trade tensions and tariffs.
Which company shows a better risk-adjusted profile?
ASML’s biggest risk lies in geopolitical tensions and supply chain complexity, threatening its EUV leadership. Texas Instruments faces elevated financial leverage and competitive pricing pressures. I see Texas Instruments as having a slightly better risk-adjusted profile due to lower stock volatility and more conservative operational risks. ASML’s beta above 1.4 and tight regulatory environment warrant caution despite its technological moat.
Final Verdict: Which stock to choose?
ASML’s superpower lies in its commanding economic moat, demonstrated by a very favorable ROIC far exceeding its cost of capital. It consistently converts innovation into strong profitability and cash flow, powering its premium valuation. A point of vigilance is its stretched valuation multiples, which could pressure returns if growth slows. ASML suits an aggressive growth portfolio seeking market leadership in semiconductor lithography.
Texas Instruments offers a strategic moat built on steady recurring revenues and operational resilience. Its safety profile surpasses ASML’s with a robust liquidity position and stable dividend yield, appealing to investors prioritizing capital preservation. However, its declining ROIC trend signals caution on profitability sustainability. TXN fits a GARP (Growth at a Reasonable Price) portfolio blending income with moderate growth.
If you prioritize long-term innovation leadership and can tolerate valuation premiums, ASML outshines with superior value creation and accelerating momentum. However, if you seek better stability and income with a more moderate valuation, Texas Instruments offers a safer harbor despite its profitability challenges. Each stock aligns with distinct investor archetypes balancing growth ambitions and risk tolerance.
Disclaimer: Investment carries a risk of loss of initial capital. The past performance is not a reliable indicator of future results. Be sure to understand risks before making an investment decision.
Go Further
I encourage you to read the complete analyses of ASML Holding N.V. and Texas Instruments Incorporated to enhance your investment decisions: