Home > Comparison > Technology > ASML vs TER
The strategic rivalry between ASML Holding N.V. and Teradyne, Inc. shapes the semiconductor equipment landscape. ASML operates as a capital-intensive leader in advanced lithography systems, while Teradyne specializes in automated test equipment with a diversified industrial automation segment. This analysis pits ASML’s cutting-edge manufacturing tech against Teradyne’s broad testing solutions to identify which offers superior risk-adjusted returns for a balanced portfolio.
Table of contents
Companies Overview
ASML Holding N.V. and Teradyne, Inc. stand as titans in semiconductor equipment, shaping chip manufacturing’s future.
ASML Holding N.V.: The Lithography Powerhouse
ASML leads as a semiconductor equipment innovator, specializing in advanced lithography systems. Its core revenue derives from selling extreme ultraviolet and deep ultraviolet lithography solutions. In 2026, ASML’s strategic focus remains on refining lithography precision and expanding its global footprint in semiconductor manufacturing.
Teradyne, Inc.: The Test Equipment Specialist
Teradyne excels as a leading provider of automatic test equipment for semiconductors and electronics. It generates revenue through its semiconductor test platforms and industrial automation robotics. Teradyne’s 2026 strategy emphasizes expanding its industrial automation segment alongside enhancing wireless and system test technologies.
Strategic Collision: Similarities & Divergences
Both companies dominate semiconductor equipment but differ in focus: ASML drives lithography innovation, while Teradyne centers on testing and automation. They primarily compete in the semiconductor manufacturing supply chain yet serve distinct operational needs. ASML’s capital-intensive moat contrasts with Teradyne’s diversified test and automation portfolio, offering investors differentiated risk and growth profiles.
Income Statement Comparison
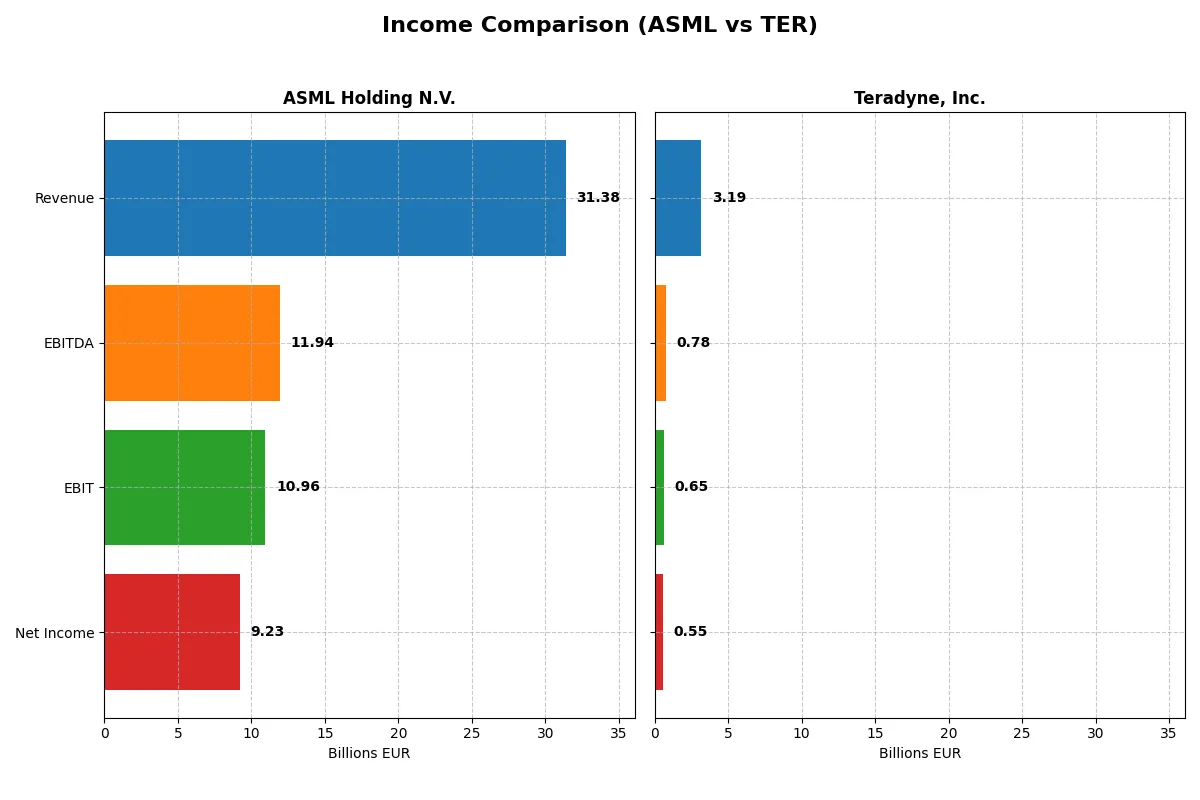
This data dissects the core profitability and scalability of both corporate engines to reveal who dominates the bottom line:
| Metric | ASML Holding N.V. (ASML) | Teradyne, Inc. (TER) |
|---|---|---|
| Revenue | 31.4B EUR | 3.19B USD |
| Cost of Revenue | 14.8B EUR | 1.32B USD |
| Operating Expenses | 5.72B EUR | 1.17B USD |
| Gross Profit | 16.6B EUR | 1.87B USD |
| EBITDA | 11.9B EUR | 780M USD |
| EBIT | 11.0B EUR | 653M USD |
| Interest Expense | 0 | 8.0M USD |
| Net Income | 9.23B EUR | 554M USD |
| EPS | 23.76 EUR | 3.49 USD |
| Fiscal Year | 2025 | 2025 |
Income Statement Analysis: The Bottom-Line Duel
This income statement comparison reveals the true efficiency of ASML Holding N.V. and Teradyne, Inc.’s corporate engines over recent years.
ASML Holding N.V. Analysis
ASML’s revenue climbed from €18.6B in 2021 to €31.4B in 2025, reflecting strong growth momentum. Net income surged 57% over five years, reaching €9.2B in 2025. The company maintains robust margins with a 52.8% gross margin and a 29.4% net margin in 2025, underscoring operational efficiency and sustained profitability.
Teradyne, Inc. Analysis
Teradyne’s revenue declined 14% over five years, hitting $3.2B in 2025, though it grew 13% year-over-year. Net income dropped 45% over the period, settling at $554M in 2025. Margins remain healthy with a 58.6% gross margin but a thinner 17.4% net margin, suggesting tighter cost control is needed to bolster bottom-line resilience.
Margin Strength vs. Growth Trajectory
ASML outpaces Teradyne with superior revenue growth and higher net margins, demonstrating greater scale and profitability. Teradyne shows solid gross margins but struggles with net income contraction and slower overall growth. For investors prioritizing robust earnings growth and margin stability, ASML’s profile offers a more compelling fundamental advantage.
Financial Ratios Comparison
These vital ratios act as a diagnostic tool to expose the underlying fiscal health, valuation premiums, and capital efficiency of each company:
| Ratios | ASML Holding N.V. (ASML) | Teradyne, Inc. (TER) |
|---|---|---|
| ROE | 47.1% | 19.8% |
| ROIC | 34.1% | 18.4% |
| P/E | 38.3x | 54.6x |
| P/B | 18.0x | 10.8x |
| Current Ratio | 1.26 | 1.76 |
| Quick Ratio | 0.79 | 1.41 |
| D/E (Debt-to-Equity) | 0.14 | 0.12 |
| Debt-to-Assets | 5.4% | 8.3% |
| Interest Coverage | N/A | 86.4x |
| Asset Turnover | 0.62 | 0.76 |
| Fixed Asset Turnover | 3.81 | 4.99 |
| Payout Ratio | 26.5% | 13.8% |
| Dividend Yield | 0.69% | 0.25% |
| Fiscal Year | 2025 | 2025 |
Efficiency & Valuation Duel: The Vital Signs
Financial ratios act as the company’s DNA, revealing hidden risks and operational excellence that shape investor decisions.
ASML Holding N.V.
ASML delivers exceptional profitability with a 47.1% ROE and a strong 29.4% net margin, signaling operational dominance. However, its P/E of 38.3 and P/B of 18.1 paint an expensive valuation. Dividend yield is low at 0.7%, reflecting a strategy focused on reinvestment in R&D for sustained growth.
Teradyne, Inc.
Teradyne shows solid but moderate profitability, with a 19.8% ROE and 17.4% net margin. The stock trades at a stretched P/E of 54.6 and P/B of 10.8, indicating high market expectations. Dividend yield of 0.25% is minimal, as the company prioritizes capital allocation towards innovation and operational efficiency.
Premium Valuation vs. Operational Safety
ASML balances superior profitability with a steep valuation, while Teradyne offers a more favorable liquidity profile but trades even higher on earnings. ASML’s strong returns and R&D focus suit growth-oriented investors. Teradyne appeals to those valuing operational safety amid elevated multiples.
Which one offers the Superior Shareholder Reward?
I see ASML Holding N.V. delivers a higher dividend yield around 0.97% with a payout ratio near 34%, well-covered by robust free cash flow of 27.4B EUR. Teradyne, Inc. pays a lower 0.25% yield with a 14% payout, favoring reinvestment and modest buybacks. ASML’s intense buyback program amplifies total returns, supported by strong cash flow and moderate leverage. Teradyne prioritizes growth through R&D and acquisitions, limiting buybacks but maintaining financial flexibility. Historically, ASML’s sustainable distribution and capital allocation provide a more attractive total return profile for 2026 investors seeking balanced income and growth.
Comparative Score Analysis: The Strategic Profile
The radar chart reveals the fundamental DNA and trade-offs of ASML Holding N.V. and Teradyne, Inc., highlighting their core financial strengths and valuation nuances:
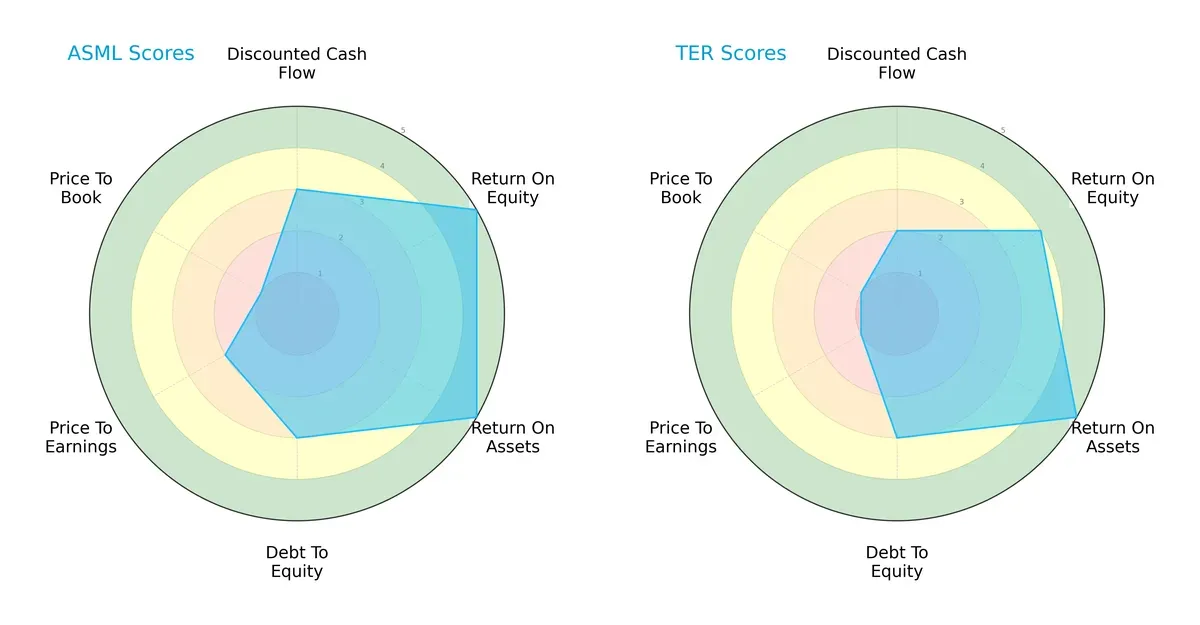
ASML shows a more balanced profile with very favorable ROE and ROA scores, signaling superior profitability and asset efficiency. Teradyne matches ASML’s ROA but lags slightly in ROE and DCF, relying more on operational efficiency than cash flow strength. Both maintain moderate debt levels, but ASML’s valuation scores suggest it trades at a premium compared to Teradyne, indicating potential overvaluation risks.
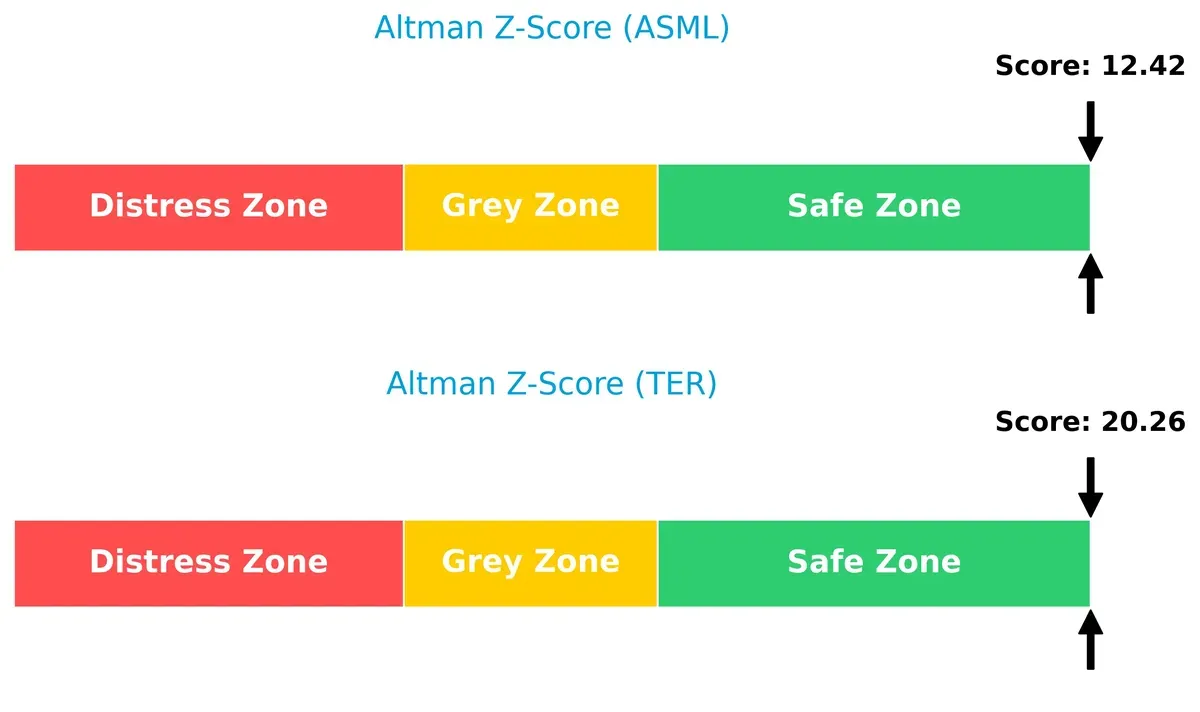
Bankruptcy Risk: Solvency Showdown
ASML’s Altman Z-Score of 12.4 versus Teradyne’s 20.3 signals both companies reside comfortably in the safe zone, with Teradyne exhibiting an even stronger buffer against bankruptcy risk in this cycle:
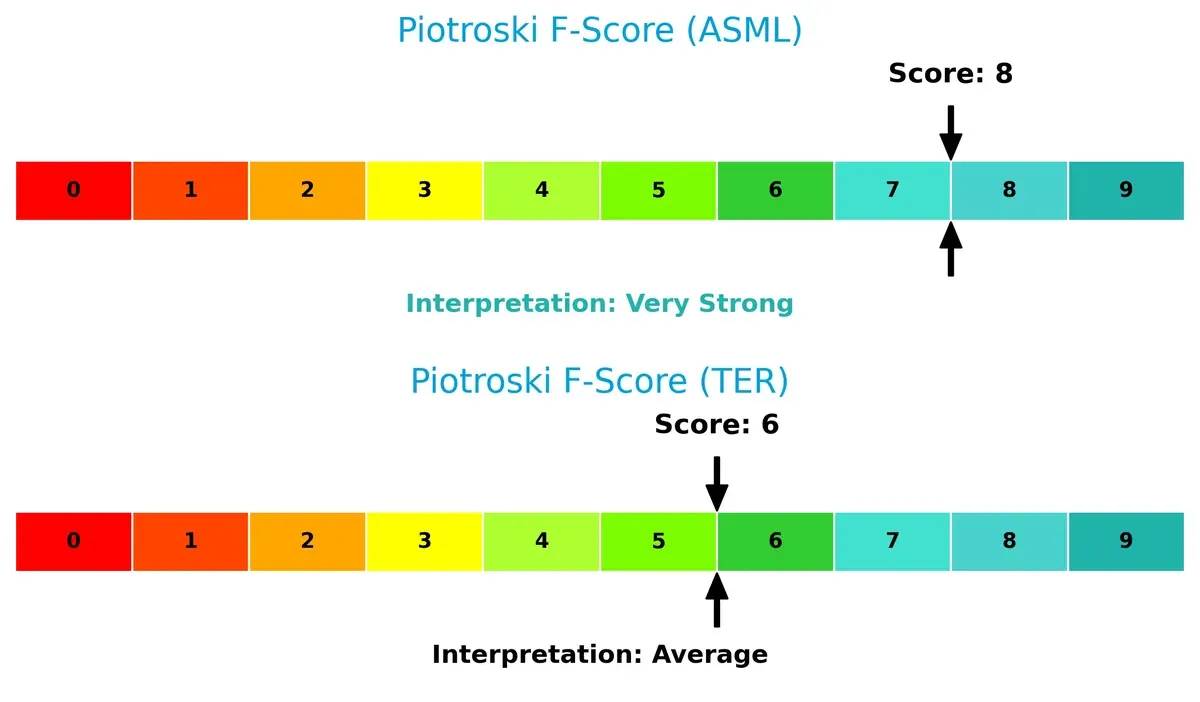
Financial Health: Quality of Operations
ASML scores an 8 on the Piotroski F-Score, indicating robust financial health with few red flags. Teradyne’s 6 suggests average quality, with room for improvement in internal metrics compared to ASML’s stronger operational execution:
How are the two companies positioned?
This section dissects ASML and Teradyne’s operational DNA by comparing their revenue distribution and internal strengths and weaknesses. The goal is to confront their economic moats and identify which model delivers the most resilient competitive advantage today.
Revenue Segmentation: The Strategic Mix
This visual comparison dissects how ASML Holding N.V. and Teradyne, Inc. diversify their income streams and where their primary sector bets lie:
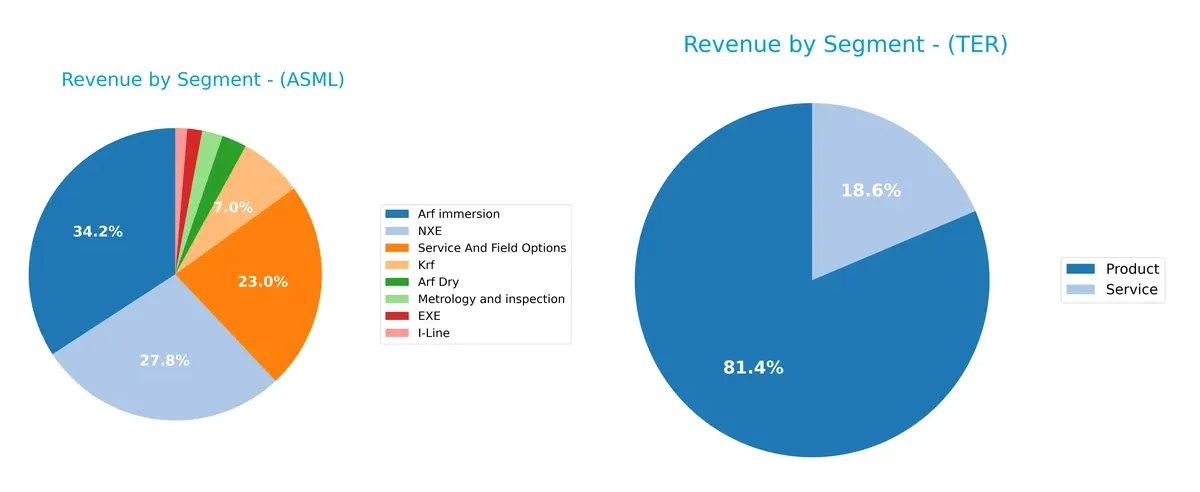
ASML pivots around its Arf immersion ($9.67B) and NXE ($7.86B) segments, with substantial contributions from Service and Field Options ($6.49B). Teradyne relies heavily on Product revenue ($2.29B) with a smaller Service segment ($525M). ASML’s diversified portfolio of lithography technologies reduces concentration risk and strengthens its infrastructure dominance. Teradyne’s narrower segmentation focuses on semiconductor testing, exposing it to more cyclical volatility but benefiting from specialization.
Strengths and Weaknesses Comparison
This table compares the strengths and weaknesses of ASML Holding N.V. and Teradyne, Inc. based on diversification, profitability, financial statement, innovation, global presence, and market share:
ASML Strengths
- High net margin at 29.42%
- Very strong ROE of 47.08%
- ROIC well above WACC at 34.14%
- Low debt to equity at 0.14
- Significant revenue from diverse product lines
- Broad global presence, especially strong in China
Teradyne Strengths
- Favorable net margin at 17.37%
- Solid ROE of 19.82%
- ROIC exceeds WACC at 18.45%
- Strong liquidity ratios (current 1.76, quick 1.41)
- Diversified revenue across product and service segments
- Global footprint including Taiwan and Korea
ASML Weaknesses
- High PE and PB ratios indicate premium valuation
- Quick ratio below 1 at 0.79 signals liquidity caution
- WACC at 10.68% is unfavorable
- Dividend yield low at 0.69%
- Asset turnover neutral at 0.62
- Exposure concentrated in Asia-Pacific
Teradyne Weaknesses
- Very high PE ratio at 54.64 signals expensive stock
- WACC at 12.35% is unfavorable
- Dividend yield low at 0.25%
- Moderate debt to assets at 8.32%
- Asset turnover neutral at 0.76
- Revenue less concentrated in China, more spread but smaller scale
ASML exhibits stronger profitability metrics and a more significant global presence, especially in key Asian markets, but carries valuation and liquidity risks. Teradyne shows favorable liquidity and diversified revenue streams but faces challenges with high valuation multiples and moderate financial leverage. These factors shape each company’s strategic positioning in their competitive sectors.
The Moat Duel: Analyzing Competitive Defensibility
A structural moat is the only reliable shield protecting long-term profits from relentless competitive erosion. Let’s dissect the moats of ASML and Teradyne:
ASML Holding N.V.: Dominant Intangible Asset Moat
ASML’s moat stems from its cutting-edge lithography technology and proprietary patents. This drives a high ROIC well above WACC, reflecting strong value creation and margin stability. Expansion into EUV and advanced nodes in 2026 should deepen this moat.
Teradyne, Inc.: Specialized Cost and Scale Advantage
Teradyne leverages automated test equipment and robotics with scale economies, but its ROIC, while positive, trails ASML’s and shows a declining trend. Market diversification in industrial automation offers growth, yet competitive pressures could thin its moat.
Verdict: Intangible Asset Leadership vs. Scale-Driven Efficiency
ASML’s intangible asset moat is deeper and more sustainable than Teradyne’s cost and scale advantage. ASML’s rising ROIC signals stronger defense of market share, making it better positioned to fend off competition through 2026.
Which stock offers better returns?
The past year saw ASML Holding N.V. and Teradyne, Inc. both display strong price gains, with notable acceleration and rising buyer dominance influencing their trading dynamics.
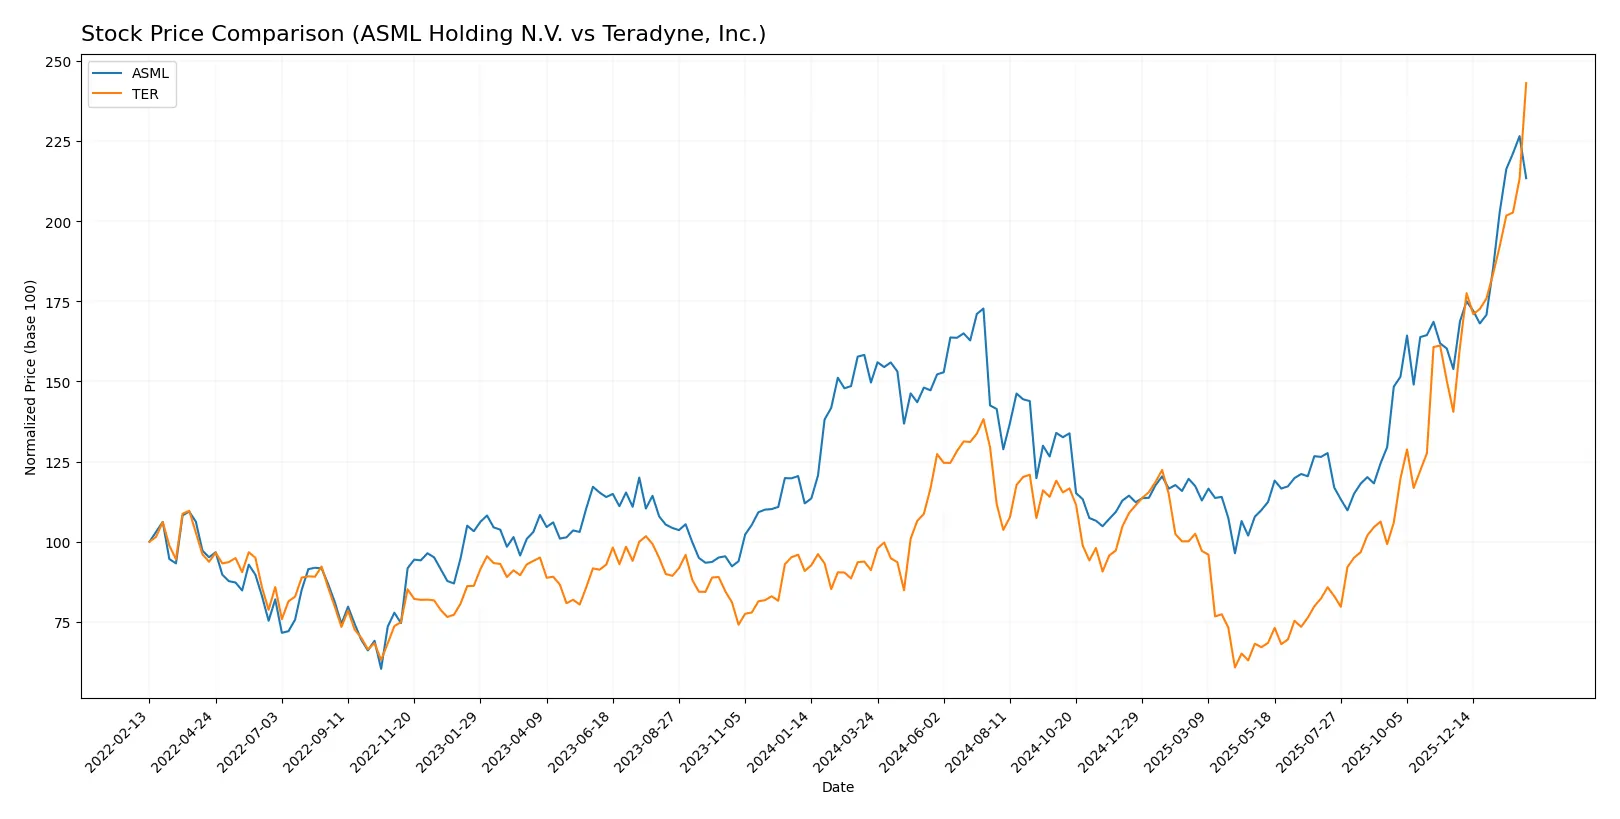
Trend Comparison
ASML’s stock price rose 42.58% over the past 12 months, showing a bullish trend with accelerating momentum. It reached a high of 1423.0 and a low of 605.55, reflecting significant volatility.
Teradyne’s stock surged 166.68% across the same period, also bullish with acceleration. It hit a low of 68.72 and a high of 274.84, exhibiting much lower volatility than ASML.
Teradyne delivered the highest market performance, outperforming ASML by a wide margin in percentage terms over the last year.
Target Prices
Analysts present a cautiously optimistic consensus for ASML Holding N.V. and Teradyne, Inc.
| Company | Target Low | Target High | Consensus |
|---|---|---|---|
| ASML Holding N.V. | 1150 | 1911 | 1458.5 |
| Teradyne, Inc. | 175 | 335 | 276.08 |
The consensus target for ASML exceeds its current price of 1336, signaling upside potential. Teradyne’s consensus target slightly surpasses its current price of 272, reflecting moderate growth expectations.

Don’t Let Luck Decide Your Entry Point
Optimize your entry points with our advanced ProRealTime indicators. You’ll get efficient buy signals with precise price targets for maximum performance. Start outperforming now!
How do institutions grade them?
ASML Holding N.V. Grades
Here are the recent grades assigned by reputable financial institutions to ASML Holding N.V.:
| Grading Company | Action | New Grade | Date |
|---|---|---|---|
| Barclays | Upgrade | Overweight | 2026-01-29 |
| Wells Fargo | Maintain | Overweight | 2026-01-29 |
| RBC Capital | Maintain | Outperform | 2026-01-29 |
| Bernstein | Maintain | Outperform | 2026-01-22 |
| KGI Securities | Upgrade | Outperform | 2026-01-15 |
| Wells Fargo | Maintain | Overweight | 2026-01-15 |
| JP Morgan | Maintain | Overweight | 2026-01-14 |
| Bernstein | Upgrade | Outperform | 2026-01-05 |
| B of A Securities | Maintain | Buy | 2025-12-03 |
| JP Morgan | Maintain | Overweight | 2025-12-01 |
Teradyne, Inc. Grades
Below are the latest institutional grades for Teradyne, Inc. from recognized grading firms:
| Grading Company | Action | New Grade | Date |
|---|---|---|---|
| Cantor Fitzgerald | Maintain | Overweight | 2026-02-04 |
| Goldman Sachs | Maintain | Buy | 2026-02-04 |
| Stifel | Maintain | Buy | 2026-02-04 |
| Evercore ISI Group | Maintain | Outperform | 2026-02-04 |
| Citigroup | Maintain | Buy | 2026-02-04 |
| Evercore ISI Group | Maintain | Outperform | 2026-02-03 |
| Cantor Fitzgerald | Maintain | Overweight | 2026-02-02 |
| Stifel | Maintain | Buy | 2026-01-30 |
| UBS | Maintain | Buy | 2026-01-26 |
| B of A Securities | Maintain | Buy | 2026-01-22 |
Which company has the best grades?
Both companies receive predominantly positive grades from top institutions. ASML shows a mix of Outperform and Overweight ratings with some recent upgrades. Teradyne maintains consistent Buy and Overweight ratings with no recent downgrades. Investors may view Teradyne’s stable Buy consensus as a sign of steady confidence, while ASML’s upgrades suggest growing optimism.
Risks specific to each company
The following categories identify the critical pressure points and systemic threats facing both firms in the 2026 market environment:
1. Market & Competition
ASML Holding N.V.
- Dominates advanced lithography equipment with high barriers to entry. Faces intensifying competition in semiconductor ecosystem.
Teradyne, Inc.
- Competes in test equipment and industrial automation; faces pressure from rapid tech evolution and diversified rivals.
2. Capital Structure & Debt
ASML Holding N.V.
- Low debt-to-equity ratio (0.14) signals conservative leverage. Strong interest coverage ratio (infinite) bolsters financial stability.
Teradyne, Inc.
- Low debt-to-equity (0.12) and robust interest coverage (81x) confirm solid debt management and ample liquidity.
3. Stock Volatility
ASML Holding N.V.
- Beta of 1.46 indicates moderate sensitivity to market swings, reflecting semiconductor cyclicality.
Teradyne, Inc.
- Higher beta of 1.82 suggests greater volatility and market risk exposure relative to peers.
4. Regulatory & Legal
ASML Holding N.V.
- Subject to export controls impacting sales in China; regulatory scrutiny on advanced tech exports remains a key risk.
Teradyne, Inc.
- Faces evolving regulations in automation and defense testing; compliance costs and geopolitical export controls are concerns.
5. Supply Chain & Operations
ASML Holding N.V.
- Complex global supply chain risks amid semiconductor shortages and geopolitical tensions in Asia-Pacific.
Teradyne, Inc.
- Supply chain diversified but exposed to component shortages and logistics disruptions impacting production schedules.
6. ESG & Climate Transition
ASML Holding N.V.
- Faces pressure to reduce carbon footprint in manufacturing and improve ESG disclosures to satisfy investors.
Teradyne, Inc.
- Increasing focus on energy efficiency in automation products; ESG initiatives advancing but still evolving.
7. Geopolitical Exposure
ASML Holding N.V.
- Significant exposure to China, Taiwan, and South Korea; geopolitical tensions pose disruption risks.
Teradyne, Inc.
- US-centric with global operations; geopolitical risks moderate but present due to defense segment and supply chain links.
Which company shows a better risk-adjusted profile?
ASML’s primary risk lies in geopolitical exposure and regulatory export constraints, which could disrupt its dominant market position. Teradyne faces higher stock volatility and competitive pressure but benefits from stronger liquidity and a more balanced capital structure. Teradyne’s favorable current and quick ratios signal better short-term resilience. However, ASML’s higher ROIC versus WACC confirms superior capital efficiency despite elevated valuation multiples. Overall, Teradyne offers a better risk-adjusted profile thanks to its financial flexibility and lower geopolitical concentration risk, despite ASML’s technological moat.
Final Verdict: Which stock to choose?
ASML’s superpower lies in its commanding moat fueled by a soaring ROIC well above its cost of capital. It excels at turning capital into profits with sustained growth and impressive operational efficiency. A point of vigilance is its stretched valuation multiples, which could pressure returns. It suits portfolios seeking long-term innovation-driven leadership.
Teradyne’s strategic moat revolves around solid operational cash flow and a resilient balance sheet. Its recurring revenue and robust liquidity offer a safer harbor relative to ASML’s more aggressive profile. While profitability growth shows signs of deceleration, Teradyne fits portfolios favoring steady growth with a margin of safety.
If you prioritize dominant innovation and high capital efficiency, ASML outshines with its sustainable competitive advantage and growth trajectory. However, if you seek better stability and liquidity with moderate growth expectations, Teradyne offers a more balanced risk profile. Both present compelling but distinct investment scenarios depending on your risk tolerance and growth ambitions.
Disclaimer: Investment carries a risk of loss of initial capital. The past performance is not a reliable indicator of future results. Be sure to understand risks before making an investment decision.
Go Further
I encourage you to read the complete analyses of ASML Holding N.V. and Teradyne, Inc. to enhance your investment decisions: