Home > Comparison > Technology > TSM vs ASML
The strategic rivalry between Taiwan Semiconductor Manufacturing Company Limited and ASML Holding N.V. shapes the semiconductor sector’s innovation frontier. TSMC operates as a capital-intensive wafer fabrication powerhouse, while ASML excels as a high-tech equipment supplier specializing in lithography systems. This head-to-head reflects a contest between manufacturing scale and advanced technology enablement. This analysis aims to determine which company offers a superior risk-adjusted return, guiding investors seeking diversified exposure to semiconductor leadership.
Table of contents
Companies Overview
Taiwan Semiconductor Manufacturing Company Limited and ASML Holding N.V. each hold pivotal roles in the global semiconductor industry.
Taiwan Semiconductor Manufacturing Company Limited: Leading Foundry Powerhouse
Taiwan Semiconductor Manufacturing Company Limited dominates the semiconductor foundry market by manufacturing and packaging integrated circuits worldwide. Its core revenue stems from advanced wafer fabrication processes for high-performance computing, smartphones, and automotive sectors. In 2026, the firm prioritizes expanding its technology leadership and capacity to meet booming demand across multiple geographies.
ASML Holding N.V.: Supreme Lithography Innovator
ASML Holding N.V. commands the advanced semiconductor equipment market, producing critical lithography systems that enable chipmakers to push technological boundaries. Its revenue relies heavily on sales and servicing of extreme ultraviolet lithography tools, metrology, and inspection systems. The company’s 2026 strategy centers on enhancing its technological edge and customer support to sustain dominance in cutting-edge chip production.
Strategic Collision: Similarities & Divergences
Both companies excel in semiconductor technology but diverge in their roles: Taiwan Semiconductor serves as a contract manufacturer, while ASML provides the essential manufacturing equipment backbone. Their competition converges on enabling next-generation chip capabilities, with TSMC scaling fabrication and ASML innovating lithography precision. Investors face distinct profiles: TSMC offers exposure to semiconductor production growth; ASML to advanced equipment innovation cycles.
Income Statement Comparison
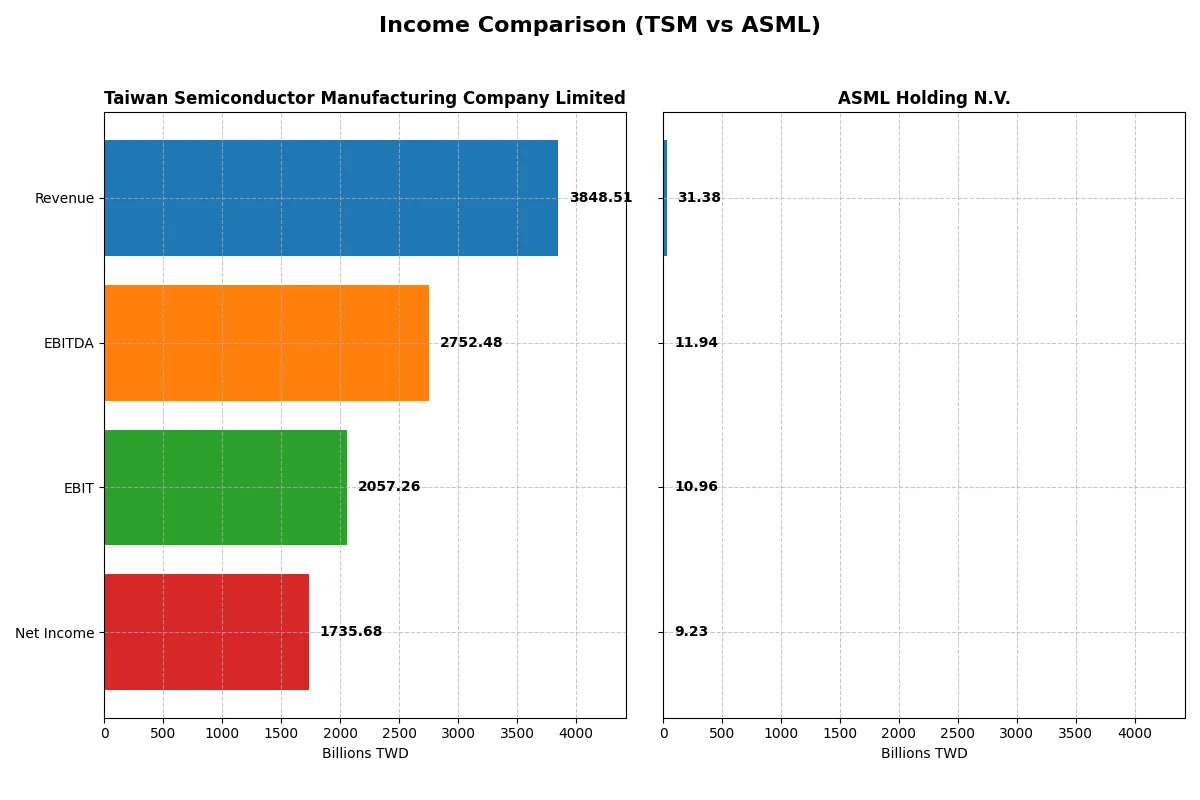
This data dissects the core profitability and scalability of both corporate engines to reveal who dominates the bottom line:
| Metric | Taiwan Semiconductor Manufacturing Company Limited (TSM) | ASML Holding N.V. (ASML) |
|---|---|---|
| Revenue | 3.85T TWD | 31.38B EUR |
| Cost of Revenue | 1.54T TWD | 14.80B EUR |
| Operating Expenses | 349B TWD | 5.72B EUR |
| Gross Profit | 2.30T TWD | 16.58B EUR |
| EBITDA | 2.75T TWD | 11.94B EUR |
| EBIT | 2.06T TWD | 10.96B EUR |
| Interest Expense | 0 | 0 |
| Net Income | 1.74T TWD | 0 |
| EPS | 334.6 TWD | 23.76 EUR |
| Fiscal Year | 2025 | 2025 |
Income Statement Analysis: The Bottom-Line Duel
The following income statement comparison reveals which company operates with superior efficiency and stronger profit momentum.
Taiwan Semiconductor Manufacturing Company Limited Analysis
TSM’s revenue surged from 1.59T TWD in 2021 to 3.85T TWD in 2025, nearly doubling its scale. Net income followed suit, climbing from 592B to 1.74T TWD, reflecting robust profit growth. Gross and net margins stand at a healthy 59.9% and 45.1%, respectively, highlighting exceptional cost control and operational efficiency in 2025.
ASML Holding N.V. Analysis
ASML’s revenue rose steadily from €18.6B in 2021 to €31.4B in 2025, demonstrating solid top-line expansion. Net income increased from €5.88B to €9.23B, but margins remain thinner, with a 52.8% gross margin and 29.4% net margin in 2025. Despite growth, net margin contracted slightly over the period, signaling margin pressure amid rising expenses.
Margin Dominance vs. Revenue Growth
TSM outpaces ASML with higher profitability and more aggressive net income growth, nearly tripling profits over five years. ASML grows steadily but sacrifices margin strength, reflecting a trade-off between scale and efficiency. For investors prioritizing margin resilience, TSM’s superior margin profile offers a clearer fundamental edge.
Financial Ratios Comparison
These vital ratios act as a diagnostic tool to expose the underlying fiscal health, valuation premiums, and capital efficiency of the companies compared below:
| Ratios | Taiwan Semiconductor Manufacturing Company Limited (TSM) | ASML Holding N.V. (ASML) |
|---|---|---|
| ROE | 32.1% | 47.1% |
| ROIC | 24.9% | 34.1% |
| P/E | 28.5 | 38.3 |
| P/B | 9.14 | 18.0 |
| Current Ratio | 2.62 | 1.26 |
| Quick Ratio | 2.42 | 0.79 |
| D/E (Debt-to-Equity) | 0.18 | 0.14 |
| Debt-to-Assets | 12.5% | 5.4% |
| Interest Coverage | 0 | 0 |
| Asset Turnover | 0.49 | 0.62 |
| Fixed Asset Turnover | 1.05 | 3.81 |
| Payout ratio | 27.2% | 26.5% |
| Dividend yield | 0.95% | 0.69% |
| Fiscal Year | 2025 | 2025 |
Efficiency & Valuation Duel: The Vital Signs
Financial ratios serve as a company’s DNA, uncovering hidden risks and operational strengths that drive long-term performance.
Taiwan Semiconductor Manufacturing Company Limited
TSMC displays robust profitability with a 32.12% ROE and a commanding 45.1% net margin, signaling operational excellence. However, its valuation appears stretched, with a high P/E of 28.45 and P/B of 9.14. Shareholder returns rely more on growth reinvestment through R&D than dividends, as dividend yield stands low at 0.95%.
ASML Holding N.V.
ASML delivers superior profitability, boasting a 47.08% ROE and a solid 29.42% net margin, reflecting strong capital allocation. Its valuation is expensive, marked by a P/E of 38.33 and P/B of 18.05, signaling premium pricing. Dividends yield 0.69%, with substantial reinvestment in innovation at nearly 14.4% of revenue.
Premium Valuation vs. Operational Safety
TSMC balances high returns with a more conservative valuation and stronger liquidity ratios, offering a steadier risk profile. ASML commands higher profitability but at a significantly elevated price and weaker liquidity. Investors seeking operational safety may prefer TSMC; those favoring aggressive growth could lean toward ASML.
Which one offers the Superior Shareholder Reward?
I see Taiwan Semiconductor Manufacturing Company Limited (TSM) delivers a more attractive shareholder reward than ASML Holding N.V. TSM yields about 1.08% with a sustainable payout ratio near 31%. Its free cash flow covers dividends comfortably, supporting steady payouts. TSM also executes sizable buybacks, enhancing total return. ASML yields under 1%, with a similar payout ratio but lower dividend coverage and smaller buybacks. ASML’s reinvestment prioritizes capex but at a higher valuation multiple, pressuring returns. Historically, TSM’s balanced dividend and aggressive buybacks make its shareholder reward more reliable and superior in 2026.
Comparative Score Analysis: The Strategic Profile
The radar chart reveals the fundamental DNA and trade-offs of Taiwan Semiconductor Manufacturing Company Limited and ASML Holding N.V.:
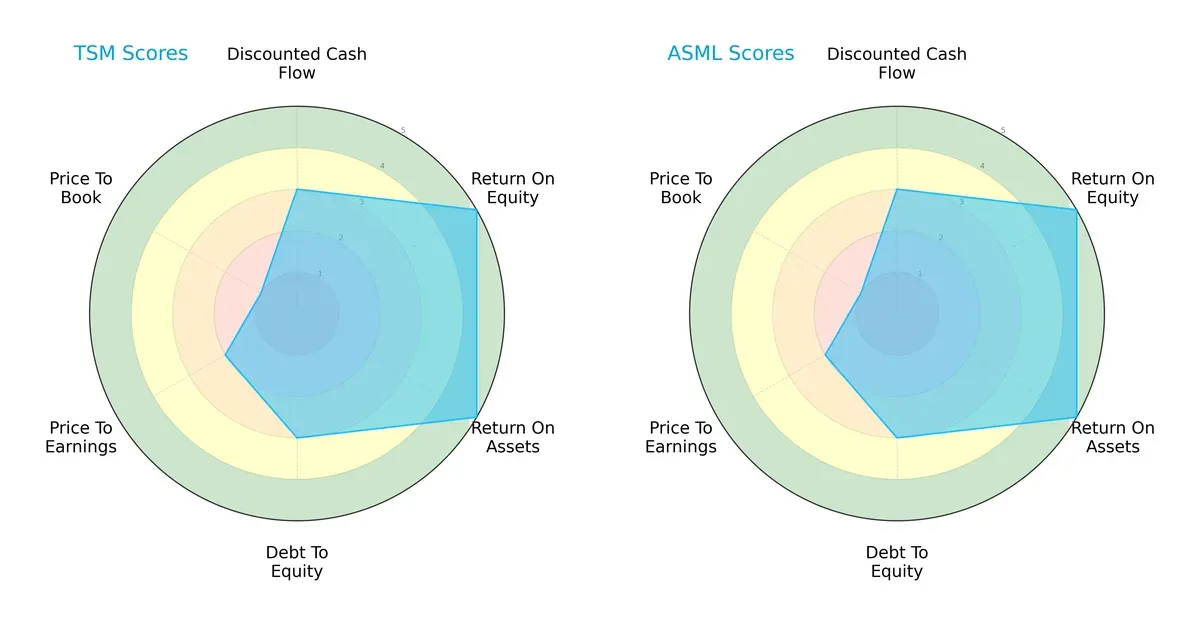
Both firms exhibit identical scores in DCF, ROE, ROA, and Debt/Equity, signaling comparable operational efficiency and financial risk. However, both show weaker valuation metrics, especially in Price-to-Book, indicating potential market skepticism. Neither company holds a clearly more balanced profile; both rely on strong profitability with moderate leverage but face valuation challenges.
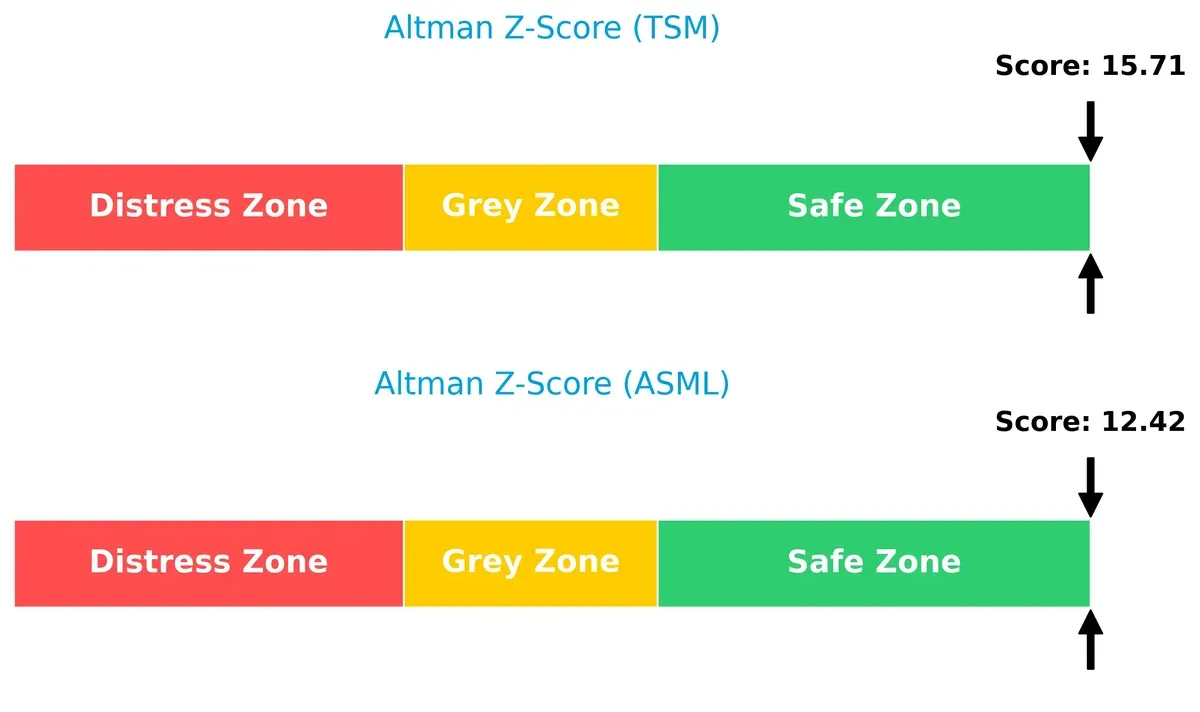
Bankruptcy Risk: Solvency Showdown
Taiwan Semiconductor Manufacturing Company Limited’s Altman Z-Score of 15.7 surpasses ASML’s 12.4, indicating a slightly stronger solvency position. Both companies remain firmly in the safe zone, reflecting robust financial health for long-term survival in this cycle:
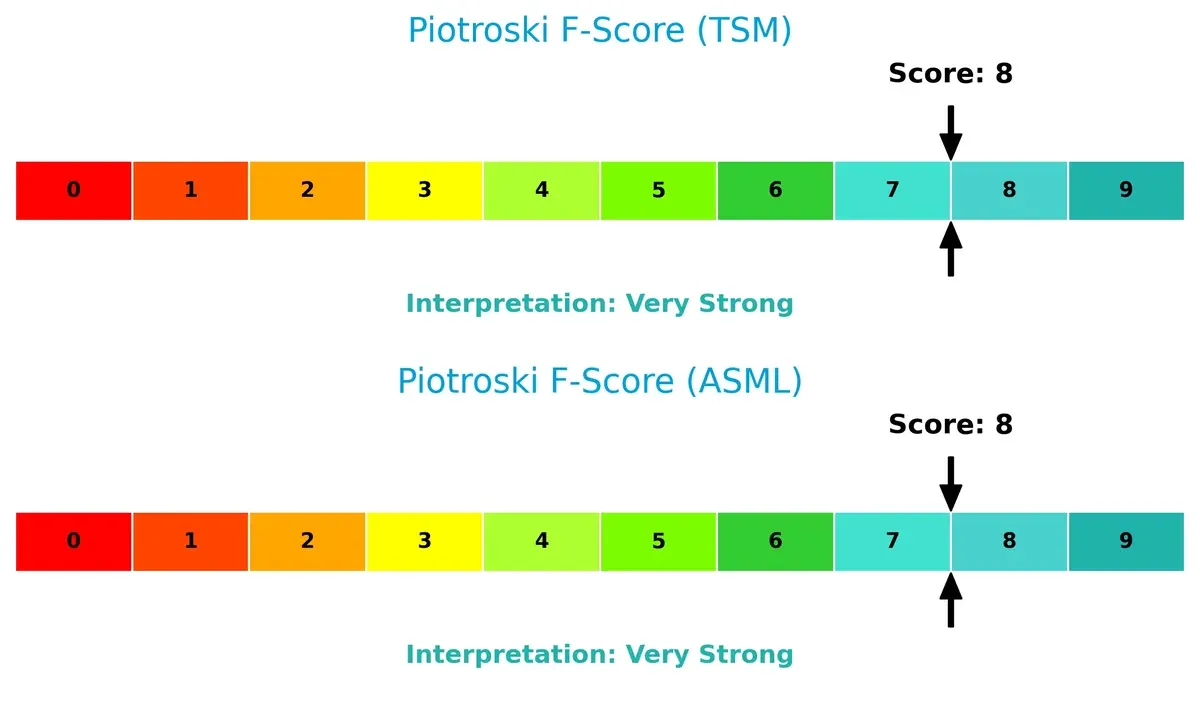
Financial Health: Quality of Operations
Both companies score an 8 on the Piotroski F-Score, signaling very strong financial health. Neither shows red flags in profitability, leverage, or liquidity, reinforcing their operational quality and investment appeal:
How are the two companies positioned?
This section dissects the operational DNA of TSM and ASML by comparing their revenue distribution and internal dynamics. The goal is to confront their economic moats and identify the most resilient competitive advantage today.
Revenue Segmentation: The Strategic Mix
This visual comparison dissects how Taiwan Semiconductor Manufacturing Company and ASML diversify their income streams and where their primary sector bets lie:
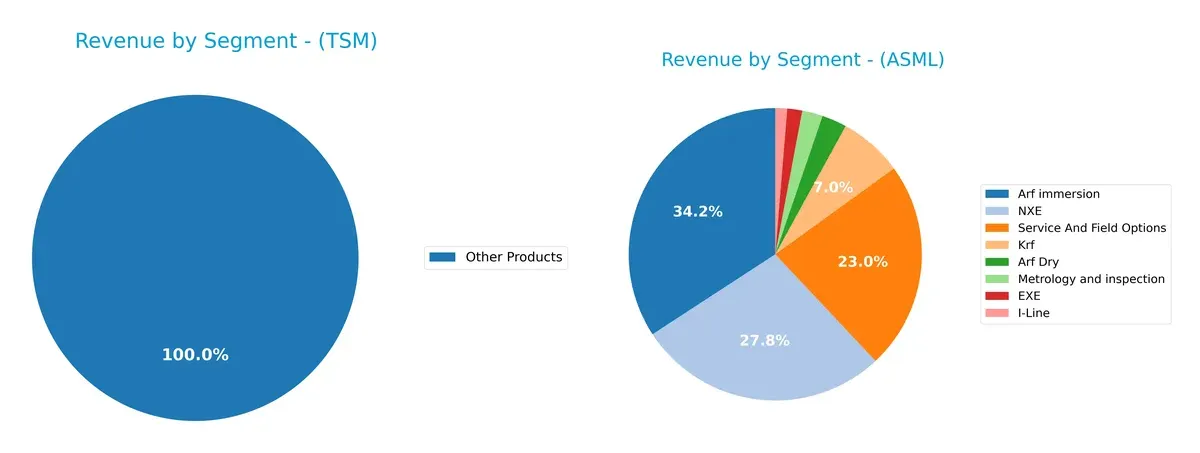
Taiwan Semiconductor Manufacturing Company anchors its revenue in the Wafer segment, generating approximately 1.99T TWD in 2022, dwarfing its Other Products at 272B TWD. In contrast, ASML shows a more diversified revenue base in 2024, with Arf immersion at 9.67B and NXE at 7.86B, plus significant Service and Field Options at 6.49B. TSM’s concentration signals heavy dependence on semiconductor manufacturing, increasing exposure to wafer market cycles. ASML’s multi-segment approach mitigates risk and leverages broad infrastructure dominance in lithography.
Strengths and Weaknesses Comparison
This table compares the Strengths and Weaknesses of Taiwan Semiconductor Manufacturing Company Limited (TSM) and ASML Holding N.V. (ASML):
TSM Strengths
- High net margin at 45.1%
- Strong ROE of 32.12%
- Favorable ROIC at 24.92%
- Solid liquidity with current ratio 2.62
- Low debt-to-assets at 12.52%
- Diversified global revenue across US, China, Taiwan, and Japan
ASML Strengths
- Strong ROE at 47.08%
- Highest ROIC at 34.14%
- Favorable fixed asset turnover at 3.81
- Low debt-to-assets at 5.36%
- Global presence including US, China, Korea, Taiwan
- Multiple product lines including EUV and metrology systems
TSM Weaknesses
- Unfavorable P/E at 28.45 and P/B at 9.14
- Moderate asset turnover at 0.49
- Dividend yield low at 0.95%
- Neutral WACC at 9.69%
- Heavy reliance on wafer products for revenue
ASML Weaknesses
- Unfavorable P/E at 38.33 and P/B at 18.05
- Quick ratio below 1 at 0.79
- Higher WACC at 10.08%
- Less diversified revenue geographically, concentrated in fewer markets
- Lower dividend yield at 0.69%
TSM’s strengths lie in profitability metrics and strong liquidity, supported by broad geographic diversification. ASML excels in capital efficiency and return metrics but faces pressure from valuation multiples and liquidity ratios. Both companies show solid financial foundations but differ in capital structure and revenue diversity, which will shape their strategic focus.
The Moat Duel: Analyzing Competitive Defensibility
A structural moat is the only barrier safeguarding long-term profits from relentless competition erosion. Let’s examine how two semiconductor giants defend their turf:
Taiwan Semiconductor Manufacturing Company Limited: Scale and Cost Advantage
TSMC’s moat stems from unparalleled scale and cost efficiency, reflected in a robust 53% EBIT margin and 32% rising ROIC through 2025. Its leadership in advanced wafer fabrication deepens this advantage amid expanding markets like automotive chips.
ASML Holding N.V.: Technological Innovation and Intangible Assets
ASML’s moat lies in cutting-edge lithography technology, commanding a premium with a 35% EBIT margin and a 24% ROIC premium over WACC. Its EUV systems create high entry barriers, with new product cycles promising sustained dominance in chipmaking equipment.
Capital Efficiency vs. Technological Leadership: The Moat Face-off
Both firms deliver very favorable moats with growing ROIC trends, yet ASML’s higher ROIC premium signals a deeper moat rooted in unique technology. However, TSMC’s scale-driven cost advantage offers broader market defense. ASML edges ahead in protecting future market share amid innovation-driven disruption.
Which stock offers better returns?
Both Taiwan Semiconductor Manufacturing Company Limited and ASML Holding N.V. display strong bullish trends with notable price gains and trading shifts over the past 12 months.
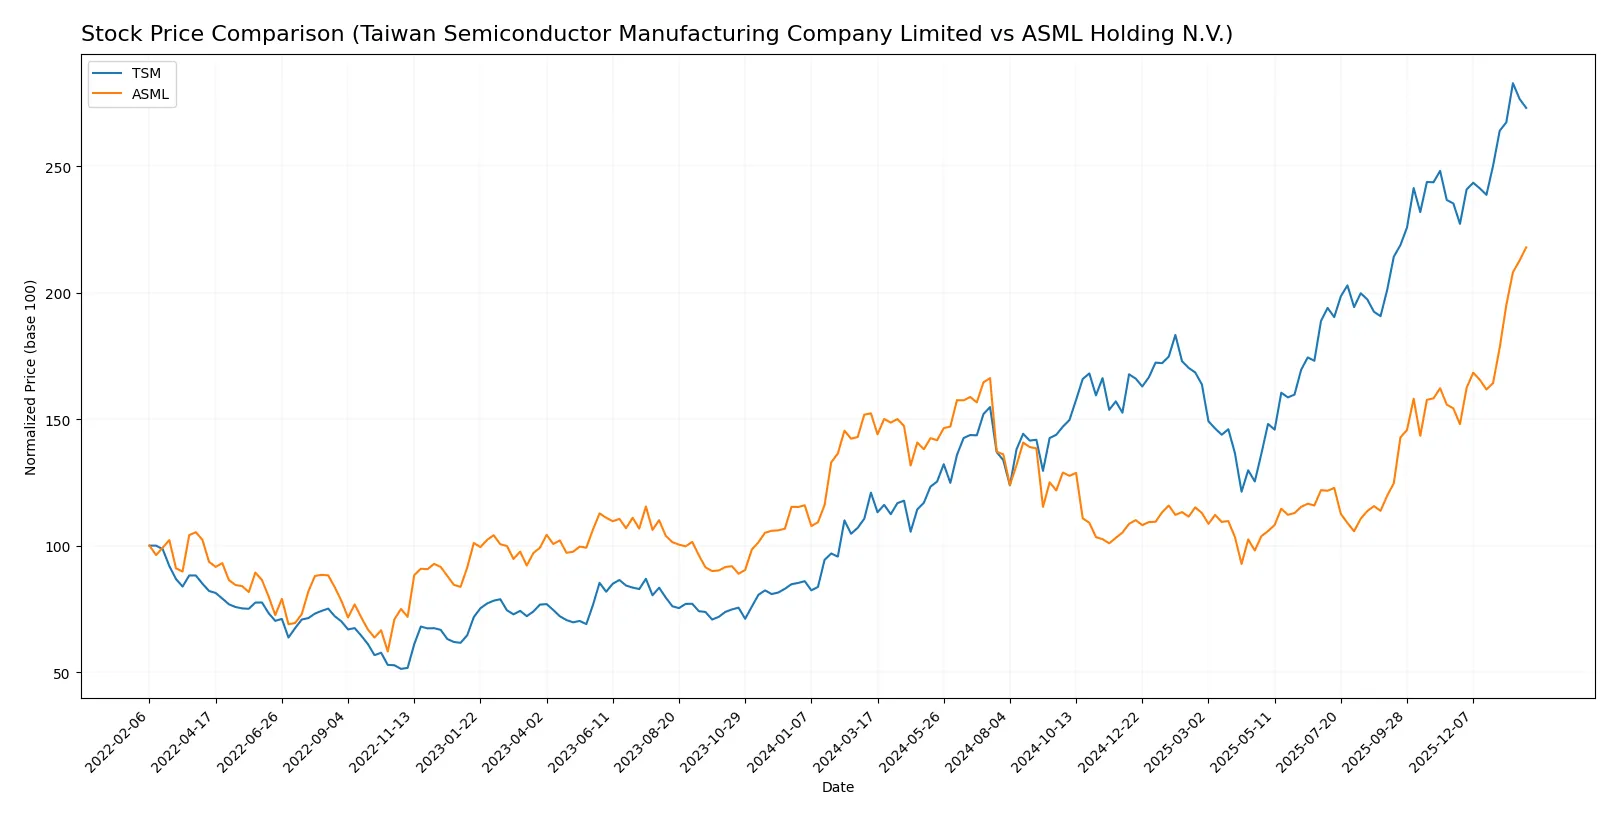
Trend Comparison
Taiwan Semiconductor Manufacturing Company Limited’s stock rose 125.84% over the past year, showing acceleration and a notable range between 127.7 and 342.4. Volatility is moderate with a standard deviation of 53.6.
ASML Holding N.V. increased 43.11% over the same period, also accelerating. It experienced higher volatility, reflected in a 170.09 standard deviation and a price range from 605.55 to 1423.0.
TSM outperformed ASML in overall market gains, delivering nearly three times the percentage increase despite ASML’s higher volatility and recent buyer dominance.
Target Prices
Analysts present a confident target price range for Taiwan Semiconductor and ASML, reflecting strong sector prospects.
| Company | Target Low | Target High | Consensus |
|---|---|---|---|
| Taiwan Semiconductor Manufacturing Company Limited | 330 | 450 | 397.5 |
| ASML Holding N.V. | 1150 | 1911 | 1458.5 |
The consensus target prices for TSM and ASML exceed current prices by 20% and 2.5%, respectively, indicating moderate to strong upside potential.

Don’t Let Luck Decide Your Entry Point
Optimize your entry points with our advanced ProRealTime indicators. You’ll get efficient buy signals with precise price targets for maximum performance. Start outperforming now!
How do institutions grade them?
Taiwan Semiconductor Manufacturing Company Limited Grades
Here are the latest institutional grades for Taiwan Semiconductor Manufacturing Company Limited:
| Grading Company | Action | New Grade | Date |
|---|---|---|---|
| TD Cowen | Maintain | Hold | 2026-01-16 |
| Barclays | Maintain | Overweight | 2026-01-16 |
| Needham | Maintain | Buy | 2026-01-15 |
| Bernstein | Maintain | Outperform | 2025-12-08 |
ASML Holding N.V. Grades
Here are the latest institutional grades for ASML Holding N.V.:
| Grading Company | Action | New Grade | Date |
|---|---|---|---|
| Barclays | Upgrade | Overweight | 2026-01-29 |
| Wells Fargo | Maintain | Overweight | 2026-01-29 |
| RBC Capital | Maintain | Outperform | 2026-01-29 |
| Bernstein | Maintain | Outperform | 2026-01-22 |
Which company has the best grades?
ASML consistently receives higher grades including multiple Outperform and an upgrade to Overweight. TSM shows solid Buy and Overweight ratings but fewer upgrades. Investors may view ASML as having stronger institutional endorsement currently.
Risks specific to each company
The following categories identify the critical pressure points and systemic threats facing both firms in the 2026 market environment:
1. Market & Competition
Taiwan Semiconductor Manufacturing Company Limited
- Dominates foundry market but faces intense competition from emerging chipmakers globally.
ASML Holding N.V.
- Leads lithography equipment market with near-monopoly but vulnerable to customer concentration risks.
2. Capital Structure & Debt
Taiwan Semiconductor Manufacturing Company Limited
- Low debt-to-equity ratio (0.18) signals strong balance sheet and conservative leverage.
ASML Holding N.V.
- Even lower debt-to-equity ratio (0.14) but slightly higher WACC (10.08%) raises cost of capital concerns.
3. Stock Volatility
Taiwan Semiconductor Manufacturing Company Limited
- Beta of 1.274 implies moderate volatility relative to the market.
ASML Holding N.V.
- Slightly higher beta at 1.341 indicates greater sensitivity to market swings.
4. Regulatory & Legal
Taiwan Semiconductor Manufacturing Company Limited
- Exposed to tightening export controls and geopolitical tensions impacting Taiwan-China relations.
ASML Holding N.V.
- Faces complex EU and US regulations on advanced technology exports, with legal scrutiny on IP and trade compliance.
5. Supply Chain & Operations
Taiwan Semiconductor Manufacturing Company Limited
- Relies heavily on rare materials and advanced manufacturing processes vulnerable to supply disruptions.
ASML Holding N.V.
- Complex global supply chain for critical components; operational risk from geopolitical hotspots in Asia and Europe.
6. ESG & Climate Transition
Taiwan Semiconductor Manufacturing Company Limited
- High energy consumption in fabs challenges carbon reduction targets amid rising ESG investor scrutiny.
ASML Holding N.V.
- Proactive in energy efficiency and sustainable manufacturing but must manage increasing regulatory ESG demands.
7. Geopolitical Exposure
Taiwan Semiconductor Manufacturing Company Limited
- Location in Taiwan exposes it to significant geopolitical risk from cross-strait tensions.
ASML Holding N.V.
- Diverse geographic footprint mitigates risk, but dependence on Asian markets still presents geopolitical challenges.
Which company shows a better risk-adjusted profile?
TSMC’s biggest risk is geopolitical exposure given its Taiwan base. ASML faces regulatory complexity and higher capital costs. Despite these risks, TSMC’s conservative leverage, strong liquidity, and lower stock volatility provide a more balanced risk-adjusted profile. Its Altman Z-score of 15.7 and Piotroski score of 8 reinforce financial resilience. Meanwhile, ASML’s higher WACC and weaker liquidity ratios signal a slightly elevated risk. In 2026, TSMC’s robust current ratio (2.62) versus ASML’s moderate (1.26) underscores superior short-term financial stability.
Final Verdict: Which stock to choose?
Taiwan Semiconductor Manufacturing Company Limited (TSM) boasts unmatched operational efficiency and a durable competitive edge, evident in its impressive ROIC growth and strong cash conversion cycle. Its point of vigilance lies in a relatively high valuation, which may temper near-term upside. TSM suits an Aggressive Growth portfolio seeking robust industry leadership.
ASML Holding N.V. commands a powerful strategic moat through its technological dominance in lithography equipment, underpinning recurring revenue streams. While it offers slightly less liquidity safety than TSM, its superior ROE and capital efficiency provide a compelling stability profile. ASML fits well within GARP portfolios balancing growth with disciplined capital deployment.
If you prioritize aggressive expansion with a focus on operational excellence, TSM is the compelling choice due to its superior cash generation and efficiency. However, if you seek growth tempered by strong technological barriers and capital discipline, ASML offers better stability and a commanding moat despite its premium valuation. Both names reflect durable moats, but your risk tolerance and investment horizon will guide the optimal analytical scenario.
Disclaimer: Investment carries a risk of loss of initial capital. The past performance is not a reliable indicator of future results. Be sure to understand risks before making an investment decision.
Go Further
I encourage you to read the complete analyses of Taiwan Semiconductor Manufacturing Company Limited and ASML Holding N.V. to enhance your investment decisions: