Home > Comparison > Technology > ASML vs STM
The strategic rivalry between ASML Holding N.V. and STMicroelectronics N.V. shapes semiconductor industry dynamics. ASML dominates as a capital-intensive leader in advanced lithography systems, while STMicroelectronics excels as a diversified semiconductor manufacturer with broad product exposure. This head-to-head highlights a contest between specialized technological innovation and diversified market reach. This analysis will determine which trajectory offers superior risk-adjusted returns for a balanced, growth-oriented portfolio.
Table of contents
Companies Overview
ASML Holding and STMicroelectronics both lead the semiconductor sector with distinct market roles and innovative strengths.
ASML Holding N.V.: Semiconductor Lithography Pioneer
ASML dominates the advanced semiconductor equipment market, specializing in lithography systems essential for chip manufacturing. Its revenue stems from selling extreme ultraviolet and deep ultraviolet lithography machines, which enable cutting-edge semiconductor nodes. In 2026, ASML’s strategic focus remains on expanding its technological lead in lithography precision and computational lithography solutions.
STMicroelectronics N.V.: Diverse Semiconductor Solutions Provider
STMicroelectronics operates broadly across automotive, industrial, and consumer markets, generating revenue through integrated circuits, MEMS sensors, and microcontrollers. Its core strength lies in analog and mixed-signal chips and power transistors. The company’s 2026 strategy targets innovation in automotive ICs and MEMS, emphasizing scalable solutions across multiple end markets.
Strategic Collision: Similarities & Divergences
ASML and STMicroelectronics pursue fundamentally different business models—one focusing on capital-intensive semiconductor equipment, the other on versatile semiconductor components. Their primary battleground is the semiconductor supply chain, where ASML’s lithography tools enable chipmakers, while STMicroelectronics supplies the chips themselves. This contrast shapes distinct investment profiles: ASML offers exposure to semiconductor manufacturing complexity, STMicroelectronics to diversified chip applications.
Income Statement Comparison
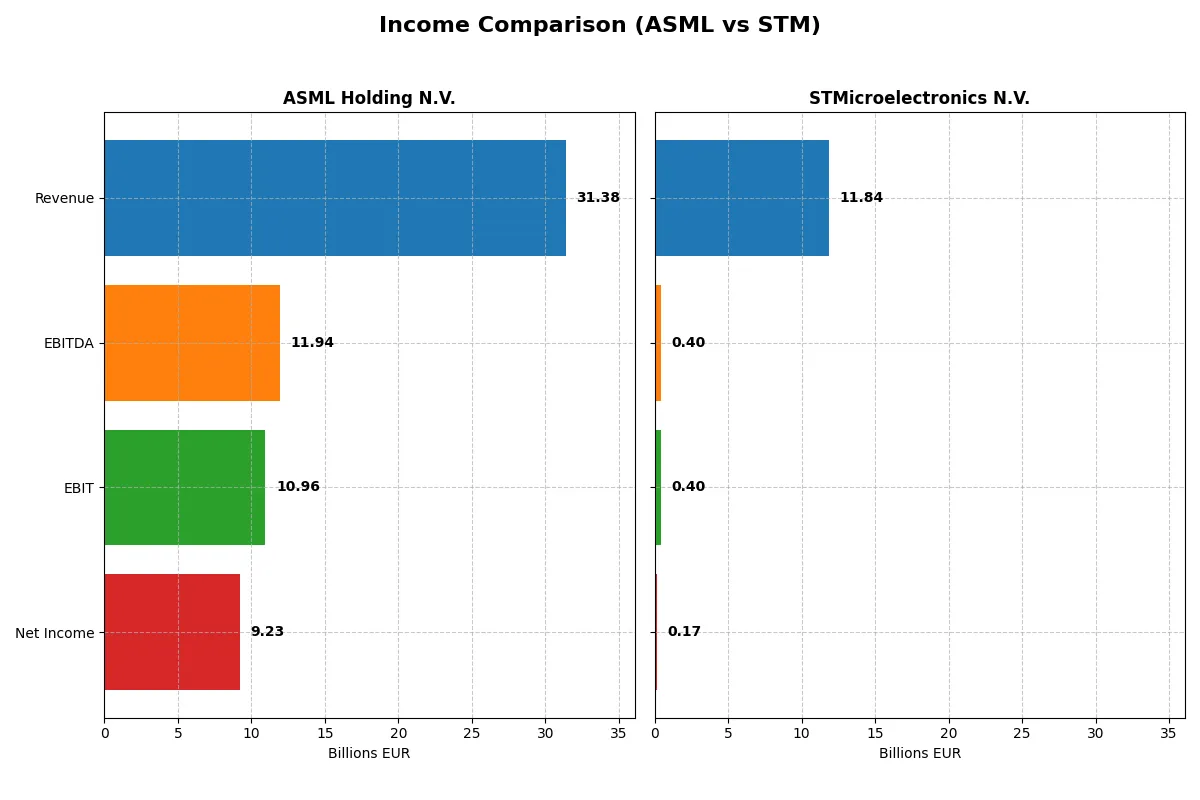
The following data dissects the core profitability and scalability of both corporate engines to reveal who dominates the bottom line:
| Metric | ASML Holding N.V. (ASML) | STMicroelectronics N.V. (STM) |
|---|---|---|
| Revenue | 31.4B EUR | 11.8B USD |
| Cost of Revenue | 14.8B EUR | 7.8B USD |
| Operating Expenses | 5.7B EUR | 3.7B USD |
| Gross Profit | 16.6B EUR | 4.0B USD |
| EBITDA | 11.9B EUR | 0.4B USD |
| EBIT | 11.0B EUR | 0.4B USD |
| Interest Expense | 0 | 0 |
| Net Income | 9.2B EUR | 0.17B USD |
| EPS | 23.76 EUR | 0.19 USD |
| Fiscal Year | 2025 | 2025 |
Income Statement Analysis: The Bottom-Line Duel
This income statement comparison reveals which company runs its operations more efficiently and sustainably in the current market landscape.
ASML Holding N.V. Analysis
ASML’s revenue climbed steadily to 31.4B EUR in 2025, with net income surging to 9.2B EUR. The company maintains a robust gross margin above 52%, signaling strong cost control. Its net margin near 29% confirms high profitability, boosted by favorable R&D and operational expense management. Momentum in 2025 is solid, with double-digit growth across key income metrics.
STMicroelectronics N.V. Analysis
STM’s revenue declined to 11.8B USD in 2025, dragging net income down sharply to 167M USD. Gross margin lingers at a moderate 34%, but net margin shrinks to just 1.4%, reflecting pressure on profitability. The past year saw significant contraction in EBIT and earnings per share, indicating operational challenges and inefficiencies amid a tough sector environment.
Margin Strength vs. Revenue Resilience
ASML clearly outperforms STM in profitability, growing revenue and expanding net income with strong margin control. STM’s shrinking top line and razor-thin net margin reveal structural headwinds and cost pressures. For investors, ASML’s profile offers superior efficiency and earnings momentum, while STM’s riskier trajectory demands caution.
Financial Ratios Comparison
These vital ratios act as a diagnostic tool to expose the underlying fiscal health, valuation premiums, and capital efficiency of the companies analyzed below:
| Ratios | ASML Holding N.V. (ASML) | STMicroelectronics N.V. (STM) |
|---|---|---|
| ROE | 47.1% | 0.9% |
| ROIC | 34.1% | 0.7% |
| P/E | 38.3 | N/A |
| P/B | 18.0 | N/A |
| Current Ratio | 1.26 | 3.36 |
| Quick Ratio | 0.79 | 2.43 |
| D/E (Debt-to-Equity) | 0.14 | 0.12 |
| Debt-to-Assets | 5.4% | 8.6% |
| Interest Coverage | N/A | N/A |
| Asset Turnover | 0.62 | 0.48 |
| Fixed Asset Turnover | 3.81 | 1.07 |
| Payout Ratio | 26.5% | 0% |
| Dividend Yield | 0.69% | 0% |
| Fiscal Year | 2025 | 2025 |
Efficiency & Valuation Duel: The Vital Signs
Financial ratios act as a company’s DNA, revealing hidden risks and operational excellence crucial for investment decisions.
ASML Holding N.V.
ASML delivers robust profitability with a 47.1% ROE and a strong 29.4% net margin, signaling operational excellence. The stock trades at a stretched P/E of 38.3 and P/B of 18.1, reflecting premium valuation. Shareholders receive modest dividends (0.69% yield), while the company prioritizes R&D investment at 14.4% of revenue to fuel growth.
STMicroelectronics N.V.
STM shows weak profitability, with ROE at 0.93% and a slim 1.4% net margin, revealing operational challenges. The valuation appears inexpensive with P/E and P/B at zero, but the current ratio is elevated at 3.36, suggesting excess liquidity. No dividends are paid; instead, STM invests heavily in R&D at 17.3% of sales to improve future prospects.
Premium Valuation vs. Operational Safety
ASML offers superior profitability but at a high valuation, while STM trades cheaply but struggles to generate returns. ASML suits investors seeking growth backed by strong fundamentals. STM fits those prioritizing liquidity and R&D-driven turnaround potential despite weak current profits.
Which one offers the Superior Shareholder Reward?
I observe ASML Holding N.V. delivers a balanced distribution with a 0.97% dividend yield and a moderate 27% payout ratio, supported by strong free cash flow of 27.4B EUR in 2025. Its buybacks enhance shareholder returns sustainably. STMicroelectronics pays a smaller 1.28% dividend but with a weaker payout ratio and irregular free cash flow, reflecting less consistent cash returns. STM’s distribution leans on reinvestment for growth, yet its buyback activity is minimal. Historically in semiconductors, reliable dividends plus aggressive buybacks, as ASML practices, tend to outperform. I conclude ASML offers the superior total return profile in 2026 due to its sustainable dividend and disciplined buyback strategy.
Comparative Score Analysis: The Strategic Profile
The radar chart reveals the fundamental DNA and trade-offs of ASML Holding N.V. and STMicroelectronics N.V., highlighting their strategic strengths and weaknesses:
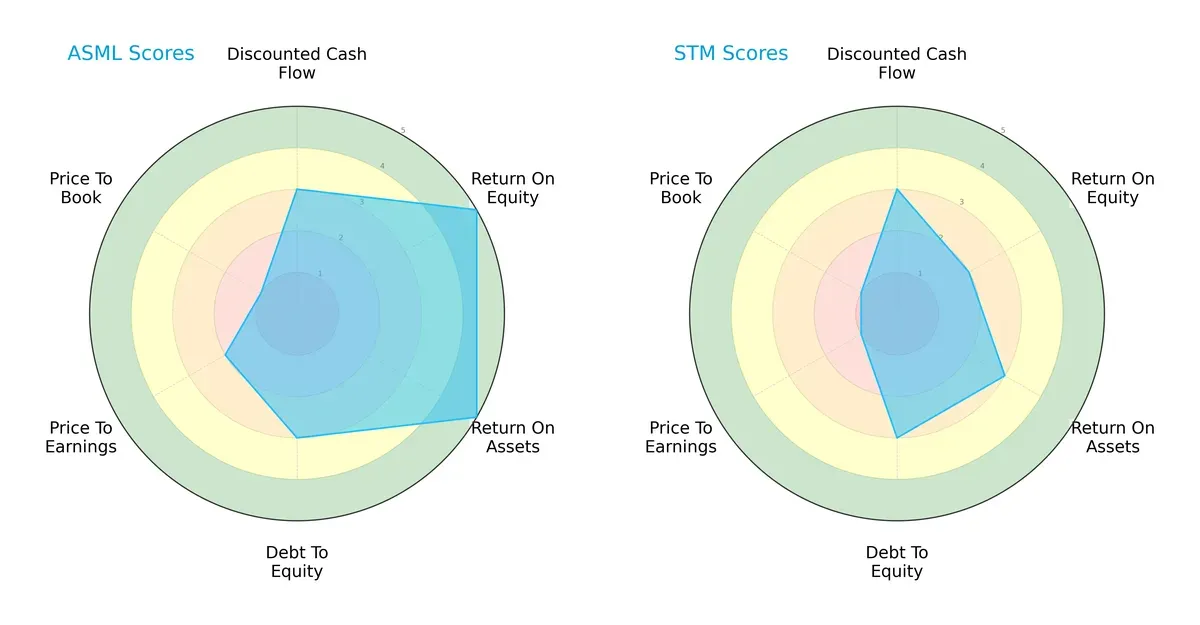
ASML dominates in profitability metrics with top ROE and ROA scores of 5 each, reflecting superior asset efficiency and equity returns. Both firms share moderate debt-to-equity discipline at 3, mitigating leverage risks equally. ASML’s discounted cash flow score matches STM at 3, but ASML suffers on valuation metrics, scoring only 1 on price-to-book, signaling a premium price. STM’s valuation scores are weaker overall, with a notably low price-to-earnings score of 1. ASML presents a more balanced profile, leveraging operational efficiency, while STM relies more on moderate asset returns and conservative leverage.
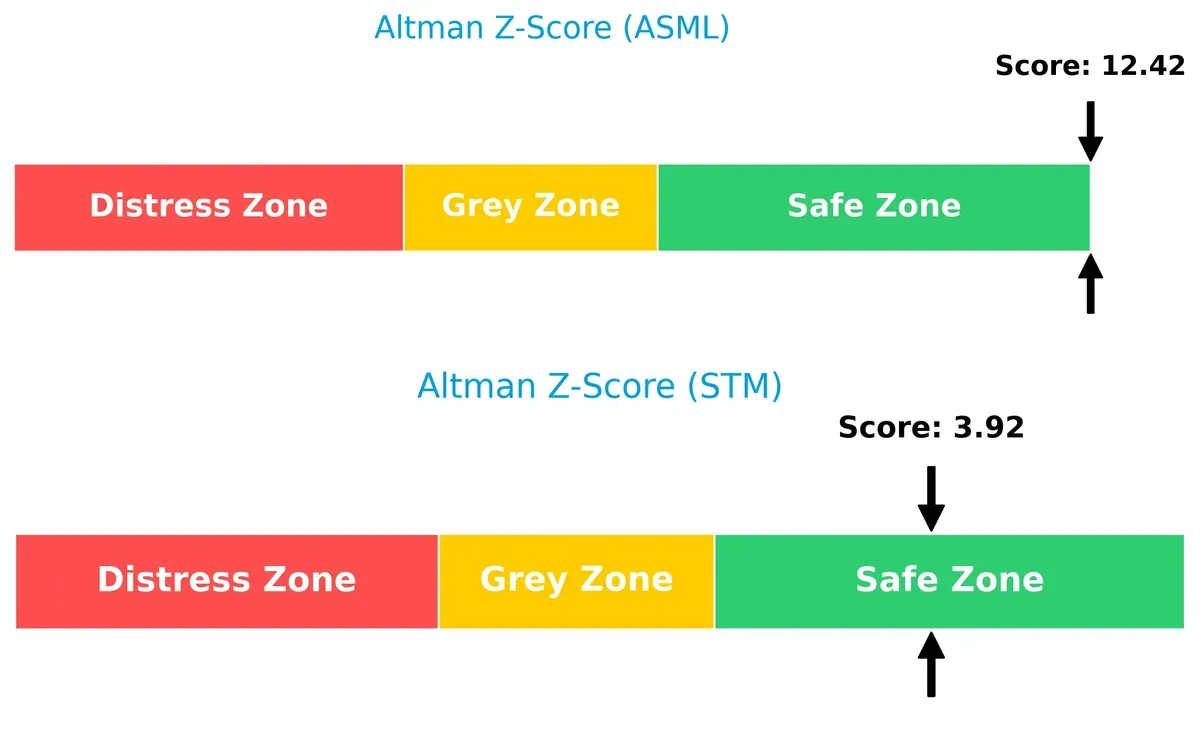
Bankruptcy Risk: Solvency Showdown
ASML’s Altman Z-Score of 12.4 vastly outpaces STM’s 3.9, placing both safely above distress thresholds but confirming ASML’s superior solvency buffer in this cycle:
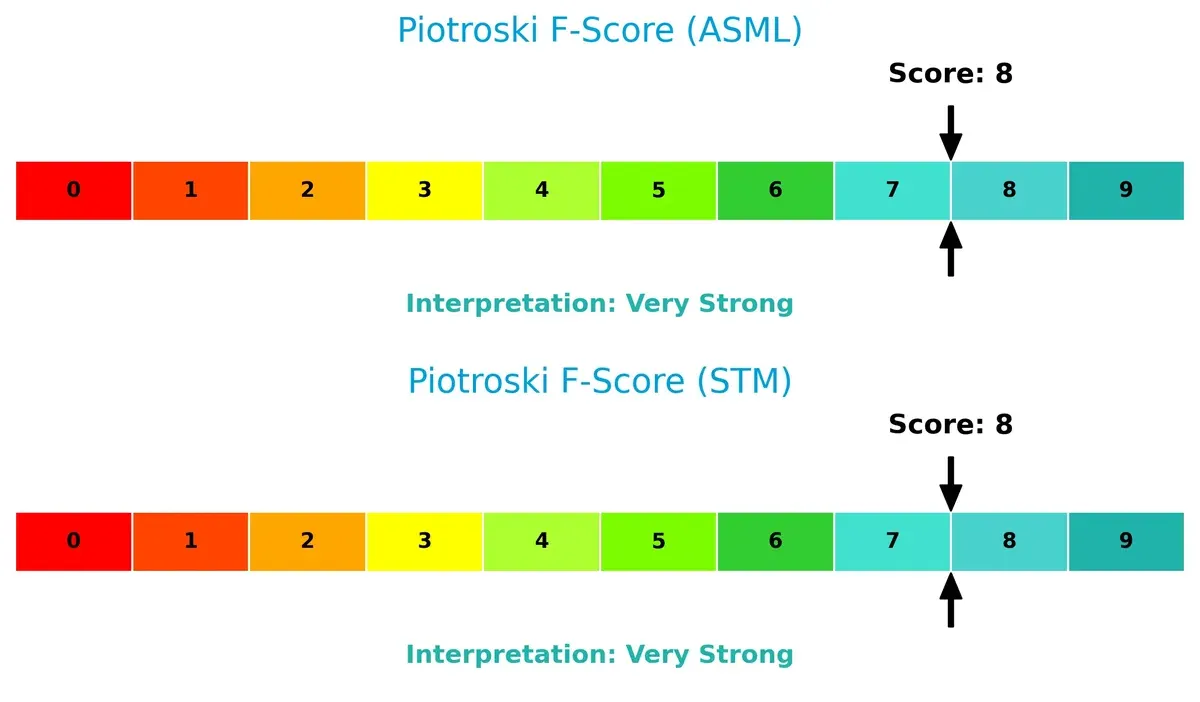
Financial Health: Quality of Operations
Both ASML and STM demonstrate peak financial health with strong Piotroski F-Scores of 8, signaling robust profitability, liquidity, and operational efficiency without immediate red flags:
How are the two companies positioned?
This section dissects ASML and STM’s operational DNA by comparing their revenue distribution and internal dynamics. The goal is to confront their economic moats to identify the most resilient, sustainable competitive advantage today.
Revenue Segmentation: The Strategic Mix
This visual comparison dissects how ASML Holding N.V. and STMicroelectronics N.V. diversify their income streams and where their primary sector bets lie:
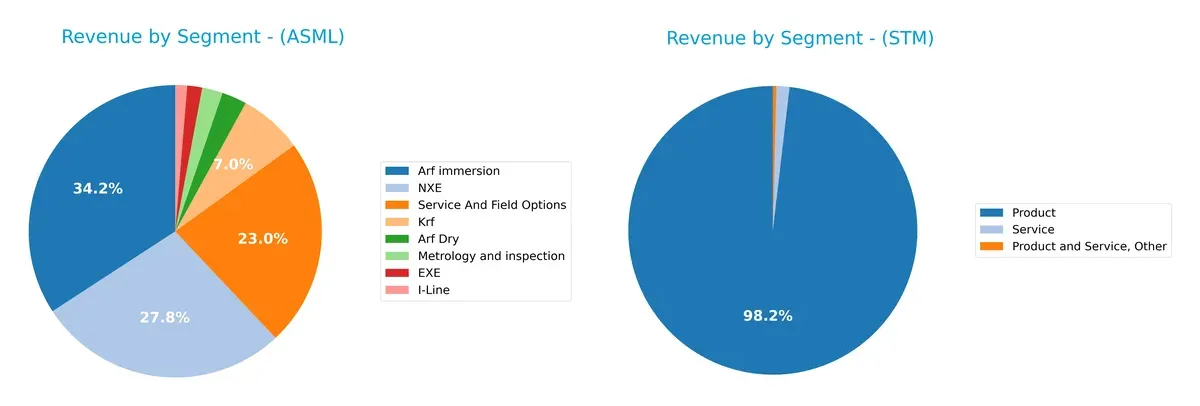
ASML anchors its revenue heavily in Arf immersion (9.67B) and NXE (7.86B), with significant contributions from Service and Field Options (6.49B). This concentration highlights its dominance in photolithography systems and customer support. Conversely, STMicroelectronics pivots mostly on its Product segment (13.2B) with minimal Service (196M) and other revenues, reflecting a less diversified mix. ASML’s focus on high-tech semiconductor equipment secures ecosystem lock-in, while STM’s concentration exposes it to product cycle volatility.
Strengths and Weaknesses Comparison
This table compares the strengths and weaknesses of ASML and STM based on diversification, profitability, financials, innovation, global presence, and market share:
ASML Strengths
- High net margin and ROE indicate strong profitability
- Favorable debt ratios signal conservative financial management
- Leading fixed asset turnover reflects operational efficiency
- Diversified revenue streams across advanced lithography and services
- Broad global presence with significant sales in China and Taiwan
STM Strengths
- Favorable debt ratios and interest coverage ensure financial stability
- Strong quick ratio supports short-term liquidity
- Diverse product portfolio including automotive and analog segments
- Global footprint with notable revenue in Singapore and Switzerland
- Favorable valuation multiples suggest market undervaluation
ASML Weaknesses
- High PE and PB ratios indicate possible overvaluation risk
- Low quick ratio signals potential liquidity concerns
- WACC exceeds some returns, increasing capital costs
- Dividend yield is low, possibly limiting income appeal
- Moderate asset turnover points to room for efficiency gains
STM Weaknesses
- Low profitability with weak net margin, ROE, and ROIC
- Unfavorable current ratio suggests liquidity pressure
- Asset turnover lags industry, reflecting lower operational efficiency
- Zero dividend yield may deter income-focused investors
- Neutral WACC may limit competitive capital allocation
ASML demonstrates robust profitability and operational efficiency but faces valuation and liquidity challenges. STM shows financial stability and undervaluation but struggles with profitability and efficiency, affecting its competitive positioning.
The Moat Duel: Analyzing Competitive Defensibility
A structural moat protects long-term profits from competitive erosion. Without it, gains quickly vanish under market pressure:
ASML Holding N.V.: Technological Dominance & High Entry Barriers
ASML’s moat stems from its exclusive advanced lithography technology. This delivers a stellar 25% ROIC above WACC and margin stability. Innovations in EUV lithography deepen barriers in 2026.
STMicroelectronics N.V.: Broad Product Diversification with Margin Pressure
STM relies on diversified semiconductor products but lacks ASML’s technological edge. Its ROIC declines sharply, revealing weak capital efficiency. Market challenges in 2026 threaten further margin contraction.
Verdict: Technological Moat vs. Product Breadth in Semiconductor Battle
ASML’s deep technological moat dwarfs STM’s broad but shallow positioning. ASML’s growing profitability and innovation pipeline better defend market share against intensifying competition.
Which stock offers better returns?
The past year reveals stark contrasts: ASML Holding N.V. surged 43.1%, showing accelerating bullish momentum, while STMicroelectronics N.V. dropped 40.6%, with accelerating bearish pressure.
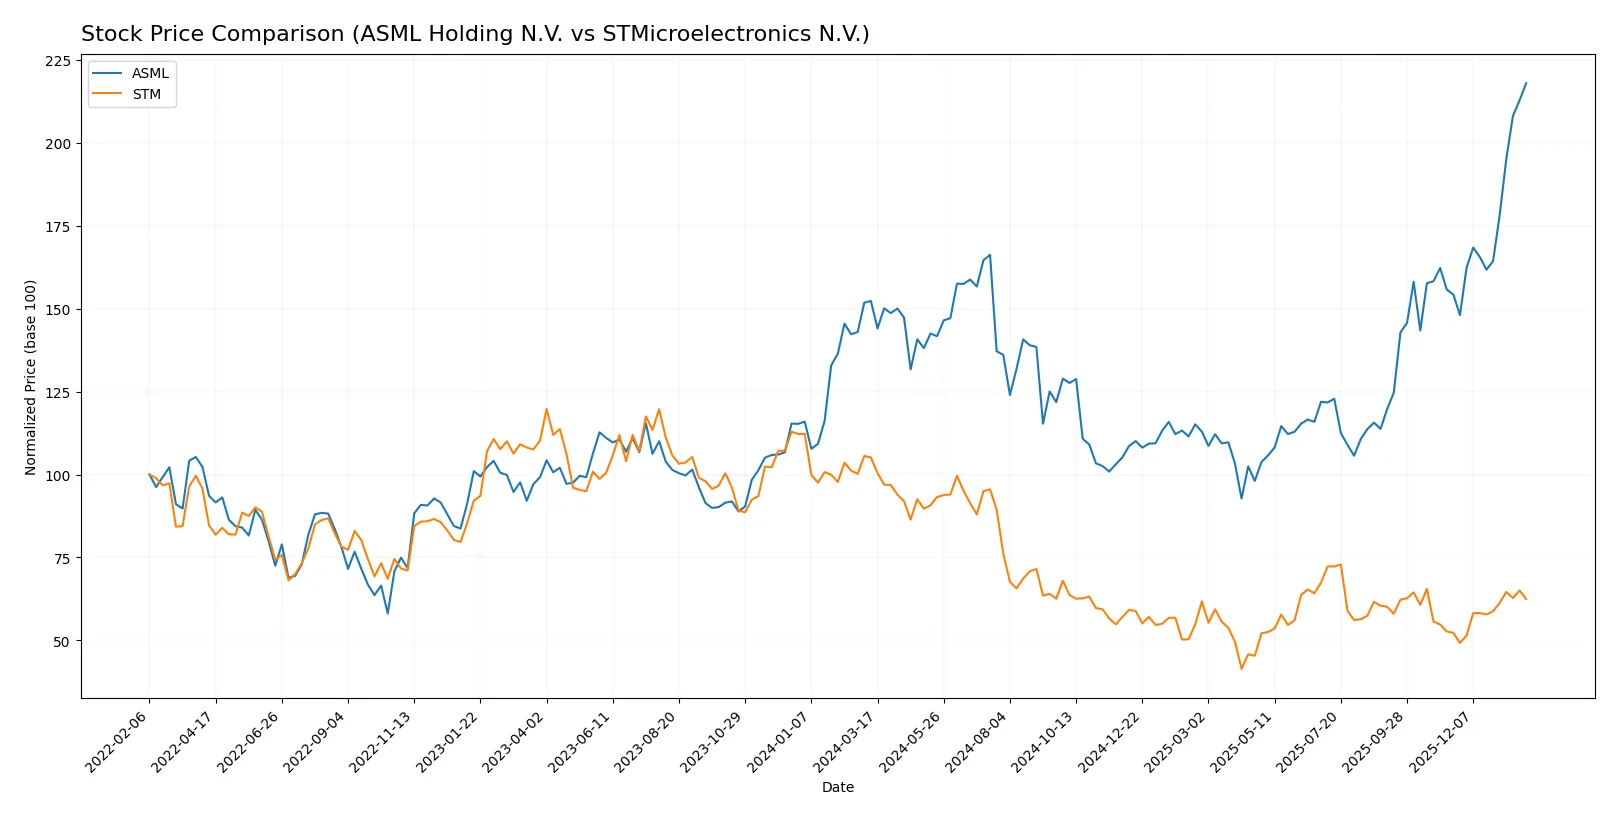
Trend Comparison
ASML Holding N.V. gained 43.1% over 12 months, confirming a strong bullish trend with accelerating price growth and high volatility, peaking at 1423.0.
STMicroelectronics N.V. declined 40.6% over the same period, marking a bearish trend with accelerating losses and low volatility, hitting a low of 18.49.
ASML outperformed STM decisively, delivering the highest market returns with sustained acceleration, contrasting STM’s significant decline.
Target Prices
Analysts present a broad but optimistic consensus on ASML Holding N.V. and STMicroelectronics N.V.
| Company | Target Low | Target High | Consensus |
|---|---|---|---|
| ASML Holding N.V. | 1150 | 1911 | 1458.5 |
| STMicroelectronics N.V. | 28 | 45 | 37.67 |
ASML’s consensus target slightly exceeds its current price of 1423, suggesting modest upside potential. STM’s target consensus at 37.67 significantly surpasses its current 27.89, indicating stronger expected growth.

Don’t Let Luck Decide Your Entry Point
Optimize your entry points with our advanced ProRealTime indicators. You’ll get efficient buy signals with precise price targets for maximum performance. Start outperforming now!
How do institutions grade them?
ASML Holding N.V. Grades
The following table summarizes recent institutional grades for ASML Holding N.V.:
| Grading Company | Action | New Grade | Date |
|---|---|---|---|
| Barclays | Upgrade | Overweight | 2026-01-29 |
| Wells Fargo | Maintain | Overweight | 2026-01-29 |
| RBC Capital | Maintain | Outperform | 2026-01-29 |
| Bernstein | Maintain | Outperform | 2026-01-22 |
| KGI Securities | Upgrade | Outperform | 2026-01-15 |
| Wells Fargo | Maintain | Overweight | 2026-01-15 |
| JP Morgan | Maintain | Overweight | 2026-01-14 |
| Bernstein | Upgrade | Outperform | 2026-01-05 |
| B of A Securities | Maintain | Buy | 2025-12-03 |
| JP Morgan | Maintain | Overweight | 2025-12-01 |
STMicroelectronics N.V. Grades
The following table summarizes recent institutional grades for STMicroelectronics N.V.:
| Grading Company | Action | New Grade | Date |
|---|---|---|---|
| TD Cowen | Maintain | Buy | 2025-10-24 |
| Susquehanna | Maintain | Positive | 2025-10-22 |
| Susquehanna | Maintain | Positive | 2025-07-25 |
| Susquehanna | Maintain | Positive | 2025-07-22 |
| Baird | Upgrade | Outperform | 2025-07-22 |
| Jefferies | Upgrade | Buy | 2025-02-19 |
| Bernstein | Downgrade | Market Perform | 2025-02-05 |
| Susquehanna | Maintain | Positive | 2025-01-31 |
| Barclays | Downgrade | Underweight | 2025-01-22 |
| JP Morgan | Downgrade | Neutral | 2024-12-09 |
Which company has the best grades?
ASML Holding N.V. holds consistently stronger grades, mostly “Outperform” and “Overweight,” indicating greater institutional confidence. STMicroelectronics shows mixed ratings with recent downgrades, suggesting higher perceived risks for investors.
Risks specific to each company
The following categories identify the critical pressure points and systemic threats facing both firms in the 2026 market environment:
1. Market & Competition
ASML Holding N.V.
- Dominates advanced lithography equipment, benefiting from high barriers to entry and customer lock-in.
STMicroelectronics N.V.
- Faces intense competition in diverse semiconductor segments with lower differentiation and pricing pressure.
2. Capital Structure & Debt
ASML Holding N.V.
- Maintains a low debt-to-equity ratio (0.14) and strong interest coverage, minimizing financial risk.
STMicroelectronics N.V.
- Also keeps low leverage (0.12 debt-to-equity) with solid interest coverage but higher debt-to-assets ratio (8.6%).
3. Stock Volatility
ASML Holding N.V.
- Exhibits higher beta of 1.34, indicating greater sensitivity to market swings.
STMicroelectronics N.V.
- Slightly lower beta of 1.29, suggesting marginally less volatility but still above market average.
4. Regulatory & Legal
ASML Holding N.V.
- Faces export controls and IP protection challenges due to cutting-edge tech and global footprint.
STMicroelectronics N.V.
- Subject to regulatory scrutiny in automotive and industrial sectors, with compliance costs rising.
5. Supply Chain & Operations
ASML Holding N.V.
- Complex supply chain reliant on specialized components and geopolitical stability in Asia.
STMicroelectronics N.V.
- More diversified manufacturing footprint but exposed to raw material price volatility and logistics bottlenecks.
6. ESG & Climate Transition
ASML Holding N.V.
- Faces pressure to reduce energy consumption of lithography equipment and improve sustainability metrics.
STMicroelectronics N.V.
- Increasing focus on eco-friendly product design and reduction of hazardous substances in manufacturing.
7. Geopolitical Exposure
ASML Holding N.V.
- High exposure to trade tensions between US, China, and Europe impacting sales and supply.
STMicroelectronics N.V.
- Also vulnerable to geopolitical shifts but benefits from broader regional diversification.
Which company shows a better risk-adjusted profile?
ASML’s dominant market position and robust financial health offset its higher valuation and geopolitical risks. STM suffers from weaker profitability and operational challenges but maintains solid liquidity and moderate leverage. ASML offers a more favorable risk-adjusted profile given its strong moat and financial metrics. The sharp contrast in net margins—29.4% for ASML versus 1.4% for STM—underscores ASML’s superior profitability and resilience amid competitive and geopolitical pressures.
Final Verdict: Which stock to choose?
ASML’s superpower lies in its durable competitive advantage, reflected in a soaring ROIC well above its cost of capital. It efficiently turns capital into cash and growth, demonstrating unmatched operational excellence. A point of vigilance remains its lofty valuation multiples, which could temper near-term upside. It suits portfolios targeting long-term aggressive growth with a tolerance for premium pricing.
STMicroelectronics leverages a strategic moat rooted in diversified semiconductor offerings and solid R&D investment, providing some resilience amid industry cyclicality. Compared to ASML, it offers a more conservative valuation and stronger liquidity, appealing to investors prioritizing financial safety. It fits well in a GARP portfolio seeking steady growth with a margin of safety.
If you prioritize sustained value creation and superior profitability in a high-moat leader, ASML is the compelling choice due to its proven capital efficiency and growth trajectory. However, if you seek more defensive exposure with a focus on liquidity and valuation comfort, STMicroelectronics offers better stability despite its current operational challenges. Each presents distinct risk-return profiles aligned with specific investor mandates.
Disclaimer: Investment carries a risk of loss of initial capital. The past performance is not a reliable indicator of future results. Be sure to understand risks before making an investment decision.
Go Further
I encourage you to read the complete analyses of ASML Holding N.V. and STMicroelectronics N.V. to enhance your investment decisions: