Home > Comparison > Technology > ASML vs SWKS
The strategic rivalry between ASML Holding N.V. and Skyworks Solutions, Inc. shapes the semiconductor industry’s evolution. ASML leads as a capital-intensive innovator specializing in advanced lithography systems, while Skyworks excels as a diversified semiconductor product designer focused on wireless and analog solutions. This analysis explores their contrasting growth models and competitive moats to identify which company offers a superior risk-adjusted return for a balanced portfolio.
Table of contents
Companies Overview
ASML Holding N.V. and Skyworks Solutions, Inc. both hold pivotal roles in the semiconductor industry, shaping chip technology and communications infrastructure.
ASML Holding N.V.: Semiconductor Equipment Pioneer
ASML leads as a developer of advanced lithography systems, essential for manufacturing cutting-edge chips. Its revenue stems from selling and servicing photolithography machines, including extreme ultraviolet and deep ultraviolet technologies. In 2026, ASML emphasizes expanding computational lithography and system upgrades to maintain its technological edge worldwide.
Skyworks Solutions, Inc.: Semiconductor Component Specialist
Skyworks designs and markets proprietary semiconductor components like amplifiers and front-end modules for wireless and automotive sectors. Its core revenue comes from sales of analog and mixed-signal products to diverse markets, including smartphones and aerospace. Strategic focus in 2026 centers on broadening applications in connected devices and automotive electronics to capture growth.
Strategic Collision: Similarities & Divergences
Both companies operate within semiconductors but diverge in approach: ASML provides capital-intensive, high-tech manufacturing equipment, while Skyworks targets versatile semiconductor components. Their competition centers on enabling next-generation electronics, with ASML dominating chip production tech and Skyworks excelling in wireless connectivity parts. This contrast defines distinct risk and growth profiles for investors assessing exposure to semiconductor hardware versus component innovation.
Income Statement Comparison
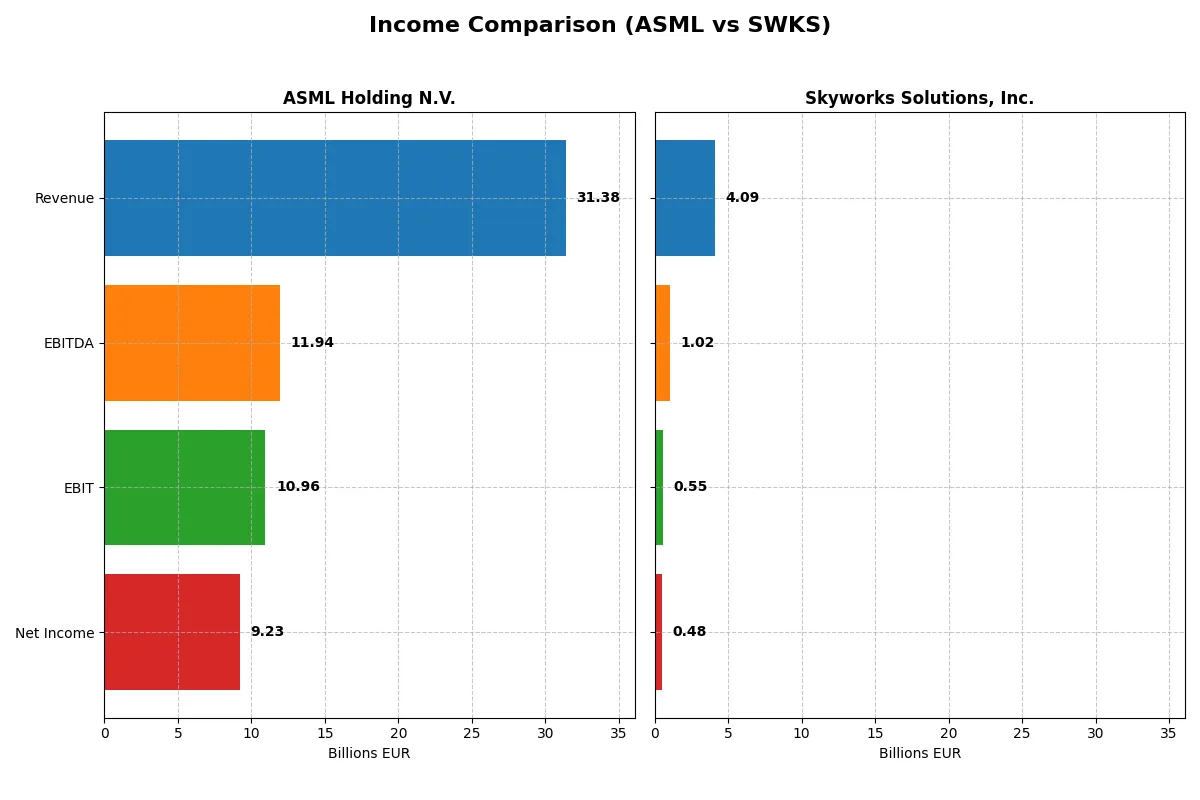
The following data dissects the core profitability and scalability of both corporate engines to reveal who dominates the bottom line:
| Metric | ASML Holding N.V. (ASML) | Skyworks Solutions, Inc. (SWKS) |
|---|---|---|
| Revenue | 31.4B EUR | 4.1B USD |
| Cost of Revenue | 14.8B EUR | 2.4B USD |
| Operating Expenses | 5.7B EUR | 1.2B USD |
| Gross Profit | 16.6B EUR | 1.7B USD |
| EBITDA | 11.9B EUR | 1.0B USD |
| EBIT | 11.0B EUR | 554M USD |
| Interest Expense | 0 | 27M USD |
| Net Income | 9.2B EUR | 477M USD |
| EPS | 23.76 EUR | 3.09 USD |
| Fiscal Year | 2025 | 2025 |
Income Statement Analysis: The Bottom-Line Duel
This income statement comparison reveals which company runs a more efficient and profitable corporate engine through revenue, margin, and earnings analysis.
ASML Holding N.V. Analysis
ASML’s revenue climbed from 18.6B EUR in 2021 to 31.4B EUR in 2025, with net income rising from 5.9B to 9.2B EUR. Its gross margin holds strong at 52.8%, while net margin hits a healthy 29.4%. The 2025 jump in EBIT by 19% signals robust operational momentum and efficient cost control.
Skyworks Solutions, Inc. Analysis
Skyworks’ revenue slipped from 5.1B USD in 2021 to 4.1B USD in 2025, dragging net income down from 1.5B to 477M USD. Gross margin stays decent at 41.2%, but net margin shrinks to 11.7%. The 2025 decline in EBIT by 17% highlights weakening operational efficiency and margin pressure.
Sustained Growth vs. Margin Erosion
ASML clearly outperforms with double-digit revenue and net income growth, supported by superior margins. Skyworks faces a prolonged decline across all key profitability metrics. ASML’s profile suits investors prioritizing steady expansion and margin strength, while Skyworks reflects a riskier, deteriorating earnings base.
Financial Ratios Comparison
These vital ratios act as a diagnostic tool to expose the underlying fiscal health, valuation premiums, and capital efficiency of the companies compared below:
| Ratios | ASML Holding N.V. (ASML) | Skyworks Solutions, Inc. (SWKS) |
|---|---|---|
| ROE | 47.1% | 8.3% |
| ROIC | 34.1% | 6.4% |
| P/E | 38.3 | 24.9 |
| P/B | 18.0 | 2.07 |
| Current Ratio | 1.26 | 2.33 |
| Quick Ratio | 0.79 | 1.76 |
| D/E (Debt-to-Equity) | 0.14 | 0.21 |
| Debt-to-Assets | 5.4% | 15.2% |
| Interest Coverage | N/A | 18.5 |
| Asset Turnover | 0.62 | 0.52 |
| Fixed Asset Turnover | 3.81 | 2.95 |
| Payout Ratio | 26.5% | 90.7% |
| Dividend Yield | 0.69% | 3.63% |
| Fiscal Year | 2025 | 2025 |
Efficiency & Valuation Duel: The Vital Signs
Financial ratios serve as a company’s DNA, exposing hidden risks and operational strength that shape investment decisions.
ASML Holding N.V.
ASML demonstrates exceptional profitability with a 47.1% ROE and a 29.4% net margin, signaling strong operational efficiency. However, its valuation is stretched, trading at a high 38.3 P/E and 18.1 P/B ratios. The modest 0.69% dividend yield suggests ASML reinvests heavily in R&D for growth.
Skyworks Solutions, Inc.
Skyworks shows moderate profitability, with an 8.3% ROE and an 11.7% net margin, reflecting a more cautious growth profile. Its valuation is fair, with a 24.9 P/E and 2.1 P/B ratio, indicating reasonable market expectations. A solid 3.63% dividend yield rewards shareholders while supporting steady capital allocation.
Premium Valuation vs. Operational Safety
ASML commands a premium valuation backed by superior profitability but carries valuation risk. Skyworks balances moderate returns with a safer valuation and attractive dividend yield. Investors seeking growth with higher risk may favor ASML, while those prioritizing income and valuation discipline might prefer Skyworks.
Which one offers the Superior Shareholder Reward?
I see ASML Holding N.V. and Skyworks Solutions, Inc. follow contrasting distribution philosophies. ASML combines a moderate dividend yield near 0.97% with a sustainable payout ratio around 27%, backed by strong free cash flow (24.2/share). Its buyback program is less aggressive but steady, supporting share price appreciation. Skyworks yields a higher 3.63% dividend but pays out over 90% of earnings, risking sustainability. However, Skyworks offsets this with a robust buyback program and strong cash flow (7.16/share). Historically, I observe that ASML’s balanced approach favors long-term value, while Skyworks offers more immediate income but with higher risk. For 2026, I judge ASML offers a superior total return profile due to dividend sustainability and capital return discipline.
Comparative Score Analysis: The Strategic Profile
The radar chart reveals the fundamental DNA and trade-offs of ASML Holding N.V. and Skyworks Solutions, Inc., highlighting their core financial strengths and weaknesses:
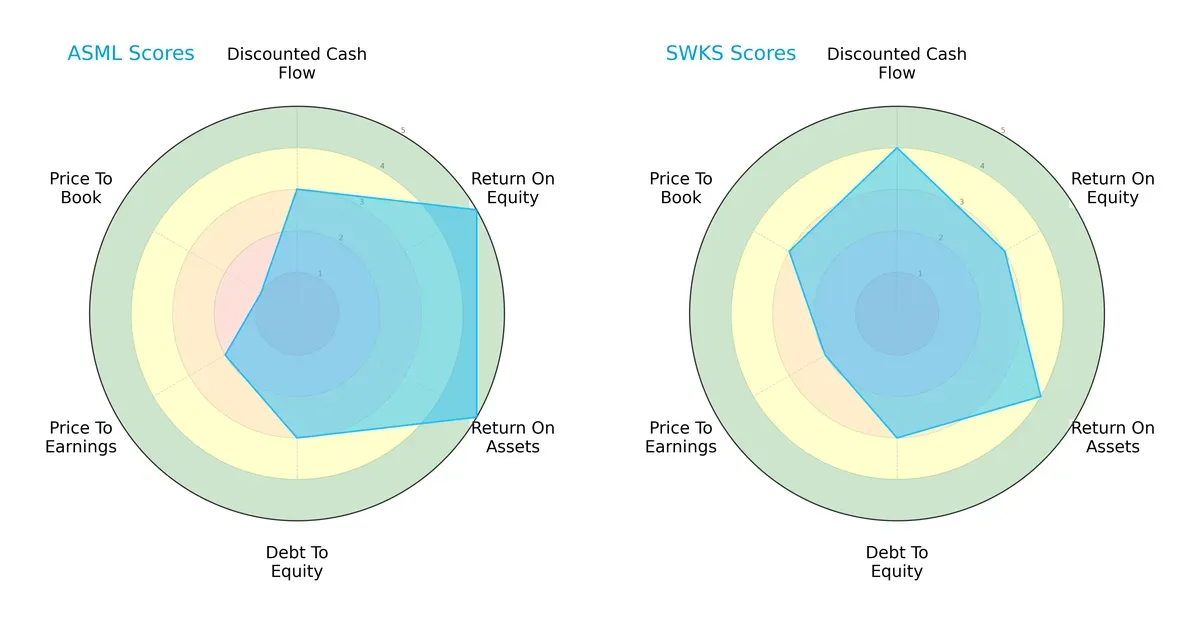
ASML excels in profitability with top ROE and ROA scores (5 each), indicating superior capital efficiency and asset utilization. Skyworks leads modestly in discounted cash flow (4 vs. 3) and maintains a stronger valuation balance, especially in price-to-book (3 vs. 1). Both show moderate debt-to-equity scores (3), but ASML’s very unfavorable price-to-book score signals potential overvaluation risks. Overall, ASML relies on operational excellence, while Skyworks presents a more balanced valuation and cash flow profile.
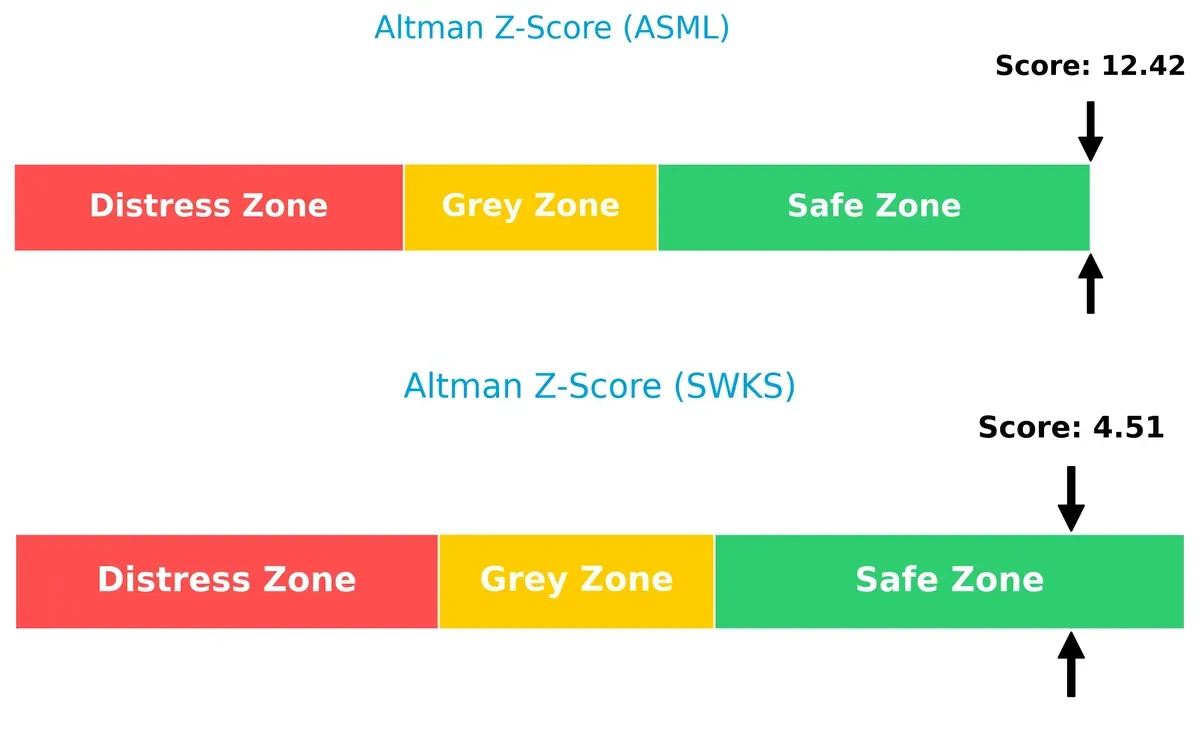
Bankruptcy Risk: Solvency Showdown
ASML’s Altman Z-Score (12.4) substantially outpaces Skyworks (4.5), placing both safely above distress zones but with ASML far more insulated from bankruptcy risk in this cycle:
Financial Health: Quality of Operations
ASML scores an 8 on the Piotroski F-Score, signaling very strong financial health. Skyworks follows closely at 7, indicating strong but slightly less robust operational metrics:
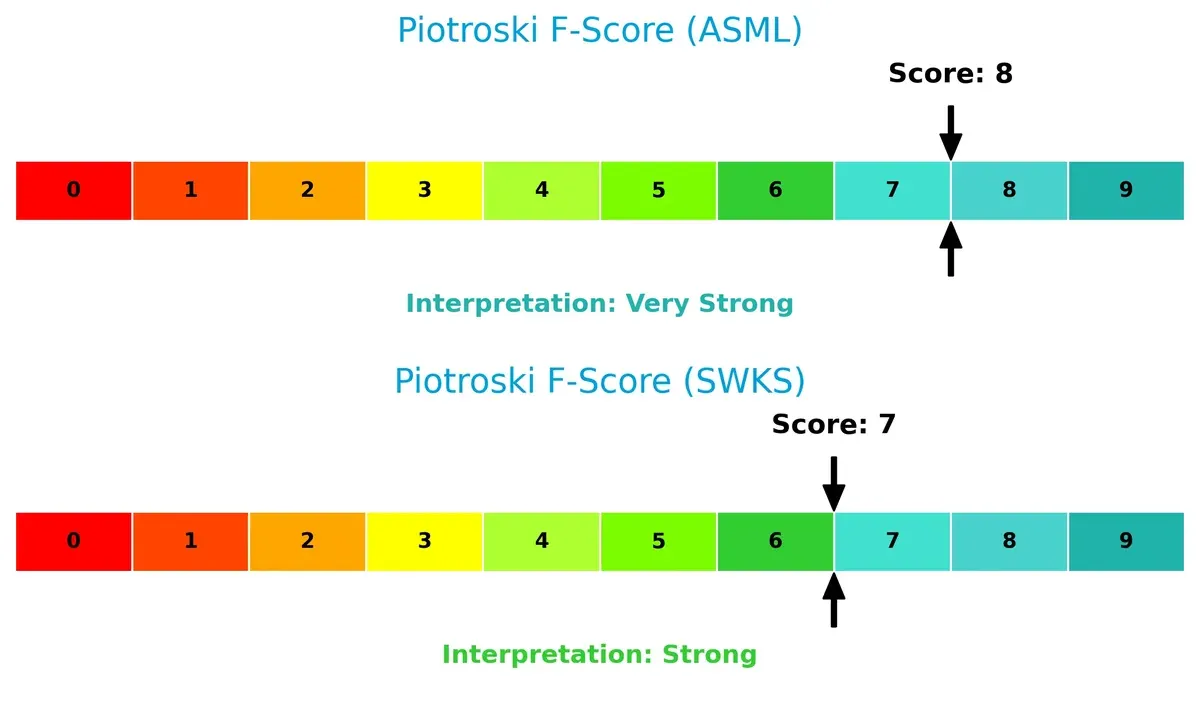
ASML’s near-peak score reflects excellent profitability, liquidity, and efficiency metrics. Skyworks, while solid, shows minor internal weaknesses relative to ASML’s near-flawless profile. Investors should weigh ASML’s operational strength against Skyworks’ more conservative valuation.
How are the two companies positioned?
This section dissects the operational DNA of ASML and SWKS by comparing their revenue distribution and internal dynamics. The goal is to confront their economic moats and identify which model offers the most resilient competitive advantage today.
Revenue Segmentation: The Strategic Mix
The following visual comparison dissects how both firms diversify their income streams and where their primary sector bets lie:
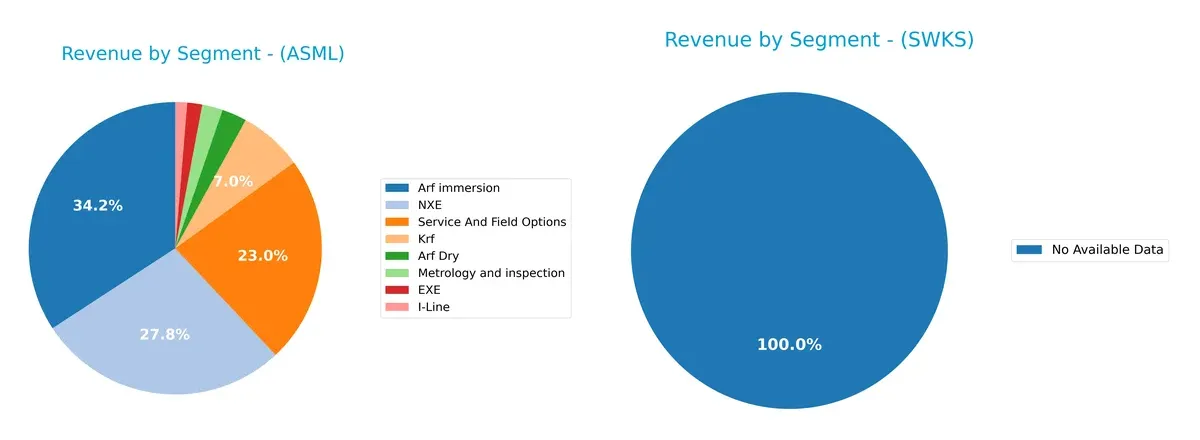
ASML Holding N.V. reveals a diverse revenue structure anchored by “Arf immersion” at 9.67B and “NXE” at 7.86B, complemented by significant service revenue of 6.49B. This balance reduces concentration risk and supports ecosystem lock-in. Skyworks Solutions, Inc. lacks available data, preventing a direct comparison. ASML’s varied segmentation reflects strategic infrastructure dominance in semiconductor lithography, crucial for its sustained moat.
Strengths and Weaknesses Comparison
This table compares the strengths and weaknesses of ASML Holding N.V. and Skyworks Solutions, Inc.:
ASML Strengths
- High profitability with net margin of 29.42%
- Strong ROE at 47.08%
- Robust ROIC of 34.14%
- Low debt levels with D/E at 0.14
- Wide global presence including China, Korea, Taiwan, and US
- Diverse product segments including EUV and Metrology
SWKS Strengths
- Favorable net margin of 11.67%
- Strong liquidity with current ratio at 2.33 and quick ratio at 1.76
- Low debt with D/E of 0.21 and good interest coverage
- Significant US revenue concentration with $3.2B
- Attractive dividend yield of 3.63%
- Balanced geographic exposure with Asia and EMEA markets
ASML Weaknesses
- Elevated valuation multiples with P/E of 38.33 and P/B of 18.05
- Quick ratio below 1 at 0.79 signals potential liquidity concern
- WACC higher than ROIC, indicating capital cost challenges
- Low dividend yield at 0.69%
- Moderate asset turnover at 0.62
- Heavy reliance on a few large markets like China and Korea
SWKS Weaknesses
- Low ROE of 8.29% questions profitability efficiency
- ROIC only neutral at 6.35%, close to WACC
- Moderate valuation metrics may limit upside
- Geographic concentration in the US could limit global diversification
- Neutral asset and fixed asset turnover ratios
- Lower net margin than ASML at 11.67%
Overall, ASML excels in profitability and global market diversification but faces valuation and liquidity challenges. Skyworks offers strong liquidity and dividend appeal but shows weaker profitability and geographic concentration risks. Each company’s profile suggests distinct strategic priorities in capital allocation and market focus.
The Moat Duel: Analyzing Competitive Defensibility
A structural moat is the only true shield protecting long-term profits from relentless competitive pressure. Here’s how two semiconductor players stack up:
ASML Holding N.V.: Technological Monopoly with Expanding Intellectual Property
ASML dominates through its intangible assets and unique EUV lithography technology. This moat delivers a high ROIC over WACC of 24%, sustaining margin stability and robust revenue growth. In 2026, new metrology systems and software upgrades should deepen its technological edge.
Skyworks Solutions, Inc.: Fragmented Market Niche with Cost Challenges
Skyworks relies primarily on cost advantage and diversified analog semiconductor products, but its ROIC trails below WACC by nearly 3%. Unlike ASML, its margin compression and declining profitability signal a weakening moat. Expansion in automotive and IoT markets may offer some relief but faces stiff disruption risks.
Technological Monopoly vs. Cost-Driven Struggle
ASML’s moat is not only wider but markedly deeper, supported by durable innovation and premium pricing power. Skyworks faces an uphill battle defending market share amid eroding returns. I see ASML as far better equipped to sustain profits against competition in 2026 and beyond.
Which stock offers better returns?
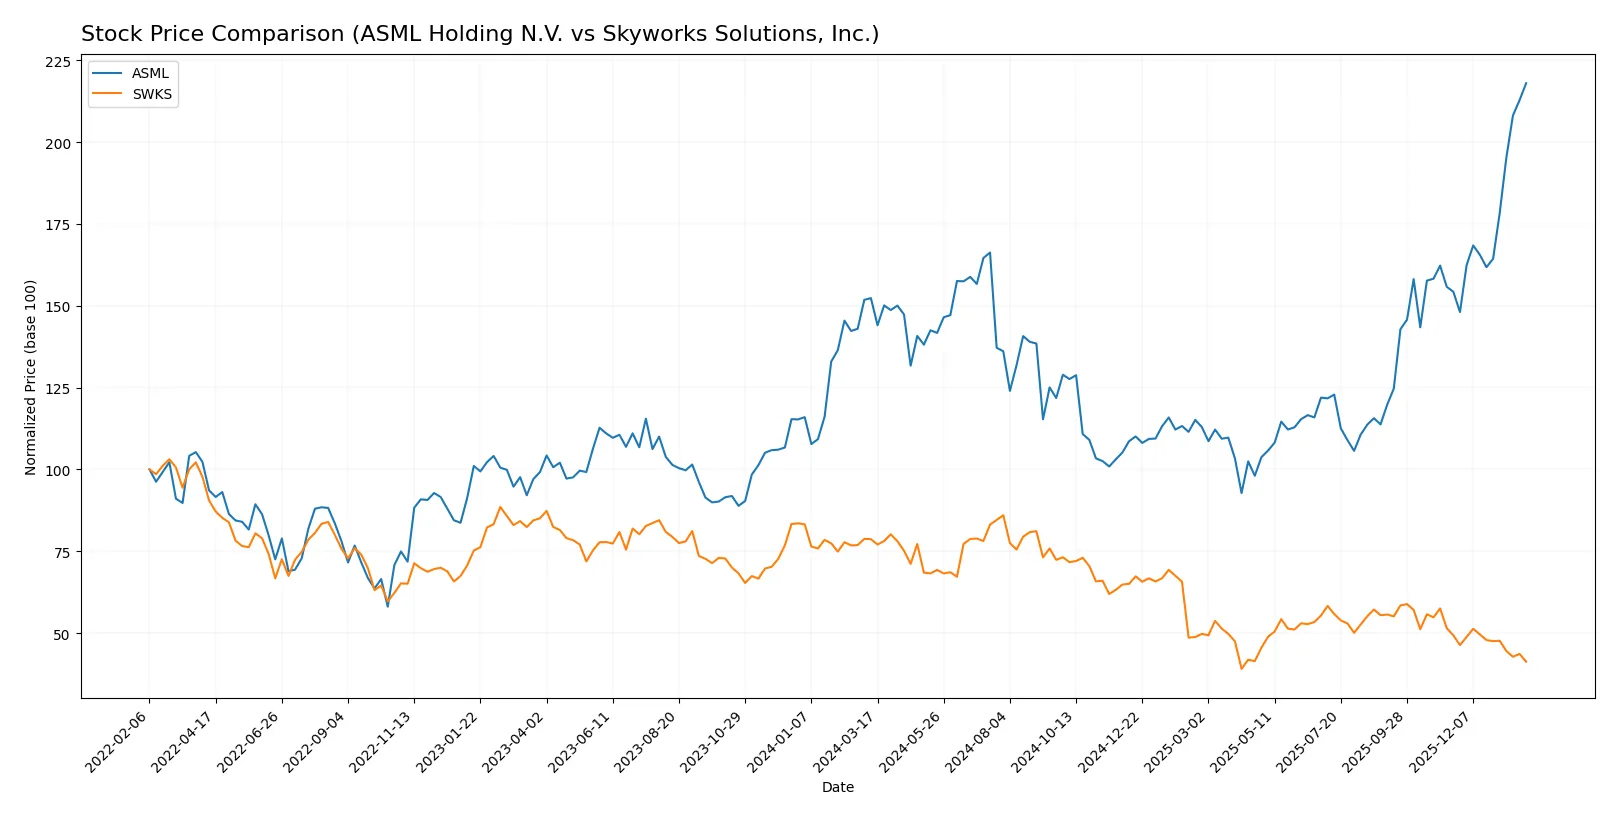
Over the past year, ASML Holding N.V. surged 43.11%, showing strong acceleration and a volatile trading pattern, while Skyworks Solutions, Inc. declined sharply by 47.55% with decelerating momentum.
Trend Comparison
ASML’s stock exhibits a bullish trend with a 43.11% rise over 12 months, accelerating price gains, and notable volatility indicated by a 170.09 standard deviation. The highest price reached 1423.0.
SWKS shows a bearish trend, falling 47.55% over the same period with decelerating losses and much lower volatility at 16.49 standard deviation. Its lowest price hit 52.78.
ASML outperformed SWKS significantly, delivering strong positive returns versus a steep decline for SWKS, making ASML the clear leader in market performance over the past year.
Target Prices
Analysts show a broad range of expectations for ASML Holding N.V. and Skyworks Solutions, Inc.
| Company | Target Low | Target High | Consensus |
|---|---|---|---|
| ASML Holding N.V. | 1,150 | 1,911 | 1,458.5 |
| Skyworks Solutions, Inc. | 60 | 140 | 80.9 |
The consensus target for ASML sits slightly above its current price of 1,423, indicating modest upside potential. Skyworks’ target consensus of 80.9 suggests significant room for appreciation from its current 55.76 level.

Don’t Let Luck Decide Your Entry Point
Optimize your entry points with our advanced ProRealTime indicators. You’ll get efficient buy signals with precise price targets for maximum performance. Start outperforming now!
How do institutions grade them?
The following tables summarize the latest reliable grades assigned to each company by leading financial institutions:
ASML Holding N.V. Grades
This table shows recent upgrades and maintained positive outlooks by major analysts.
| Grading Company | Action | New Grade | Date |
|---|---|---|---|
| Barclays | Upgrade | Overweight | 2026-01-29 |
| Wells Fargo | Maintain | Overweight | 2026-01-29 |
| RBC Capital | Maintain | Outperform | 2026-01-29 |
| Bernstein | Maintain | Outperform | 2026-01-22 |
| KGI Securities | Upgrade | Outperform | 2026-01-15 |
| Wells Fargo | Maintain | Overweight | 2026-01-15 |
| JP Morgan | Maintain | Overweight | 2026-01-14 |
| Bernstein | Upgrade | Outperform | 2026-01-05 |
| B of A Securities | Maintain | Buy | 2025-12-03 |
| JP Morgan | Maintain | Overweight | 2025-12-01 |
Skyworks Solutions, Inc. Grades
This table lists recent neutral ratings and some upgrades from previous weaker positions.
| Grading Company | Action | New Grade | Date |
|---|---|---|---|
| B. Riley Securities | Maintain | Neutral | 2026-01-26 |
| Mizuho | Maintain | Neutral | 2026-01-26 |
| Susquehanna | Maintain | Neutral | 2026-01-22 |
| UBS | Maintain | Neutral | 2026-01-20 |
| Mizuho | Upgrade | Neutral | 2025-11-11 |
| UBS | Maintain | Neutral | 2025-11-05 |
| JP Morgan | Maintain | Neutral | 2025-11-05 |
| Keybanc | Upgrade | Overweight | 2025-10-29 |
| Piper Sandler | Upgrade | Overweight | 2025-10-29 |
| Citigroup | Upgrade | Neutral | 2025-10-29 |
Which company has the best grades?
ASML consistently receives higher grades, including multiple “Outperform” and “Overweight” ratings from top firms. Skyworks mostly holds “Neutral” grades with some recent upgrades. ASML’s stronger consensus may imply greater institutional confidence and potential for upside.
Risks specific to each company
The following categories identify critical pressure points and systemic threats facing ASML Holding N.V. and Skyworks Solutions, Inc. in the 2026 market environment:
1. Market & Competition
ASML Holding N.V.
- Dominates advanced lithography with high barriers to entry but faces intense innovation pressure.
Skyworks Solutions, Inc.
- Competes in diverse semiconductor niches with strong competition and less differentiated products.
2. Capital Structure & Debt
ASML Holding N.V.
- Low debt-to-equity (0.14) and minimal leverage reduce financial risk.
Skyworks Solutions, Inc.
- Slightly higher debt levels (0.21 D/E) but maintains strong interest coverage.
3. Stock Volatility
ASML Holding N.V.
- Beta at 1.34 indicates above-market volatility, reflecting cyclicality in semiconductors.
Skyworks Solutions, Inc.
- Beta at 1.30 similarly shows moderate volatility aligned with sector trends.
4. Regulatory & Legal
ASML Holding N.V.
- Exposed to export controls due to EUV technology, increasing regulatory risks.
Skyworks Solutions, Inc.
- Faces U.S.-China trade tensions impacting supply and sales in key markets.
5. Supply Chain & Operations
ASML Holding N.V.
- Complex global supply chain with critical reliance on semiconductor materials and Asian fabs.
Skyworks Solutions, Inc.
- Broad product portfolio offers operational flexibility but depends on global component supply.
6. ESG & Climate Transition
ASML Holding N.V.
- High energy consumption in manufacturing; transitioning to greener tech remains a challenge.
Skyworks Solutions, Inc.
- Emphasizes sustainability in product design but faces pressure to reduce carbon footprint.
7. Geopolitical Exposure
ASML Holding N.V.
- Significant exposure to Asia-Pacific tensions and export restrictions from the Netherlands.
Skyworks Solutions, Inc.
- US-based but heavily reliant on Asian markets, vulnerable to geopolitical disruptions.
Which company shows a better risk-adjusted profile?
ASML’s most impactful risk is regulatory and geopolitical exposure due to its EUV technology and Asia-Pacific footprint. Skyworks’ key risk lies in competitive pressures and geopolitical supply chain vulnerabilities. ASML shows a stronger financial moat with superior profitability and balance sheet strength, but its valuation risks temper upside. Skyworks offers better liquidity ratios and dividend yield but weaker profitability and operational scale. Overall, ASML maintains a slightly better risk-adjusted profile given its technological leadership and robust financial health, despite heightened regulatory risks.
Final Verdict: Which stock to choose?
ASML’s superpower lies in its durable competitive advantage, reflected in a soaring ROIC well above its cost of capital. This cash-generating powerhouse commands a premium valuation, signaling confidence in sustained innovation. A point of vigilance is its relatively high price-to-book ratio, which may temper entry timing. It suits portfolios targeting aggressive growth with a tolerance for valuation risk.
Skyworks Solutions benefits from a strategic moat anchored in recurring revenue and solid balance sheet health. Its robust liquidity and attractive dividend yield offer better stability than ASML, despite weaker profitability metrics. Skyworks fits well in a GARP (Growth at a Reasonable Price) portfolio, appealing to investors seeking a blend of income and moderate growth.
If you prioritize long-term value creation and market leadership, ASML outshines due to its exceptional capital efficiency and growth trajectory. However, if you seek defensive qualities with steady cash flow and income, Skyworks offers better stability and income potential at a more reasonable valuation. Each choice presents distinct risk-reward profiles aligned with specific investor strategies.
Disclaimer: Investment carries a risk of loss of initial capital. The past performance is not a reliable indicator of future results. Be sure to understand risks before making an investment decision.
Go Further
I encourage you to read the complete analyses of ASML Holding N.V. and Skyworks Solutions, Inc. to enhance your investment decisions: