Home > Comparison > Technology > ASML vs SKYT
The strategic rivalry between ASML Holding N.V. and SkyWater Technology, Inc. defines the semiconductor industry’s evolution. ASML operates as a capital-intensive leader, producing advanced lithography equipment for chipmakers worldwide. In contrast, SkyWater focuses on specialized semiconductor manufacturing services with a nimble, customer-centric model. This analysis explores which firm’s operational approach offers superior risk-adjusted returns in a sector marked by rapid innovation and cyclical demand shifts.
Table of contents
Companies Overview
ASML Holding N.V. and SkyWater Technology, Inc. stand as pivotal players in the semiconductor industry, each commanding unique roles in chipmaking innovation.
ASML Holding N.V.: Advanced Lithography Pioneer
ASML dominates the semiconductor equipment market with its cutting-edge lithography and inspection systems. It generates revenue by selling and servicing extreme ultraviolet and deep ultraviolet lithography machines that enable advanced chip manufacturing. In 2026, ASML’s strategy centers on expanding its technological lead in computational lithography and system upgrades globally.
SkyWater Technology, Inc.: Specialized Semiconductor Manufacturer
SkyWater operates as a nimble semiconductor foundry, focusing on development and manufacturing services for silicon-based analog, power discrete, and rad-hard integrated circuits. Its revenue hinges on co-developing customized solutions across automotive, aerospace, and IoT sectors. In 2026, SkyWater emphasizes engineering innovation and customer partnerships to deepen its niche market penetration.
Strategic Collision: Similarities & Divergences
Both companies fuel the semiconductor ecosystem but diverge sharply: ASML leads with proprietary, capital-intensive equipment sales, while SkyWater embraces flexible, service-driven manufacturing. Their primary battleground lies in enabling next-generation chip capabilities—ASML through lithography precision, SkyWater through tailored fabrication. This contrast defines distinct investment profiles: ASML as a technological moat giant and SkyWater as a high-beta growth specialist.
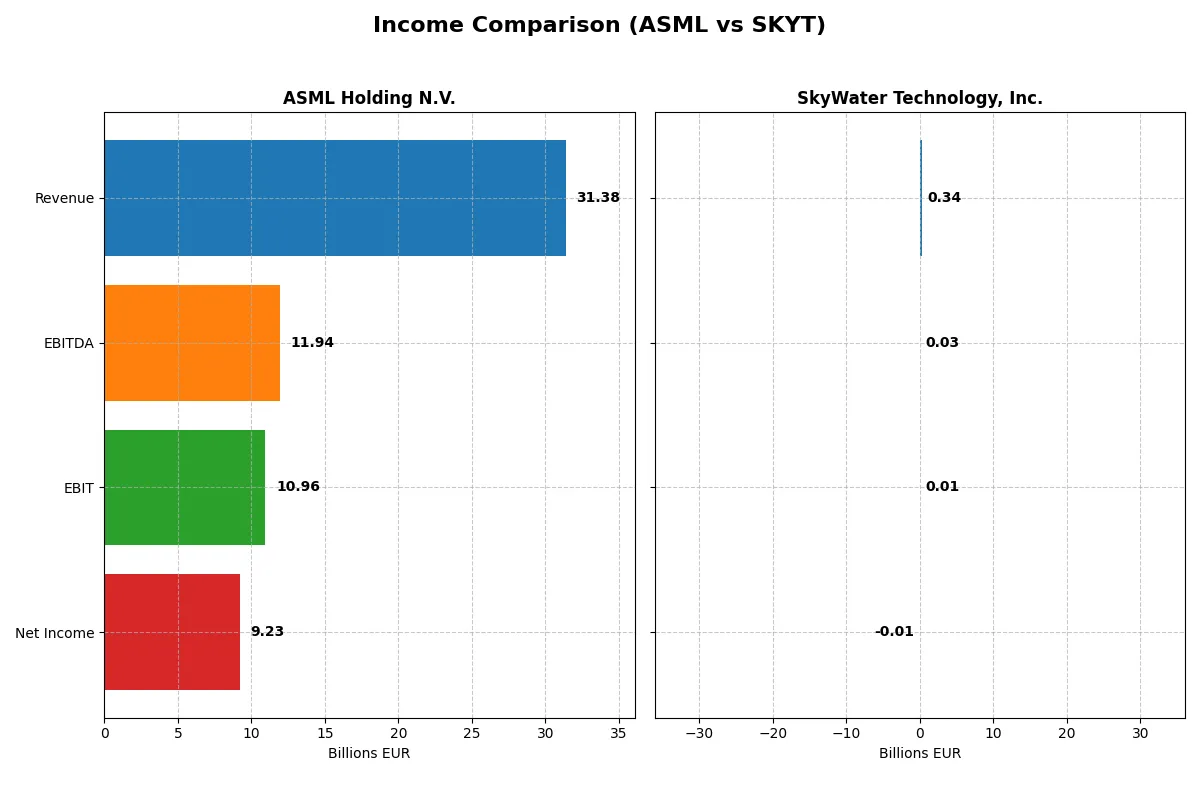
Income Statement Comparison
This data dissects the core profitability and scalability of both corporate engines to reveal who dominates the bottom line:
| Metric | ASML Holding N.V. (ASML) | SkyWater Technology, Inc. (SKYT) |
|---|---|---|
| Revenue | 31.4B EUR | 342M USD |
| Cost of Revenue | 14.8B EUR | 273M USD |
| Operating Expenses | 5.7B EUR | 63M USD |
| Gross Profit | 16.6B EUR | 70M USD |
| EBITDA | 11.9B EUR | 25M USD |
| EBIT | 11.0B EUR | 7M USD |
| Interest Expense | 0 | 9M USD |
| Net Income | 9.2B EUR | -7M USD |
| EPS | 23.76 EUR | -0.14 USD |
| Fiscal Year | 2025 | 2024 |
Income Statement Analysis: The Bottom-Line Duel
This income statement comparison unveils the true operational efficiency and profitability trends of two distinct corporate engines.
ASML Holding N.V. Analysis
ASML’s revenue surged from 18.6B EUR in 2021 to 31.4B EUR in 2025, a 68.6% growth reflecting strong market demand. Net income climbed 57% to 9.2B EUR, with a robust gross margin of 52.8% and net margin near 29.4%. The 2025 results highlight excellent margin expansion and operational leverage, underscoring ASML’s industry moat and capital efficiency.
SkyWater Technology, Inc. Analysis
SkyWater’s revenue grew 143.7% from 140M USD in 2020 to 342M USD in 2024, signaling rapid top-line momentum. However, net losses persisted, albeit narrowing to -6.8M USD in 2024 with a slim positive EBIT margin of 1.9%. Gross margin improved to 20.3%, indicating early progress, but negative net margins reflect ongoing investment and scale challenges in this development phase.
Margin Strength vs. Growth Ambition
ASML clearly dominates with sustained profitability, high margins, and impressive net income growth, benefiting from scale and technology leadership. SkyWater shows promising revenue acceleration but remains unprofitable, reflecting its growth-oriented stage and capital allocation towards R&D. For investors prioritizing stable returns and margin power, ASML’s profile stands out as more compelling.
Financial Ratios Comparison
These vital ratios act as a diagnostic tool exposing underlying fiscal health, valuation premiums, and capital efficiency for clear comparative insight:
| Ratios | ASML Holding N.V. (ASML) | SkyWater Technology, Inc. (SKYT) |
|---|---|---|
| ROE | 47.1% | -11.8% |
| ROIC | 34.1% | 3.4% |
| P/E | 38.3 | -100.3 |
| P/B | 18.0 | 11.8 |
| Current Ratio | 1.26 | 0.86 |
| Quick Ratio | 0.79 | 0.76 |
| D/E (Debt-to-Equity) | 0.14 | 1.33 |
| Debt-to-Assets | 5.4% | 24.5% |
| Interest Coverage | N/A | 0.74 |
| Asset Turnover | 0.62 | 1.09 |
| Fixed Asset Turnover | 3.81 | 2.07 |
| Payout Ratio | 26.5% | 0% |
| Dividend Yield | 0.69% | 0% |
| Fiscal Year | 2025 | 2024 |
Efficiency & Valuation Duel: The Vital Signs
Ratios act as a company’s DNA, revealing hidden risks and operational excellence that numbers alone cannot fully capture.
ASML Holding N.V.
ASML boasts a robust 47.08% ROE and a strong 29.42% net margin, signaling high profitability. Its P/E of 38.33 and P/B of 18.05 indicate the stock trades at a premium. The company supports shareholders with a modest 0.69% dividend yield while reinvesting aggressively in R&D, sustaining long-term growth.
SkyWater Technology, Inc.
SkyWater shows weak fundamentals with a negative 11.79% ROE and a -1.98% net margin, reflecting operational struggles. Its P/E is negative but flagged favorable due to losses, while a high debt-to-equity (1.33) signals leverage risks. No dividends are paid; capital focuses on maintaining operations and incremental R&D.
Premium Valuation vs. Operational Fragility
ASML combines operational efficiency with premium valuation, offering a balanced risk-reward profile. SkyWater’s metrics reveal financial instability and elevated leverage, increasing risk. Investors seeking operational strength may favor ASML, while those open to high risk might consider SkyWater’s turnaround potential.
Which one offers the Superior Shareholder Reward?
I see ASML Holding N.V. delivers a clear shareholder reward through a steady dividend yield near 0.97% and a moderate payout ratio of 27%. Its robust free cash flow of 24B EUR supports sustainable dividends and sizable buybacks, enhancing total return. Conversely, SkyWater Technology, Inc. pays no dividend, reflecting its early-stage growth focus. SKYT’s weak profitability and free cash flow under 0.2B USD limit immediate shareholder distributions. Its reinvestment in R&D and capacity expansion aims at long-term value but lacks near-term reward. ASML’s disciplined capital allocation and buyback program outperform SKYT’s reinvestment gamble. For 2026 investors, ASML offers a more attractive, sustainable total return profile.
Comparative Score Analysis: The Strategic Profile
The radar chart reveals the fundamental DNA and trade-offs of ASML Holding N.V. and SkyWater Technology, Inc., highlighting their distinct financial strengths and weaknesses:
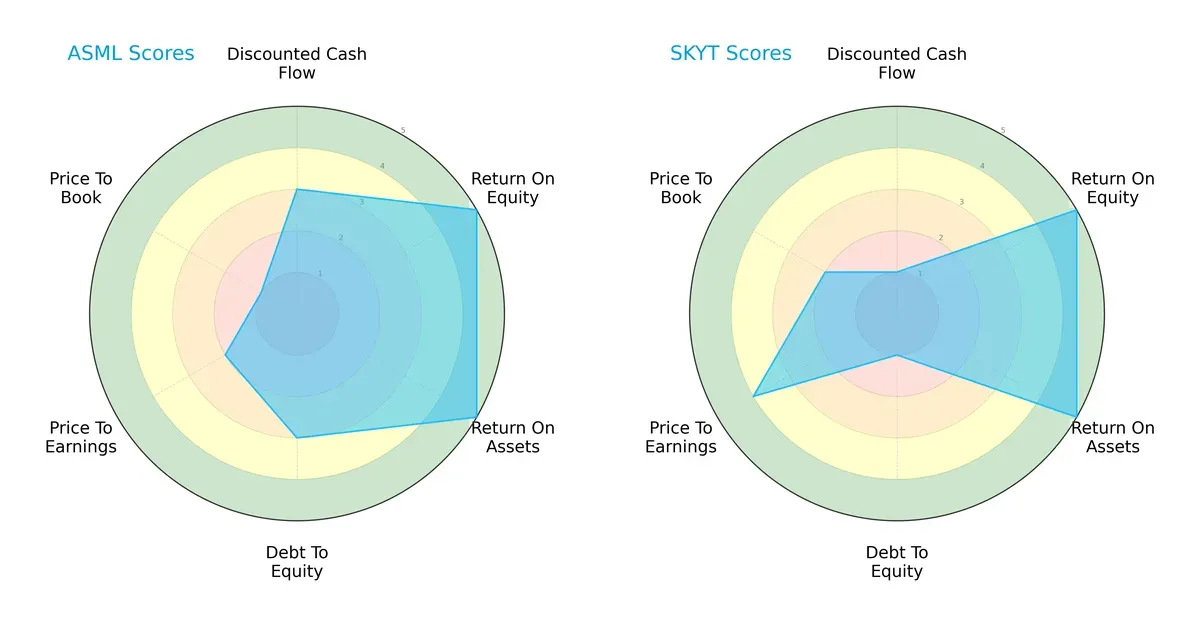
ASML shows a balanced profile with strong ROE and ROA (both top scores of 5), moderate DCF and debt levels, but weaker valuation metrics (P/E at 2 and P/B at 1). SkyWater matches ASML in profitability (ROE and ROA at 5) but struggles with debt (score 1) and DCF (score 1) while offering more favorable valuation scores (P/E at 4 and P/B at 2). ASML relies on operational excellence, whereas SkyWater leans on valuation appeal amid financial risk.
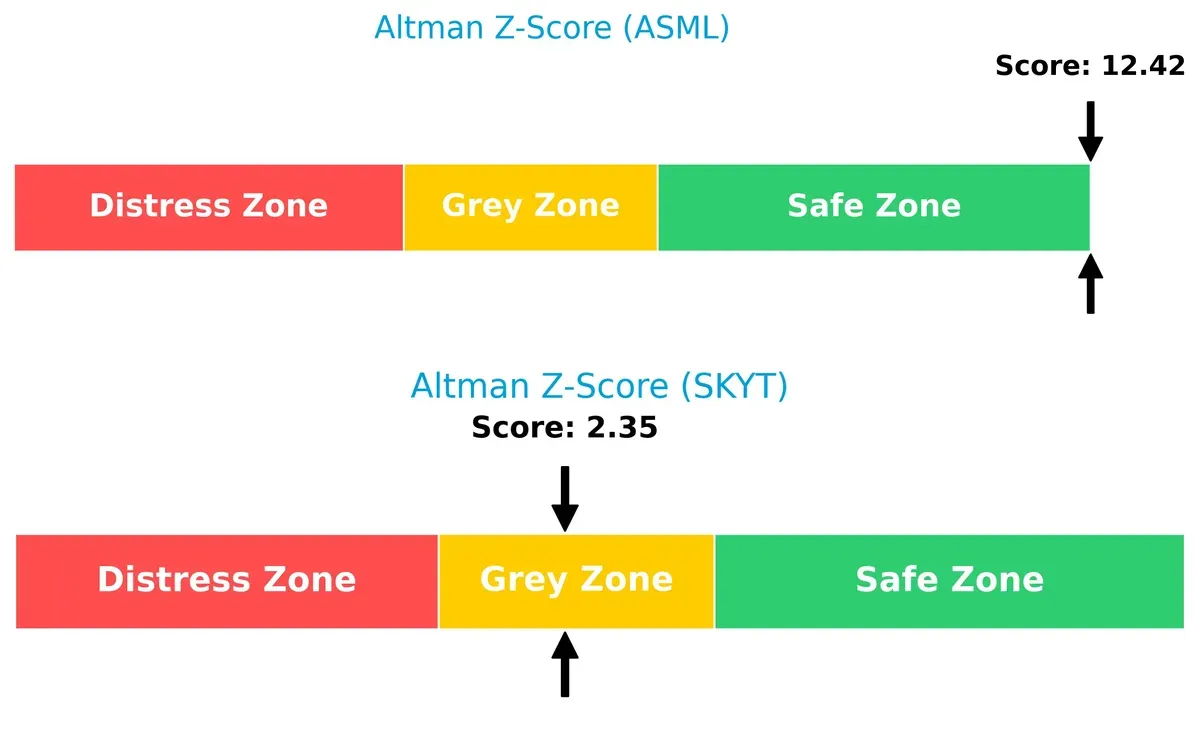
Bankruptcy Risk: Solvency Showdown
ASML’s Altman Z-Score of 12.4 places it firmly in the safe zone, signaling robust long-term solvency. SkyWater’s 2.35 score falls into the grey zone, indicating moderate bankruptcy risk in this cycle:
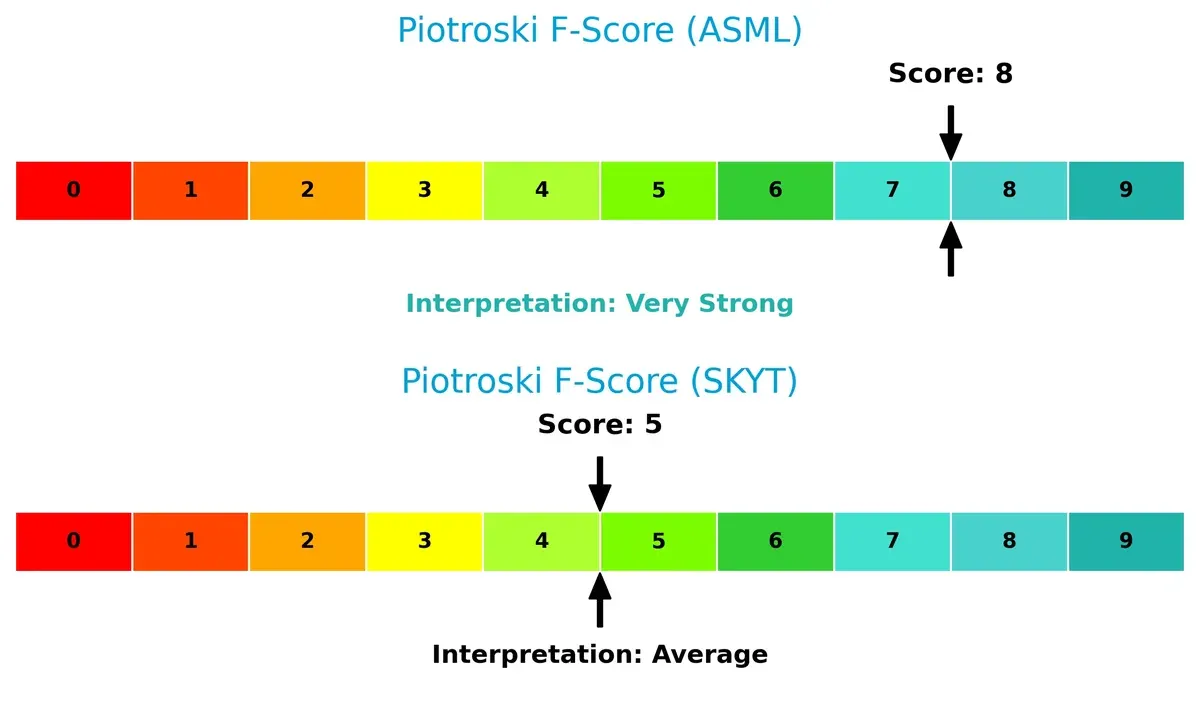
Financial Health: Quality of Operations
ASML’s Piotroski F-Score of 8 demonstrates very strong internal financial health and operational quality. SkyWater’s score of 5 is average, suggesting potential red flags in financial consistency or efficiency relative to ASML:
How are the two companies positioned?
This section dissects ASML and SkyWater’s operational DNA by comparing their revenue distribution and internal strengths and weaknesses. The goal is to confront their economic moats and identify which business model offers the most resilient and sustainable competitive advantage today.
Revenue Segmentation: The Strategic Mix
This visual comparison dissects how ASML Holding N.V. and SkyWater Technology, Inc. diversify their income streams and highlights their primary sector bets:
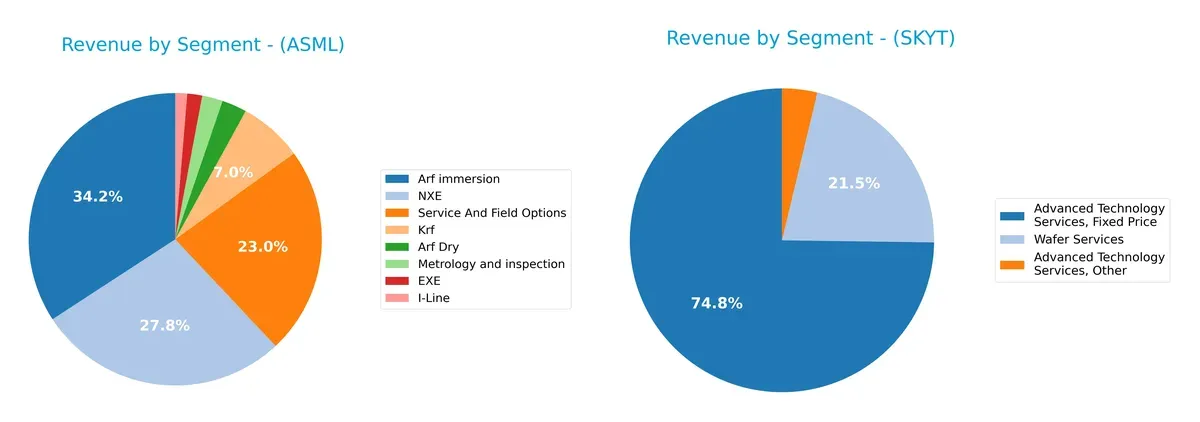
ASML’s revenues pivot around a few dominant segments like Arf immersion (9.67B) and NXE (7.86B), anchoring its semiconductor equipment dominance. It balances this with substantial service income (6.49B). SkyWater relies heavily on Advanced Technology Services, especially Fixed Price (93M) and Time And Materials (not in 2024), indicating a narrower focus. ASML’s broad product ecosystem reduces concentration risk, while SkyWater carries more revenue concentration risk due to its service-heavy model.
Strengths and Weaknesses Comparison
This table compares the strengths and weaknesses of ASML Holding N.V. and SkyWater Technology, Inc.:
ASML Strengths
- High profitability with 29.42% net margin and 47.08% ROE
- Strong capital efficiency: 34.14% ROIC above 10.08% WACC
- Low leverage: debt-to-assets 5.36%
- Broad global presence including China, Korea, Taiwan, US
- Diversified product portfolio with advanced lithography systems
- Favorable fixed asset turnover at 3.81
SKYT Strengths
- Asset turnover of 1.09 indicates efficient asset use
- Favorable debt-to-assets ratio at 24.46%
- Some geographic diversification with presence in US, Canada, Hong Kong
- Favorable PE ratio despite losses suggests market expectation of turnaround
ASML Weaknesses
- High valuation multiples: PE 38.33 and PB 18.05 may limit upside
- Quick ratio 0.79 signals liquidity risk
- WACC at 10.08% is relatively high
- Dividend yield low at 0.69%
- Some geographic revenue concentration in China and Korea
SKYT Weaknesses
- Negative profitability: -1.98% net margin, -11.79% ROE, 3.4% ROIC below 19.82% WACC
- High leverage: debt-to-equity 1.33 and interest coverage below 1
- Weak liquidity with current and quick ratios below 1
- Limited global presence mainly US-centric
- Negative dividend yield and unfavorable PB ratio
ASML shows robust profitability and operational strength but faces valuation and liquidity caution. SKYT struggles with profitability and leverage but maintains efficient asset use and a potential growth outlook. Each company’s profile reveals distinct strategic challenges and opportunities.
The Moat Duel: Analyzing Competitive Defensibility
A structural moat alone preserves long-term profits from relentless competitive pressure. Let’s dissect how moats secure ASML and SkyWater’s futures:
ASML Holding N.V.: Technological Innovation & Scale Moat
ASML’s moat stems from its advanced lithography technology, an intangible asset with near-monopoly status. This delivers a robust 24% ROIC premium over WACC and stable 53% gross margins. Expansion in EUV systems deepens its moat in 2026, despite geopolitical risks.
SkyWater Technology, Inc.: Niche Manufacturing & Growth Potential
SkyWater’s moat hinges on specialized semiconductor manufacturing services, contrasting ASML’s scale. It posts a negative ROIC vs. WACC, signaling value destruction, but rapid ROIC growth and 19% revenue growth suggest rising competitive strength and market niche expansion.
Verdict: Monopoly Innovation vs. Emerging Specialized Growth
ASML holds a wider, deeper moat with durable economic profits and tech leadership. SkyWater shows promise in growing profitability but remains a value destroyer. ASML is better equipped to defend market share long-term.
Which stock offers better returns?
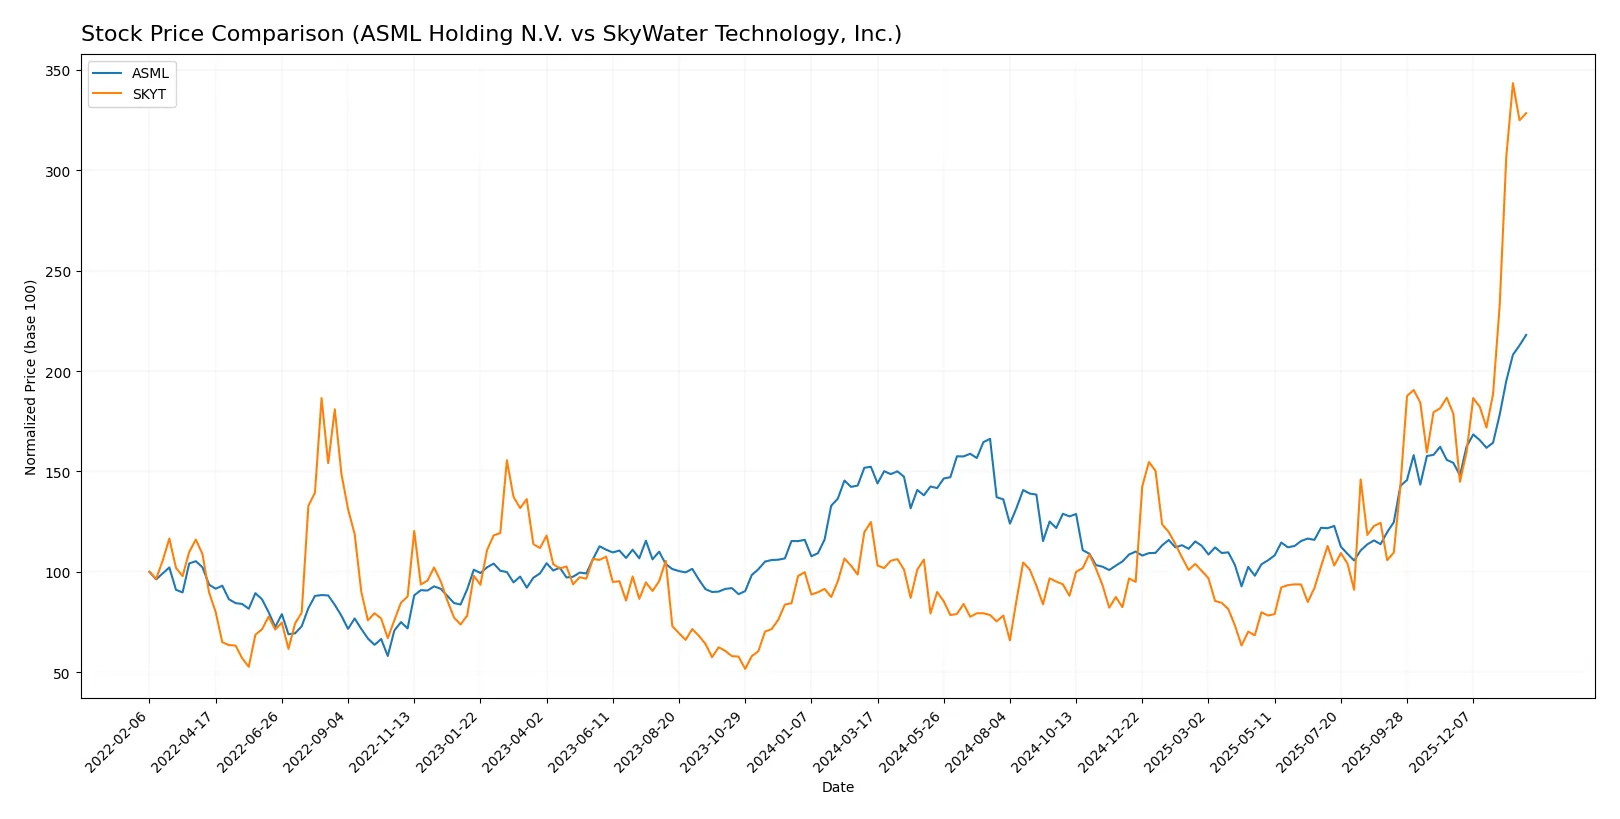
Both ASML Holding N.V. and SkyWater Technology, Inc. exhibit strong price appreciation over the past year, with notable acceleration and distinct volatility characteristics.
Trend Comparison
ASML’s stock rose 43.11% over the past year, showing a bullish trend with accelerating momentum. It reached a high of 1423 and a low of 605.55, accompanied by high volatility (std dev 170.09).
SkyWater Technology surged 163.18% in the same period, also bullish with acceleration. It traded between 6.1 and 33.1, displaying much lower volatility (std dev 5.3).
SkyWater outperformed ASML in market performance, delivering nearly four times the percentage gain over the past year.
Target Prices
Analysts show a broad but constructive target range for ASML Holding N.V. and a firm target for SkyWater Technology, Inc.
| Company | Target Low | Target High | Consensus |
|---|---|---|---|
| ASML Holding N.V. | 1150 | 1911 | 1458.5 |
| SkyWater Technology, Inc. | 35 | 35 | 35 |
ASML’s consensus target of 1458.5 slightly exceeds its current price of 1423, indicating moderate upside potential. SkyWater’s target of 35 is above its current 31.66, suggesting optimistic analyst expectations.

Don’t Let Luck Decide Your Entry Point
Optimize your entry points with our advanced ProRealTime indicators. You’ll get efficient buy signals with precise price targets for maximum performance. Start outperforming now!
How do institutions grade them?
ASML Holding N.V. Grades
The following table summarizes recent grades from reputable financial institutions for ASML Holding N.V.:
| Grading Company | Action | New Grade | Date |
|---|---|---|---|
| Barclays | Upgrade | Overweight | 2026-01-29 |
| Wells Fargo | Maintain | Overweight | 2026-01-29 |
| RBC Capital | Maintain | Outperform | 2026-01-29 |
| Bernstein | Maintain | Outperform | 2026-01-22 |
| KGI Securities | Upgrade | Outperform | 2026-01-15 |
| Wells Fargo | Maintain | Overweight | 2026-01-15 |
| JP Morgan | Maintain | Overweight | 2026-01-14 |
| Bernstein | Upgrade | Outperform | 2026-01-05 |
| B of A Securities | Maintain | Buy | 2025-12-03 |
| JP Morgan | Maintain | Overweight | 2025-12-01 |
SkyWater Technology, Inc. Grades
This table presents recent institutional grades for SkyWater Technology, Inc. from established financial firms:
| Grading Company | Action | New Grade | Date |
|---|---|---|---|
| Needham | Downgrade | Hold | 2026-01-27 |
| Piper Sandler | Downgrade | Neutral | 2026-01-27 |
| TD Cowen | Downgrade | Hold | 2026-01-27 |
| Piper Sandler | Maintain | Overweight | 2025-11-06 |
| Needham | Maintain | Buy | 2025-11-06 |
| TD Cowen | Maintain | Buy | 2025-11-06 |
| Needham | Maintain | Buy | 2025-08-07 |
| Needham | Maintain | Buy | 2025-05-08 |
| Needham | Maintain | Buy | 2025-02-27 |
| Needham | Maintain | Buy | 2024-11-11 |
Which company has the best grades?
ASML Holding consistently receives strong grades, mostly “Outperform” and “Overweight,” with recent upgrades signaling positive outlooks. SkyWater Technology’s recent downgrades to “Hold” and “Neutral” reflect caution. Investors may interpret ASML’s grades as a sign of greater institutional confidence and stability.
Risks specific to each company
The following categories identify the critical pressure points and systemic threats facing ASML Holding N.V. and SkyWater Technology, Inc. in the 2026 market environment:
1. Market & Competition
ASML Holding N.V.
- Dominates advanced semiconductor equipment with strong moats in EUV lithography. Faces intense competition from other chip equipment makers.
SkyWater Technology, Inc.
- Smaller player in semiconductor manufacturing services, competing in niche segments with limited scale and higher volatility.
2. Capital Structure & Debt
ASML Holding N.V.
- Maintains low debt-to-equity (0.14), strong interest coverage, and conservative leverage.
SkyWater Technology, Inc.
- High debt-to-equity (1.33) signals financial risk; weak interest coverage (0.74) raises solvency concerns.
3. Stock Volatility
ASML Holding N.V.
- Beta of 1.34 indicates moderate volatility consistent with tech sector norms.
SkyWater Technology, Inc.
- High beta at 3.49 reflects significant stock price swings and higher investor risk.
4. Regulatory & Legal
ASML Holding N.V.
- Subject to export controls and trade tensions involving China and the Netherlands.
SkyWater Technology, Inc.
- Faces typical US regulatory scrutiny; potential defense contracting compliance risks due to aerospace exposure.
5. Supply Chain & Operations
ASML Holding N.V.
- Complex global supply chain with exposure to Asia; strong operational scale supports resilience.
SkyWater Technology, Inc.
- More vulnerable to supply disruptions due to smaller scale and less diversified manufacturing base.
6. ESG & Climate Transition
ASML Holding N.V.
- Advanced sustainability initiatives; ESG increasingly vital for customer retention and regulatory compliance.
SkyWater Technology, Inc.
- Early-stage ESG programs; risk of lagging peers in climate transition pressures.
7. Geopolitical Exposure
ASML Holding N.V.
- Exposure to geopolitical tensions in Asia-Pacific and Europe impacts supply and sales.
SkyWater Technology, Inc.
- Primarily US-focused; geopolitical risks more limited but present in defense sector contracts.
Which company shows a better risk-adjusted profile?
ASML’s dominant market position and robust capital structure mitigate many risks, despite geopolitical and regulatory pressures. SkyWater’s elevated financial leverage, high stock volatility, and operational scale create a riskier profile. ASML’s Altman Z-score in the safe zone (12.42) contrasts with SkyWater’s grey zone (2.35), underscoring greater financial stability. The critical risk for ASML lies in geopolitical export restrictions, while SkyWater’s vulnerability centers on capital structure and liquidity. Investors seeking a better risk-adjusted balance should favor ASML, which benefits from strong moats and prudent financial management amid 2026’s challenging semiconductor landscape.
Final Verdict: Which stock to choose?
ASML’s superpower lies in its durable competitive advantage and unmatched capital efficiency, evidenced by consistently high ROIC well above its cost of capital. Its main point of vigilance is the rich valuation multiples, which could pressure returns if growth slows. This stock fits well in an Aggressive Growth portfolio that can tolerate valuation risk for quality.
SkyWater Technology’s strategic moat centers on its niche in semiconductor manufacturing with promising revenue growth and improving profitability. It offers a safety profile that’s less robust than ASML’s, marked by weaker liquidity and higher leverage. SkyWater suits a GARP (Growth at a Reasonable Price) portfolio seeking upside amid operational turnarounds.
If you prioritize long-term value creation and stability backed by a strong moat, ASML is the compelling choice due to its proven profitability and market leadership. However, if you seek higher growth potential with an appetite for risk and operational improvements, SkyWater offers superior upside despite its financial headwinds. Each scenario demands careful risk management aligned to your investment style.
Disclaimer: Investment carries a risk of loss of initial capital. The past performance is not a reliable indicator of future results. Be sure to understand risks before making an investment decision.
Go Further
I encourage you to read the complete analyses of ASML Holding N.V. and SkyWater Technology, Inc. to enhance your investment decisions: