Home > Comparison > Technology > ASML vs SLAB
The strategic rivalry between ASML Holding N.V. and Silicon Laboratories Inc. shapes the semiconductor industry’s future. ASML operates as a capital-intensive leader in advanced lithography systems, while Silicon Labs focuses on high-margin, fabless mixed-signal solutions for IoT applications. This head-to-head pits manufacturing scale against innovation agility. This analysis aims to identify which business model offers superior risk-adjusted returns for a diversified portfolio in the evolving technology landscape.
Table of contents
Companies Overview
ASML Holding N.V. and Silicon Laboratories Inc. stand as key innovators in the semiconductor industry, shaping technology’s future.
ASML Holding N.V.: Advanced Lithography Leader
ASML dominates the semiconductor equipment market, generating revenue through cutting-edge lithography systems essential for chip manufacturing. In 2026, it focuses heavily on enhancing extreme ultraviolet lithography technology to maintain its competitive edge in producing smaller, more powerful chips.
Silicon Laboratories Inc.: Mixed-Signal Innovator
Silicon Labs operates as a fabless semiconductor company, specializing in analog and mixed-signal solutions for IoT applications. Its 2026 strategy centers on expanding wireless microcontrollers and sensor products for smart home, industrial, and medical markets, leveraging broad application diversity to fuel growth.
Strategic Collision: Similarities & Divergences
ASML and Silicon Labs differ fundamentally: ASML invests in capital-intensive manufacturing equipment, while Silicon Labs pursues a fabless, product-focused model. Their competition converges on semiconductor innovation but targets distinct value chains. ASML offers a robust moat via proprietary lithography, whereas Silicon Labs appeals with scalable IoT solutions, presenting contrasting risk and growth profiles.
Income Statement Comparison
This data dissects the core profitability and scalability of both corporate engines to reveal who dominates the bottom line:
| Metric | ASML Holding N.V. (ASML) | Silicon Laboratories Inc. (SLAB) |
|---|---|---|
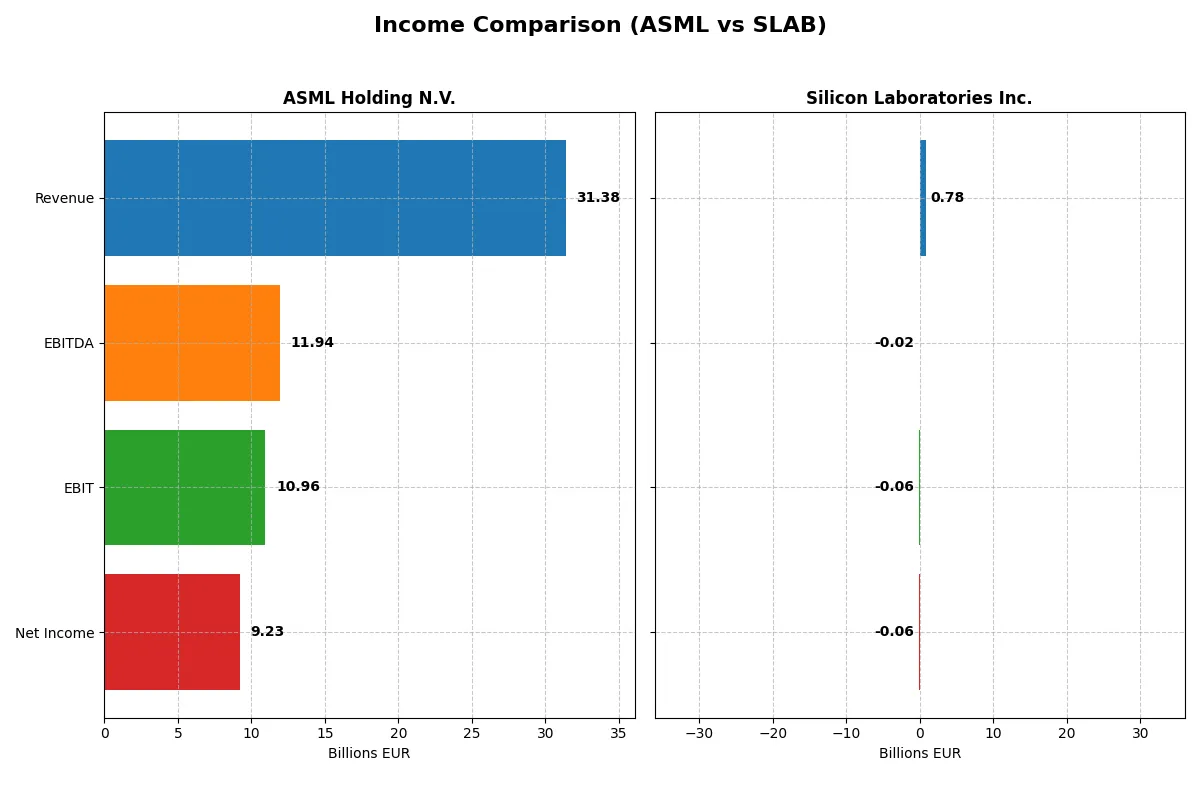
| Revenue | 31.4B EUR | 785M USD |
| Cost of Revenue | 14.8B EUR | 328M USD |
| Operating Expenses | 5.7B EUR | 528M USD |
| Gross Profit | 16.6B EUR | 457M USD |
| EBITDA | 11.9B EUR | -19M USD |
| EBIT | 11.0B EUR | -57M USD |
| Interest Expense | 0 | 975K USD |
| Net Income | 9.2B EUR | -65M USD |
| EPS | 23.76 EUR | -1.98 USD |
| Fiscal Year | 2025 | 2025 |
Income Statement Analysis: The Bottom-Line Duel
This income statement comparison reveals how efficiently each company converts revenue into profit, spotlighting their financial engines’ true power.
ASML Holding N.V. Analysis
ASML’s revenue rose steadily from 18.6B EUR in 2021 to 31.4B EUR in 2025, with net income climbing from 5.9B to 9.2B EUR. Gross and net margins remain robust at 52.8% and 29.4%, respectively. The 2025 year shows strong momentum, with EBIT up 19% and EPS surging 23%, underscoring operational efficiency and innovation-led growth.
Silicon Laboratories Inc. Analysis
Silicon Labs’ revenue grew from 721M USD in 2021 to 785M USD in 2025, yet net income stayed negative, hitting -65M USD in 2025. Despite a healthy gross margin of 58.2%, the EBIT margin stands at -7.3%, reflecting ongoing profitability challenges. The latest year shows notable improvement with a 34% revenue increase and 75% net margin growth, signaling a turnaround trajectory.
Margin Power vs. Recovery Potential
ASML dominates in absolute scale and profitability, boasting high and stable margins alongside strong growth metrics. Silicon Labs, while smaller and loss-making, demonstrates rapid revenue growth and margin recovery. For investors, the stable profit leader contrasts with a high-risk, high-potential growth profile, appealing to differing risk tolerances and investment horizons.
Financial Ratios Comparison
These vital ratios act as a diagnostic tool to expose the underlying fiscal health, valuation premiums, and capital efficiency of the companies compared below:
| Ratios | ASML Holding N.V. (ASML) | Silicon Laboratories Inc. (SLAB) |
|---|---|---|
| ROE | 47.1% | -5.9% |
| ROIC | 34.1% | -6.3% |
| P/E | 38.3 | -65.9 |
| P/B | 18.0 | 3.9 |
| Current Ratio | 1.26 | 4.69 |
| Quick Ratio | 0.79 | 4.02 |
| D/E | 0.14 | 0 |
| Debt-to-Assets | 5.4% | 0 |
| Interest Coverage | 0 | -72.3 |
| Asset Turnover | 0.62 | 0.62 |
| Fixed Asset Turnover | 3.81 | 6.10 |
| Payout ratio | 26.5% | 0 |
| Dividend yield | 0.69% | 0 |
| Fiscal Year | 2025 | 2025 |
Efficiency & Valuation Duel: The Vital Signs
Financial ratios serve as a company’s DNA, unveiling both hidden risks and operational strengths that shape investor decisions.
ASML Holding N.V.
ASML exhibits robust profitability with a 47.08% ROE and a strong 29.42% net margin, highlighting efficient core operations. The stock trades at a stretched P/E of 38.33 and a high P/B of 18.05, reflecting a premium valuation. Shareholder returns include modest dividends at 0.69%, supplemented by heavy reinvestment in R&D for growth.
Silicon Laboratories Inc.
Silicon Labs struggles with negative profitability metrics, including a -5.93% ROE and -8.27% net margin, signaling operational challenges. Despite a favorable negative P/E, the valuation remains questionable due to weak fundamentals. The firm pays no dividends, focusing instead on heavy R&D investment, which accounts for 45% of revenue, aiming to reverse losses.
Premium Valuation vs. Operational Safety
ASML balances high profitability and growth investment with a premium valuation, while Silicon Labs faces significant operational losses despite R&D focus. ASML offers a safer risk-reward profile. Growth-oriented investors may tolerate Silicon Labs’ volatility, but ASML suits those prioritizing operational excellence and stable returns.
Which one offers the Superior Shareholder Reward?
I see ASML Holding N.V. offers a balanced distribution with a 0.97% dividend yield and a moderate 34% payout ratio, backed by strong free cash flow (FCF) coverage near 88%. ASML also engages robustly in buybacks, amplifying total returns sustainably. Silicon Laboratories Inc. pays no dividends but reinvests heavily in R&D and growth, shown by negative margins and no buyback activity. While SLAB’s reinvestment may fuel future growth, its current financial struggles and lack of shareholder distributions make ASML the superior choice for 2026 total shareholder reward.
Comparative Score Analysis: The Strategic Profile
The radar chart reveals the fundamental DNA and trade-offs of ASML Holding N.V. and Silicon Laboratories Inc., highlighting their core financial strengths and vulnerabilities:
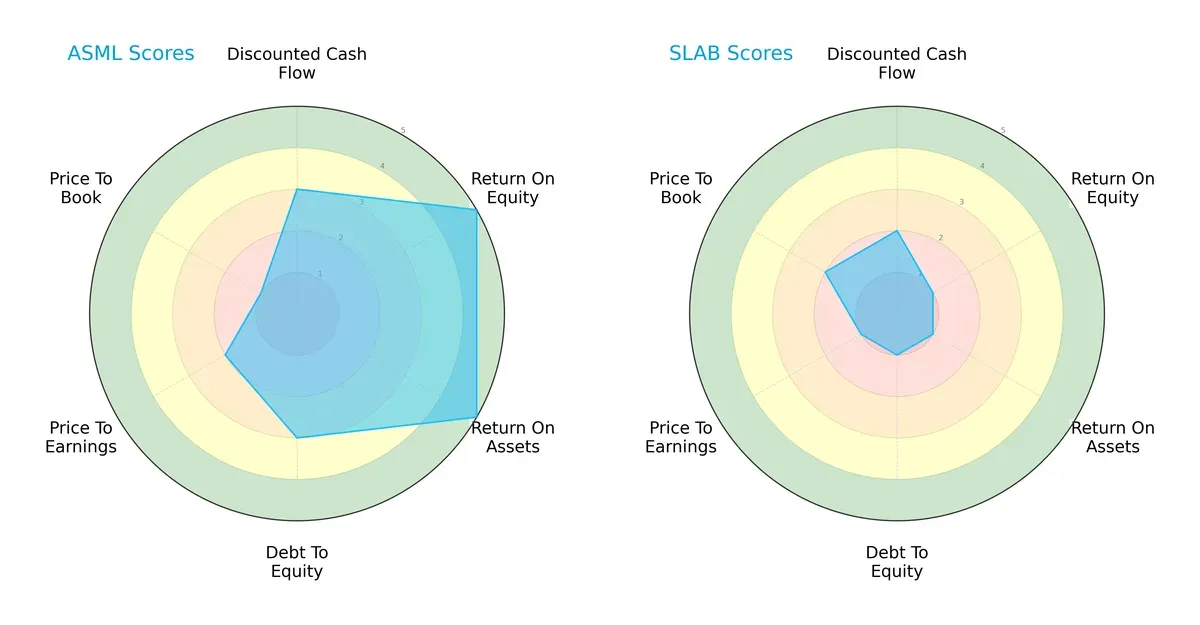
ASML displays a balanced profile with very favorable returns on equity and assets (ROE and ROA at 5), supported by moderate debt management (Debt/Equity at 3). Its valuation metrics (P/E and P/B) lag, indicating potential overpricing or investor caution. Conversely, Silicon Laboratories leans heavily on valuation metrics but suffers from very unfavorable profitability and leverage scores. ASML’s diversified strengths make it a more resilient choice, while SLAB depends on undervaluation to attract investors.
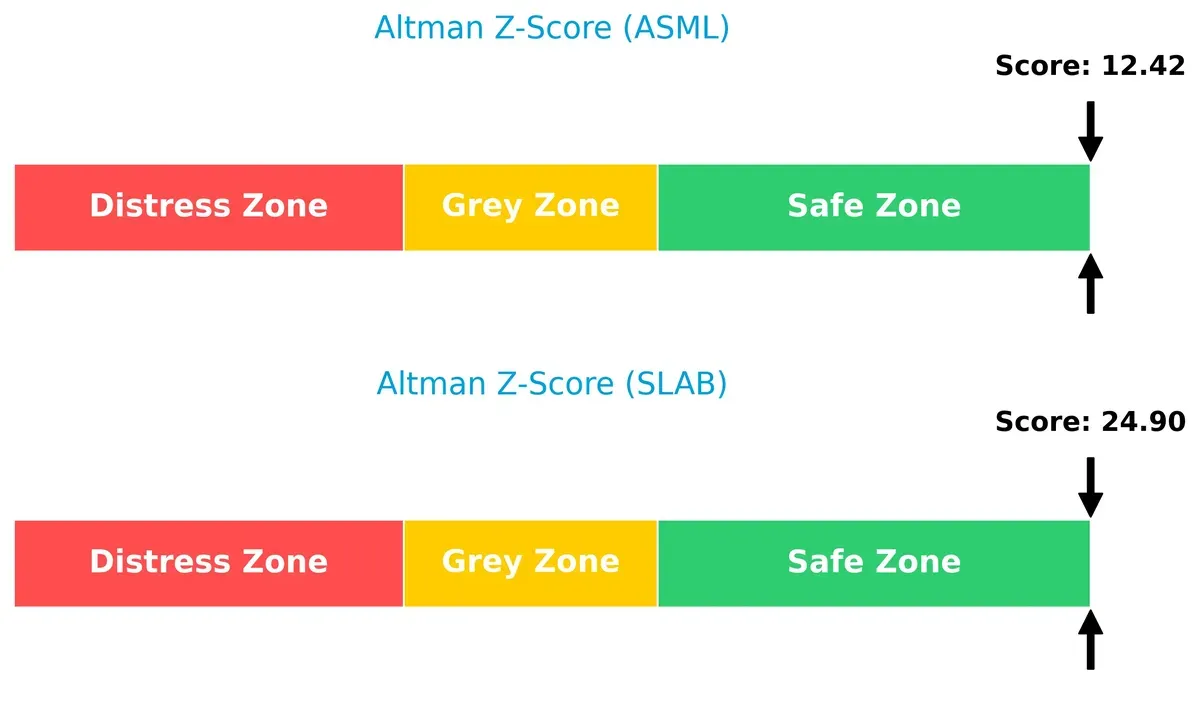
Bankruptcy Risk: Solvency Showdown
ASML’s Altman Z-Score stands at 12.4, while Silicon Laboratories reaches 24.9, both deep in the safe zone. This wide gap highlights SLAB’s exceptionally strong solvency relative to ASML, implying greater long-term survival confidence in this economic cycle:
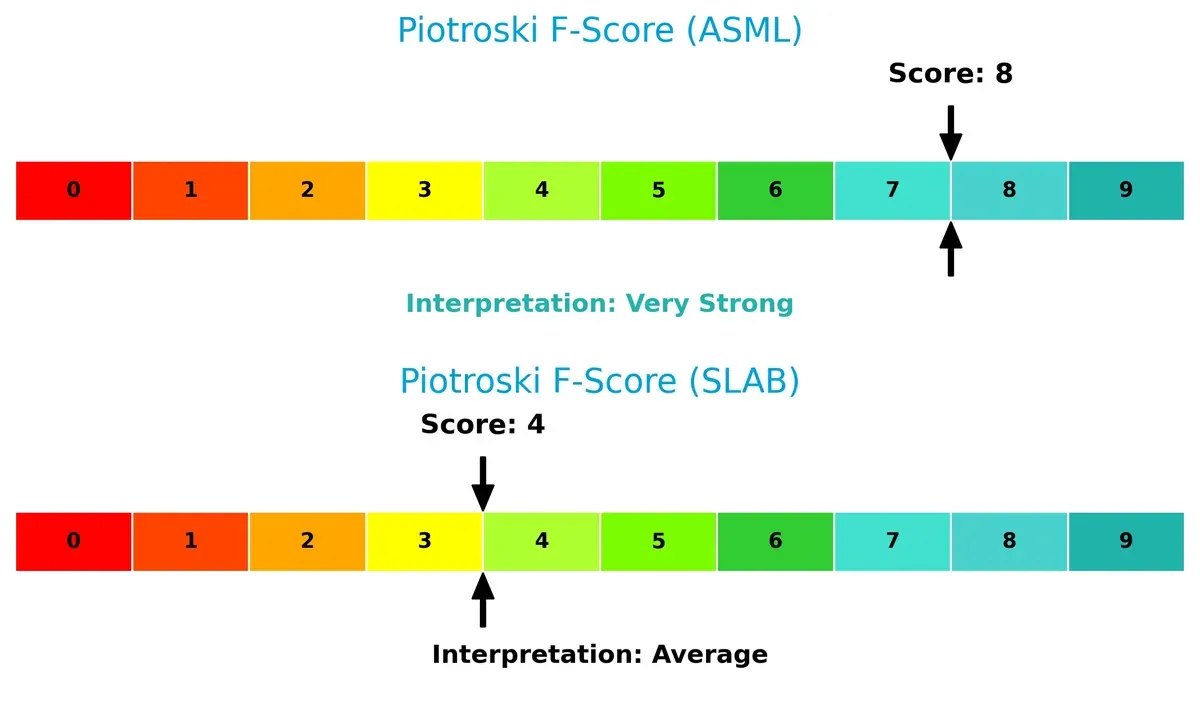
Financial Health: Quality of Operations
ASML scores an 8 on the Piotroski F-Score, signaling very strong financial health and operational efficiency. Silicon Laboratories lags at 4, reflecting average health with potential internal weaknesses that investors must monitor closely:
How are the two companies positioned?
This section dissects the operational DNA of ASML and SLAB by comparing their revenue distribution by segment and internal dynamics, including strengths and weaknesses. The goal is to confront their economic moats to reveal which business model offers the most resilient and sustainable competitive advantage today.
Revenue Segmentation: The Strategic Mix
The following visual comparison dissects how ASML Holding N.V. and Silicon Laboratories Inc. diversify their income streams and where their primary sector bets lie:
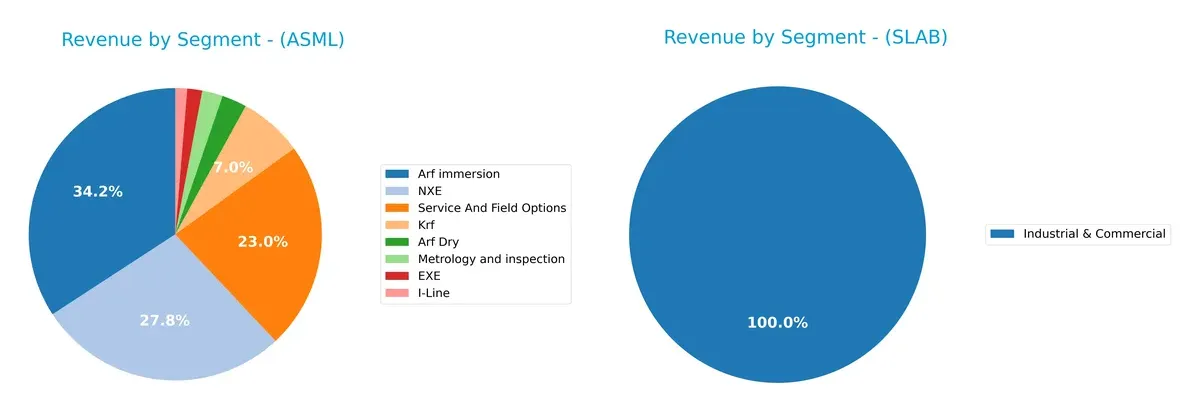
ASML displays a broad revenue base, with its Arf immersion segment anchoring at $9.67B and NXE trailing closely at $7.86B in 2024. Service and Field Options also contribute a substantial $6.49B, showcasing a well-diversified portfolio across multiple high-value segments. In contrast, Silicon Laboratories relies heavily on a single Industrial & Commercial segment, generating $339M in 2024. This concentration suggests higher concentration risk for SLAB, while ASML’s mix supports ecosystem lock-in and infrastructure dominance.
Strengths and Weaknesses Comparison
This table compares the strengths and weaknesses of ASML Holding N.V. and Silicon Laboratories Inc.:
ASML Strengths
- Strong profitability with 29.42% net margin and 47.08% ROE
- Favorable leverage with low debt-to-assets at 5.36%
- High fixed asset turnover at 3.81 indicates efficient asset use
- Diversified product portfolio spanning EUV and immersion lithography
- Significant global presence in China, Korea, Taiwan, and the US
SLAB Strengths
- Favorable quick ratio of 4.02 showing strong liquidity
- Zero debt enhances financial flexibility
- High fixed asset turnover at 6.1 reflects operational efficiency
- Presence across multiple geographic regions including China, Taiwan, US
- Moderate price-to-earnings (PE) ratio marked favorable despite losses
ASML Weaknesses
- High valuation multiples with PE at 38.33 and PB at 18.05 may pressure returns
- Quick ratio at 0.79 suggests weaker immediate liquidity
- Dividend yield low at 0.69%, possibly limiting income appeal
- Weighted average cost of capital (WACC) higher than ROIC at 10.68%
- Neutral current ratio at 1.26 hints at limited short-term buffer
SLAB Weaknesses
- Negative profitability metrics: -8.27% net margin, -5.93% ROE, -6.27% ROIC
- Unfavorable interest coverage at -58.4, indicating risk in debt servicing
- High current ratio at 4.69 may imply inefficient capital deployment
- PB ratio of 3.91 suggests undervaluation concerns
- No dividend yield, limiting shareholder returns
ASML’s strengths lie in robust profitability and strong global diversification, but elevated valuation and liquidity ratios highlight caution. SLAB struggles with profitability and coverage ratios despite strong liquidity and asset efficiency, signaling strategic challenges in capital deployment and earnings generation.
The Moat Duel: Analyzing Competitive Defensibility
A structural moat is the only reliable shield protecting long-term profits from relentless competitive pressure in dynamic markets:
ASML Holding N.V.: Technological Monopoly in Semiconductor Lithography
ASML’s moat stems from its near-monopoly on extreme ultraviolet (EUV) lithography technology. This dominance translates into a very favorable ROIC 23% above WACC and stable 35% EBIT margins. In 2026, expanding EUV capabilities will deepen its moat amid rising semiconductor complexity.
Silicon Laboratories Inc.: Niche Mixed-Signal Innovator
Silicon Labs relies on specialized analog and mixed-signal solutions, a narrower moat centered on product differentiation rather than scale. Its ROIC trends sharply downward, reflecting value destruction. Revenue growth offers hope, but margin pressure and competition threaten its competitive position in 2026.
Verdict: Technological Monopoly vs. Niche Product Differentiation
ASML possesses the deeper, more sustainable moat, driven by technological barriers and superior capital returns. Silicon Labs faces a steep uphill battle defending market share amid declining profitability. ASML is clearly better equipped to protect long-term profits.
Which stock offers better returns?
The past year shows strong price appreciation for both stocks, with ASML and Silicon Laboratories exhibiting accelerating bullish trends and distinct trading volumes.
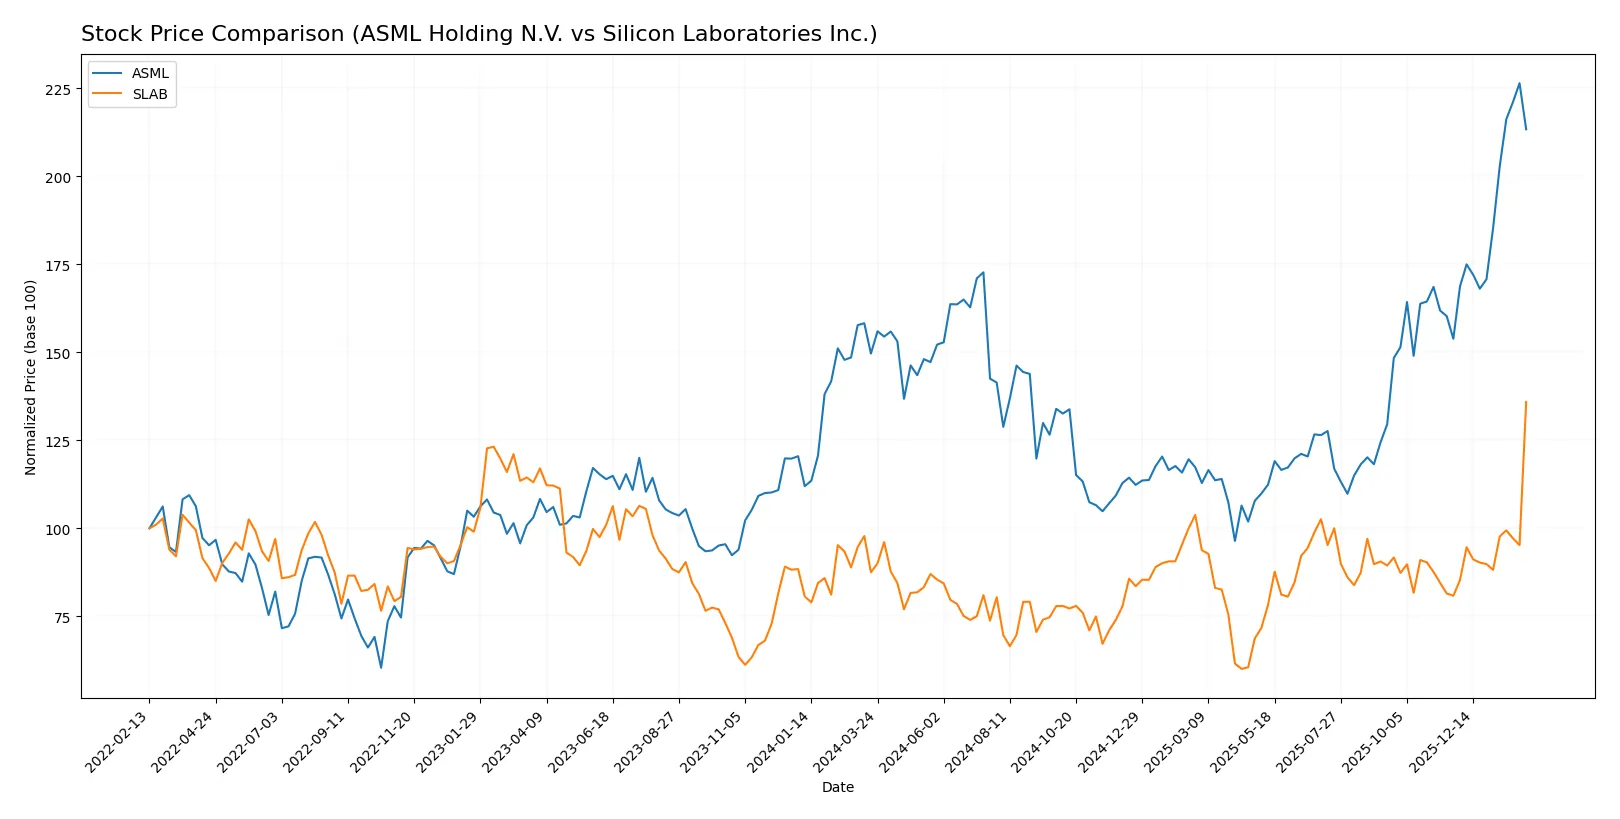
Trend Comparison
ASML Holding N.V. posted a 42.58% price increase over 12 months, accelerating with a high volatility level (std dev 176.17), hitting a peak at 1423 and a low of 605.55. Silicon Laboratories Inc. outperformed with a 55.36% gain over the same period, also accelerating, but with much lower volatility (std dev 16.05), reaching a high of 203.37 and a low of 89.82. Silicon Laboratories delivered the higher market performance, with a 12-month gain exceeding ASML’s by nearly 13 percentage points.
Target Prices
Analysts present a bullish consensus with solid upside potential for both ASML Holding N.V. and Silicon Laboratories Inc.
| Company | Target Low | Target High | Consensus |
|---|---|---|---|
| ASML Holding N.V. | 1150 | 1911 | 1458.5 |
| Silicon Laboratories Inc. | 160 | 231 | 207.33 |
The consensus target for ASML at 1458.5 suggests a 10% upside from the current 1331.8 price. Silicon Labs’ 207.33 consensus target slightly exceeds its current 203.3 price, indicating modest appreciation potential.

Don’t Let Luck Decide Your Entry Point
Optimize your entry points with our advanced ProRealTime indicators. You’ll get efficient buy signals with precise price targets for maximum performance. Start outperforming now!
How do institutions grade them?
This section summarizes recent institutional grades for ASML Holding N.V. and Silicon Laboratories Inc.:
ASML Holding N.V. Grades
Here are the latest grades from reputable institutions for ASML Holding N.V.:
| Grading Company | Action | New Grade | Date |
|---|---|---|---|
| Barclays | Upgrade | Overweight | 2026-01-29 |
| Wells Fargo | Maintain | Overweight | 2026-01-29 |
| RBC Capital | Maintain | Outperform | 2026-01-29 |
| Bernstein | Maintain | Outperform | 2026-01-22 |
| KGI Securities | Upgrade | Outperform | 2026-01-15 |
| Wells Fargo | Maintain | Overweight | 2026-01-15 |
| JP Morgan | Maintain | Overweight | 2026-01-14 |
| Bernstein | Upgrade | Outperform | 2026-01-05 |
| B of A Securities | Maintain | Buy | 2025-12-03 |
| JP Morgan | Maintain | Overweight | 2025-12-01 |
Silicon Laboratories Inc. Grades
Here are the latest grades from reputable institutions for Silicon Laboratories Inc.:
| Grading Company | Action | New Grade | Date |
|---|---|---|---|
| Needham | Downgrade | Hold | 2026-02-04 |
| Keybanc | Downgrade | Sector Weight | 2026-02-04 |
| Benchmark | Downgrade | Hold | 2026-02-04 |
| Morgan Stanley | Maintain | Equal Weight | 2025-08-06 |
| Susquehanna | Maintain | Neutral | 2025-08-06 |
| Barclays | Maintain | Equal Weight | 2025-08-05 |
| Susquehanna | Maintain | Neutral | 2025-07-22 |
| Stifel | Maintain | Buy | 2025-07-18 |
| Keybanc | Maintain | Overweight | 2025-07-08 |
| Benchmark | Maintain | Buy | 2025-05-27 |
Which company has the best grades?
ASML Holding N.V. consistently receives higher grades, including multiple Outperform and Overweight ratings. Silicon Laboratories Inc. faces recent downgrades to Hold and Sector Weight. Superior grades for ASML may attract more investor confidence and capital inflows.
Risks specific to each company
The following categories identify the critical pressure points and systemic threats facing both firms in the 2026 market environment:
1. Market & Competition
ASML Holding N.V.
- Dominates advanced lithography market with high barriers to entry but faces cyclical semiconductor demand risks.
Silicon Laboratories Inc.
- Operates in competitive analog and mixed-signal markets with rising IoT adoption but struggles with profitability and market share growth.
2. Capital Structure & Debt
ASML Holding N.V.
- Maintains low debt ratio (5.36%) and strong interest coverage, signaling disciplined capital allocation.
Silicon Laboratories Inc.
- Zero debt but negative interest coverage indicates operational losses and financial stress despite no leverage risk.
3. Stock Volatility
ASML Holding N.V.
- Beta of 1.46 suggests moderate sensitivity to market swings typical for tech sector leaders.
Silicon Laboratories Inc.
- Higher beta at 1.56 reflects greater stock volatility and investor uncertainty amid weaker fundamentals.
4. Regulatory & Legal
ASML Holding N.V.
- Faces export controls and geopolitical restrictions on semiconductor tech sales, especially in China.
Silicon Laboratories Inc.
- Subject to US tech regulations and export controls impacting sales to China and global supply chains.
5. Supply Chain & Operations
ASML Holding N.V.
- Global footprint with exposure to Asia-Pacific supply chain disruptions but strong operational scale.
Silicon Laboratories Inc.
- Smaller scale and reliance on third-party fabs create vulnerability to supply bottlenecks and component shortages.
6. ESG & Climate Transition
ASML Holding N.V.
- High energy use and resource intensity demand ongoing ESG investments to meet evolving standards.
Silicon Laboratories Inc.
- Faces pressures to improve sustainability metrics amid growing regulatory and customer ESG expectations.
7. Geopolitical Exposure
ASML Holding N.V.
- Significant exposure to Europe, Asia, and US trade tensions impacting semiconductor equipment exports.
Silicon Laboratories Inc.
- US-centric but reliant on China and international markets, vulnerable to tariff and tech embargo risks.
Which company shows a better risk-adjusted profile?
ASML’s dominant market position and disciplined capital structure mitigate cyclical and geopolitical risks better than Silicon Labs. SLAB’s negative profitability and operational losses expose it to higher financial distress risk despite zero leverage. ASML’s Altman Z-score of 12.4 and strong Piotroski score reflect robust financial health. Conversely, SLAB’s weaker Piotroski score and unfavorable debt-to-equity rating underscore its fragile risk profile. Recent data shows ASML’s consistent returns and moderate volatility justify confidence, while SLAB’s persistent negative margins highlight ongoing risk concerns.
Final Verdict: Which stock to choose?
ASML’s superpower lies in its robust economic moat and consistently high returns on invested capital. Its ability to generate strong free cash flow and maintain a growing ROIC signals durable competitive advantage. A point of vigilance is its elevated valuation multiples, which could limit near-term upside. It fits well in an Aggressive Growth portfolio seeking industry leadership.
Silicon Laboratories boasts a strategic moat rooted in niche semiconductor solutions and solid balance sheet liquidity. It offers a safer profile relative to ASML’s premium pricing, though at the cost of current profitability and value destruction. This stock may appeal to a GARP investor focused on long-term turnaround potential balanced with financial prudence.
If you prioritize enduring competitive advantages and superior capital efficiency, ASML is the compelling choice due to its proven value creation and market leadership. However, if you seek a more conservative entry with a potential recovery story, Silicon Laboratories offers better stability and lower financial risk despite its current headwinds.
Disclaimer: Investment carries a risk of loss of initial capital. The past performance is not a reliable indicator of future results. Be sure to understand risks before making an investment decision.
Go Further
I encourage you to read the complete analyses of ASML Holding N.V. and Silicon Laboratories Inc. to enhance your investment decisions: