Home > Comparison > Technology > ASML vs Q
The strategic rivalry between ASML Holding N.V. and Qnity Electronics, Inc. defines the current trajectory of the semiconductor industry. ASML operates as a capital-intensive leader in advanced lithography systems, while Qnity focuses on providing specialized electronic materials for chip manufacturing. This analysis pits ASML’s established technological moat against Qnity’s emerging niche. Our goal is to identify which company offers superior risk-adjusted returns for a diversified technology portfolio.
Table of contents
Companies Overview
ASML Holding N.V. and Qnity Electronics, Inc. both play pivotal roles in the semiconductor industry, driving innovation and supply chain dynamics.
ASML Holding N.V.: Semiconductor Lithography Pioneer
ASML dominates the advanced semiconductor equipment market with its lithography systems, crucial for chipmakers worldwide. Its revenue stems from selling and servicing extreme ultraviolet and deep ultraviolet lithography machines. In 2026, the company emphasizes upgrading and expanding its cutting-edge lithography solutions to maintain technological leadership.
Qnity Electronics, Inc.: Semiconductor Materials Specialist
Qnity Electronics focuses on supplying electronic materials and solutions essential for semiconductor chip manufacturing. Its earnings come from providing advanced materials that support chip production processes. As a recent market entrant in 2025, Qnity prioritizes scaling its product offerings and carving out a niche in materials innovation.
Strategic Collision: Similarities & Divergences
ASML and Qnity share a commitment to semiconductor advancement but differ fundamentally: ASML offers a closed ecosystem of complex equipment, while Qnity provides specialized materials supporting broader manufacturing. Their primary battleground lies in the semiconductor supply chain’s upstream technology versus raw material provision. These distinctions shape contrasting investment profiles—ASML as a mature tech leader and Qnity as an emerging materials player.
Income Statement Comparison
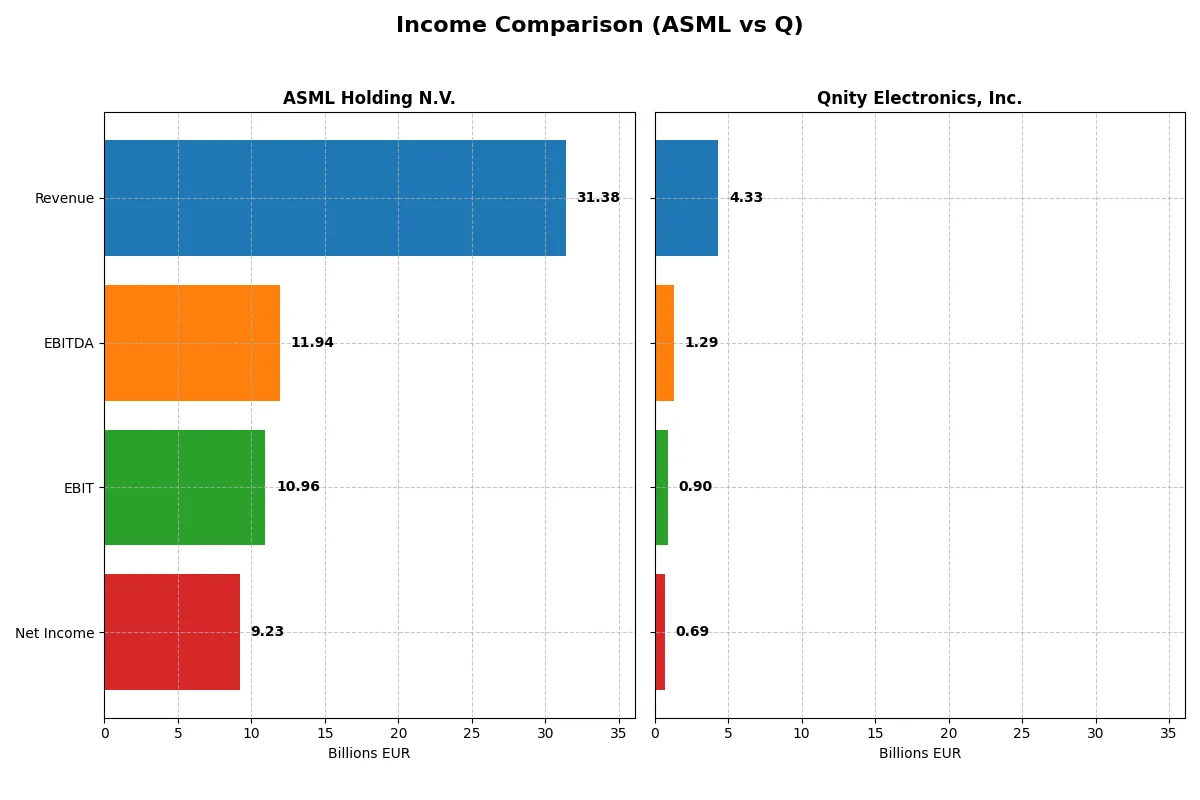
This data dissects the core profitability and scalability of both corporate engines to reveal who dominates the bottom line:
| Metric | ASML Holding N.V. (ASML) | Qnity Electronics, Inc. (Q) |
|---|---|---|
| Revenue | 31.4B EUR | 4.34B USD |
| Cost of Revenue | 14.8B EUR | 2.34B USD |
| Operating Expenses | 5.72B EUR | 1.16B USD |
| Gross Profit | 16.6B EUR | 2.00B USD |
| EBITDA | 11.9B EUR | 1.29B USD |
| EBIT | 11.0B EUR | 898M USD |
| Interest Expense | 0 EUR | 280M USD |
| Net Income | 9.23B EUR | 693M USD |
| EPS | 23.76 EUR | 3.31 USD |
| Fiscal Year | 2025 | 2024 |
Income Statement Analysis: The Bottom-Line Duel
This income statement comparison uncovers each company’s operational efficiency and profitability momentum over recent years.
ASML Holding N.V. Analysis
ASML’s revenue climbed from 18.6B EUR in 2021 to 31.4B EUR in 2025, reflecting robust growth. Net income surged from 5.9B to 9.2B EUR, maintaining strong net margins near 29%. The 2025 results reveal accelerating profitability, with gross and EBIT margins at 53% and 35%, respectively, signaling excellent cost control and R&D leverage.
Qnity Electronics, Inc. Analysis
Qnity’s revenue showed a mixed trend, falling from 4.8B USD in 2022 to 4.0B USD in 2023 before a modest rebound to 4.3B USD in 2024. Net income declined overall to 693M USD in 2024, but margin improvements lifted net margin to nearly 16%. EBIT margin rose to 21% in 2024, demonstrating operational efficiency despite overall revenue pressure.
Verdict: High-Growth Precision vs. Margin Resilience
ASML clearly outpaces Qnity in scale and profit growth, with superior margins and a 68.6% revenue rise over five years. Qnity shows margin discipline but faces revenue stagnation. For investors, ASML’s profile offers stronger earnings momentum and capital allocation, appealing to growth-focused strategies, while Qnity suits those prioritizing margin improvement amid top-line challenges.
Financial Ratios Comparison
These vital ratios act as a diagnostic tool to expose the underlying fiscal health, valuation premiums, and capital efficiency of the companies analyzed:
| Ratios | ASML Holding N.V. (ASML) | Qnity Electronics, Inc. (Q) |
|---|---|---|
| ROE | 47.08% | 6.51% |
| ROIC | 34.14% | 5.92% |
| P/E | 38.33 | 28.80 |
| P/B | 18.05 | 1.88 |
| Current Ratio | 1.26 | 1.77 |
| Quick Ratio | 0.79 | 1.06 |
| D/E (Debt-to-Equity) | 0.14 | 0.02 |
| Debt-to-Assets | 5.36% | 1.56% |
| Interest Coverage | N/A | 3.03 |
| Asset Turnover | 0.62 | 0.35 |
| Fixed Asset Turnover | 3.81 | 2.59 |
| Payout Ratio | 26.54% | 0% |
| Dividend Yield | 0.69% | 0% |
| Fiscal Year | 2025 | 2024 |
Efficiency & Valuation Duel: The Vital Signs
Financial ratios serve as a company’s DNA, uncovering hidden risks and operational prowess that raw numbers alone cannot reveal.
ASML Holding N.V.
ASML exhibits commanding profitability with a 47% ROE and a strong 29.4% net margin, signaling operational excellence. Valuation appears stretched with a high 38.3 P/E and 18.1 P/B, reflecting premium market pricing. Shareholders receive modest dividends (0.69%), while significant R&D investment (14.4% of revenue) fuels future growth.
Qnity Electronics, Inc.
Qnity posts a modest 6.5% ROE and a 16% net margin, highlighting profitability but less efficiency than ASML. Its valuation is lower but still elevated with a 28.8 P/E and 1.88 P/B, suggesting some premium despite weaker returns. Qnity pays no dividends, opting to reinvest in R&D (7.2% of revenue) to support expansion.
Premium Valuation vs. Operational Safety
ASML commands a premium for its robust profitability and strong capital returns, despite stretched valuation metrics. Qnity offers a more conservative valuation but with weaker returns and profitability. ASML suits investors prioritizing growth and operational strength; Qnity fits those favoring a cautious, reinvestment-driven profile.
Which one offers the Superior Shareholder Reward?
I compare ASML Holding N.V. and Qnity Electronics, Inc. on dividends, buybacks, and sustainability of returns. ASML yields ~0.97% with a 34% payout ratio, well-covered by strong free cash flow (27.4/share). Qnity pays no dividends but reinvests heavily in growth, shown by high R&D capex and zero payout. ASML’s buyback activity is modest but consistent, enhancing shareholder value. Qnity’s buybacks are less visible but its low leverage and strong cash generation suggest capacity for future returns. Historically, ASML balances dividends and buybacks sustainably, supporting long-term value. Qnity’s strategy suits growth-focused investors but carries reinvestment risk. I find ASML offers a more attractive total return profile for 2026 investors seeking steady income plus capital appreciation.
Comparative Score Analysis: The Strategic Profile
The radar chart reveals the fundamental DNA and trade-offs of ASML Holding N.V. and Qnity Electronics, Inc., highlighting their financial strengths and valuation approaches:
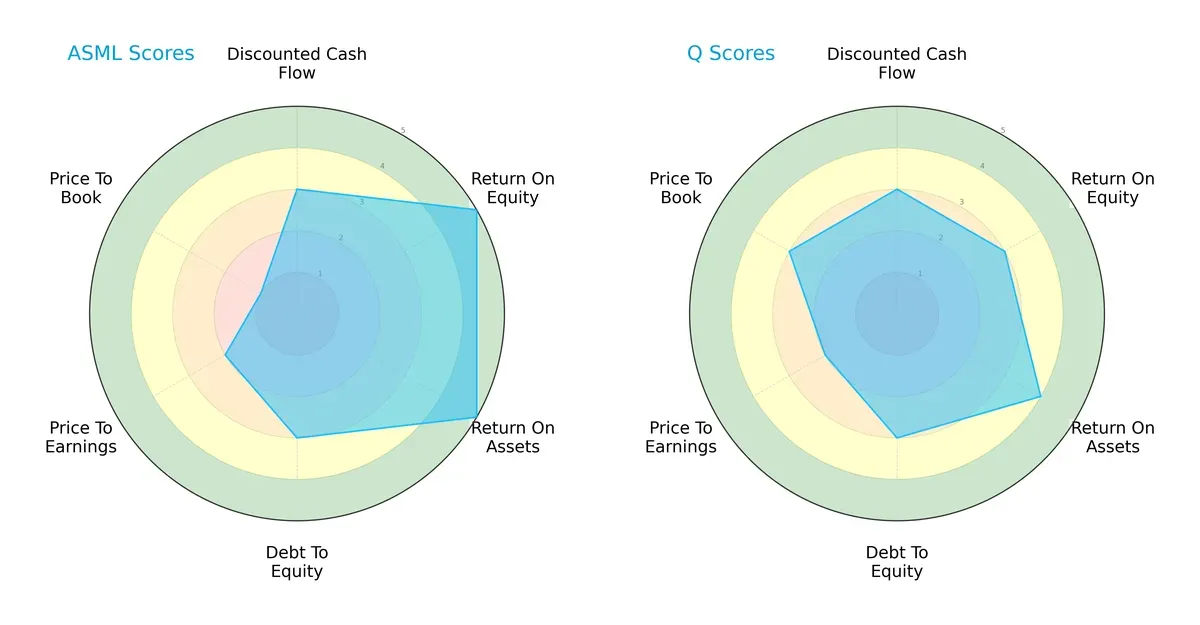
ASML excels in return on equity (5) and return on assets (5), showing operational efficiency superior to Q’s moderate ROE (3) and favorable ROA (4). Both share moderate discounted cash flow (3) and debt-to-equity scores (3). ASML’s valuation metrics lag with very unfavorable price-to-book (1) and moderate price-to-earnings (2), while Q presents a more balanced valuation profile, especially in price-to-book (3). ASML leans on operational excellence, whereas Q offers a steadier valuation balance.
Bankruptcy Risk: Solvency Showdown
ASML’s Altman Z-Score of 12.4 places it firmly in the safe zone, signaling robust long-term solvency and minimal bankruptcy risk in today’s cycle, a reassuring edge over Q’s unavailable data:

Financial Health: Quality of Operations
ASML posts a Piotroski F-Score of 8, indicating very strong financial health with solid profitability and balance sheet metrics. Q’s Piotroski score is unavailable, limiting direct operational quality comparison:

How are the two companies positioned?
This section dissects the operational DNA of ASML and Q by comparing their revenue distribution by segment and internal dynamics. The goal is to confront their economic moats to determine which model offers the most resilient, sustainable advantage today.
Revenue Segmentation: The Strategic Mix
This visual comparison dissects how ASML Holding N.V. and Qnity Electronics, Inc. diversify their income streams and where their primary sector bets lie:
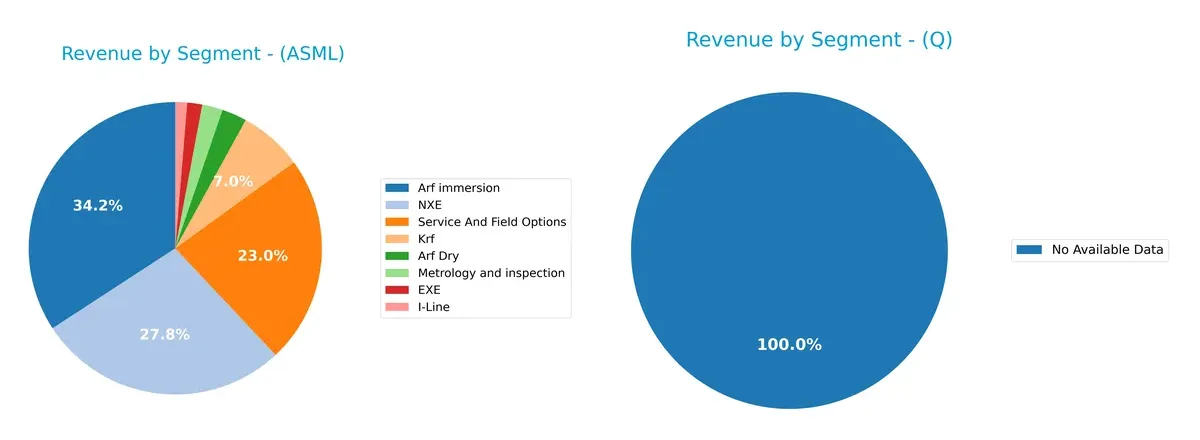
ASML reveals a diversified revenue base, with significant contributions from Arf immersion (9.7B), NXE (7.9B), and Service And Field Options (6.5B). This mix anchors its ecosystem lock-in and infrastructure dominance. Qnity lacks reported revenue segmentation, indicating either data unavailability or a narrow focus. ASML’s broad portfolio reduces concentration risk, while Qnity’s unknown breakdown raises caution for investors seeking stability.
Strengths and Weaknesses Comparison
This table compares the Strengths and Weaknesses of ASML Holding N.V. and Qnity Electronics, Inc.:
ASML Strengths
- High net margin at 29.42%
- Strong ROE at 47.08%
- Favorable ROIC at 34.14%
- Low debt-to-assets ratio at 5.36%
- Significant global presence with strong revenues in China, Taiwan, Korea, and the US
- Diversified product portfolio including Arf immersion, NXE, and service options
Q Strengths
- Favorable net margin at 15.99%
- Low debt-to-assets at 1.56%
- Strong current and quick ratios at 1.77 and 1.06
- Favorable WACC at 5.78%
- Low debt-to-equity at 0.02
ASML Weaknesses
- High PE and PB ratios indicating possible overvaluation
- Unfavorable quick ratio at 0.79
- Dividend yield low at 0.69%
- WACC above 10%
- Asset turnover neutral at 0.62
Q Weaknesses
- Low ROE at 6.51%
- Neutral ROIC at 5.92%
- Unfavorable asset turnover at 0.35
- PE ratio unfavorable at 28.8
- Zero dividend yield
ASML demonstrates robust profitability and global diversification but faces valuation and liquidity concerns. Q shows solid liquidity and low leverage but struggles with profitability and asset efficiency. Both companies maintain slightly favorable overall ratio evaluations, suggesting cautious optimism in their financial health.
The Moat Duel: Analyzing Competitive Defensibility
A structural moat is the only reliable shield protecting long-term profits from relentless competitive erosion. Let’s dissect the moats of two semiconductor players:
ASML Holding N.V.: Technological Monopoly with a Wide Economic Moat
ASML’s moat stems from its proprietary lithography systems and intense R&D-driven intangible assets. This yields a robust 24% ROIC above WACC, reflecting durable value creation. New EUV innovations deepen its moat in 2026, reinforcing pricing power and margin stability.
Qnity Electronics, Inc.: Emerging Cost Advantage in a Crowded Field
Qnity’s competitive edge lies in cost efficiency within electronic materials, but its ROIC barely surpasses WACC by 0.14%, signaling fragile value creation. Unlike ASML, Qnity faces margin pressure. Expansion into advanced materials could boost its moat but remains uncertain for 2026.
Verdict: Innovation Dominance vs. Cost Efficiency
ASML’s wide, technology-driven moat outclasses Qnity’s narrow, cost-based advantage. ASML’s growing ROIC and market leadership better defend its market share against competitive threats. Qnity must prove sustained value creation to match this resilience.
Which stock offers better returns?
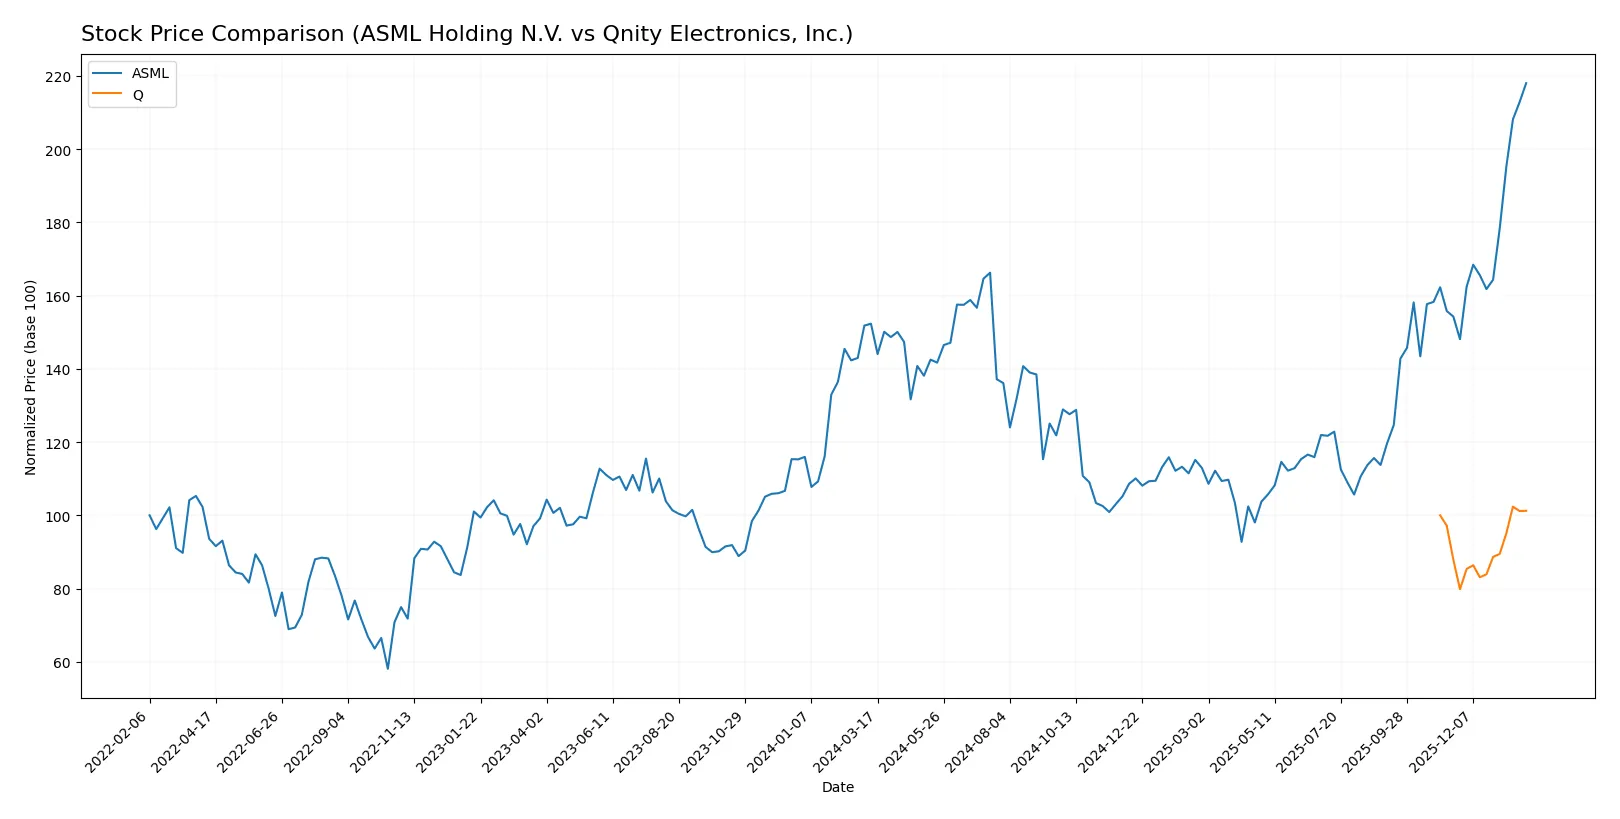
The past year reveals starkly different price dynamics between ASML Holding N.V. and Qnity Electronics, Inc., highlighted by ASML’s pronounced bullish momentum versus Qnity’s subdued gains.
Trend Comparison
ASML Holding N.V. shows a strong 43.11% price increase over the past 12 months, marked by accelerating upward momentum and a high volatility level with prices ranging from 606 to 1,423.
Qnity Electronics, Inc. posted a modest 1.24% gain over the same period, technically bullish but close to neutral, with low volatility and a price band between 76 and 97.
ASML clearly outperformed Qnity, delivering significantly higher returns and more robust upward acceleration during the analyzed year.
Target Prices
Analysts present a balanced consensus for ASML Holding N.V. and Qnity Electronics, Inc., reflecting measured optimism.
| Company | Target Low | Target High | Consensus |
|---|---|---|---|
| ASML Holding N.V. | 1150 | 1911 | 1458.5 |
| Qnity Electronics, Inc. | 92 | 118 | 106.78 |
The ASML target consensus at 1458.5 slightly exceeds its current price of 1423, suggesting modest upside. Qnity’s consensus of 106.78 also points to potential gains from its current 96.18 level.

Don’t Let Luck Decide Your Entry Point
Optimize your entry points with our advanced ProRealTime indicators. You’ll get efficient buy signals with precise price targets for maximum performance. Start outperforming now!
How do institutions grade them?
Here is a summary of recent institutional grades for ASML Holding N.V. and Qnity Electronics, Inc.:
ASML Holding N.V. Grades
The table below shows the most recent grades from well-known institutional analysts:
| Grading Company | Action | New Grade | Date |
|---|---|---|---|
| Barclays | Upgrade | Overweight | 2026-01-29 |
| Wells Fargo | Maintain | Overweight | 2026-01-29 |
| RBC Capital | Maintain | Outperform | 2026-01-29 |
| Bernstein | Maintain | Outperform | 2026-01-22 |
| KGI Securities | Upgrade | Outperform | 2026-01-15 |
| Wells Fargo | Maintain | Overweight | 2026-01-15 |
| JP Morgan | Maintain | Overweight | 2026-01-14 |
| Bernstein | Upgrade | Outperform | 2026-01-05 |
| B of A Securities | Maintain | Buy | 2025-12-03 |
| JP Morgan | Maintain | Overweight | 2025-12-01 |
Qnity Electronics, Inc. Grades
Below are recent grades from recognized institutional analysts for Qnity Electronics:
| Grading Company | Action | New Grade | Date |
|---|---|---|---|
| RBC Capital | Maintain | Outperform | 2025-11-25 |
| Mizuho | Maintain | Outperform | 2025-11-20 |
Which company has the best grades?
ASML Holding N.V. has received consistently strong grades, with multiple upgrades and “Overweight” or better ratings. Qnity Electronics maintains “Outperform” ratings but with fewer updates. ASML’s broader institutional support signals greater investor confidence and potential for stronger market performance.
Risks specific to each company
The following categories identify the critical pressure points and systemic threats facing both firms in the 2026 market environment:
1. Market & Competition
ASML Holding N.V.
- Dominates advanced lithography niche with strong technological moat but faces high competition from emerging semiconductor equipment players.
Qnity Electronics, Inc.
- New entrant with limited market share, competing in a crowded semiconductor materials space with established incumbents.
2. Capital Structure & Debt
ASML Holding N.V.
- Low debt-to-equity ratio (0.14), strong interest coverage, signaling conservative leverage and financial stability.
Qnity Electronics, Inc.
- Extremely low leverage (D/E 0.02), but moderate interest coverage ratio (3.21) implies cautious optimism on debt service ability.
3. Stock Volatility
ASML Holding N.V.
- Beta of 1.34 indicates above-market volatility, reflecting sensitivity to tech sector cycles and geopolitical risks.
Qnity Electronics, Inc.
- Beta of 0 suggests very low historical volatility, possibly due to recent IPO and limited trading history.
4. Regulatory & Legal
ASML Holding N.V.
- Subject to stringent export controls and IP regulations due to high-tech equipment, increasing compliance risks globally.
Qnity Electronics, Inc.
- Faces standard semiconductor material regulations with potential risks from evolving US trade policies and environmental standards.
5. Supply Chain & Operations
ASML Holding N.V.
- Complex global supply chain exposed to geopolitical tensions in Asia and Europe; however, strong operational efficiency (fixed asset turnover 3.81).
Qnity Electronics, Inc.
- Supply chain less complex but vulnerable as a younger company; lower asset turnover (0.35) suggests operational scaling challenges.
6. ESG & Climate Transition
ASML Holding N.V.
- Increasing pressure to reduce carbon footprint in manufacturing; advanced R&D investments in sustainability.
Qnity Electronics, Inc.
- Early-stage ESG programs with less disclosure; may face growing investor scrutiny as it scales.
7. Geopolitical Exposure
ASML Holding N.V.
- Significant exposure to Asia-Pacific markets and US-EU trade policies, heightening risk from geopolitical tensions.
Qnity Electronics, Inc.
- Primarily US-based, somewhat insulated but still exposed to global semiconductor supply chain disruptions.
Which company shows a better risk-adjusted profile?
ASML’s dominant market position and conservative capital structure offer resilience but expose it to high geopolitical and regulatory risks. Qnity benefits from low leverage and limited volatility but faces operational scaling and competitive pressures. ASML shows a better risk-adjusted profile due to its technological moat and financial strength, despite macro risks. The 34% ROIC vs. 10% WACC indicates strong capital allocation. Qnity’s recent IPO and modest profitability highlight uncertainty. I remain cautious on Qnity’s ability to scale efficiently in a competitive environment.
Final Verdict: Which stock to choose?
ASML’s superpower lies in its durable competitive advantage, demonstrated by a strong and growing ROIC well above its cost of capital. It excels as a high-efficiency cash generator in a capital-intensive industry. The point of vigilance remains its premium valuation, which could pressure returns if growth slows. ASML suits portfolios seeking aggressive growth with a tolerance for valuation risk.
Q’s strategic moat centers on its stable operating cash flow and a conservative balance sheet with low leverage. While it lacks ASML’s scale and profitability, Q offers better liquidity and a more moderate valuation, providing a safety cushion. Its profile fits well with investors favoring GARP strategies who seek steady improvement without aggressive risk-taking.
If you prioritize long-term value creation backed by a robust economic moat, ASML outshines with its superior profitability and growth momentum despite a higher premium. However, if you seek better stability and a more balanced risk profile, Q offers a more conservative approach with reasonable liquidity and moderate growth prospects. Both present analytical scenarios worth considering based on your portfolio’s risk appetite and investment horizon.
Disclaimer: Investment carries a risk of loss of initial capital. The past performance is not a reliable indicator of future results. Be sure to understand risks before making an investment decision.
Go Further
I encourage you to read the complete analyses of ASML Holding N.V. and Qnity Electronics, Inc. to enhance your investment decisions: