Home > Comparison > Technology > ASML vs ONTO
The strategic rivalry between ASML Holding N.V. and Onto Innovation Inc. drives innovation in the semiconductor technology sector. ASML operates as a capital-intensive industrial leader, specializing in advanced lithography equipment. Onto Innovation, by contrast, focuses on high-precision process control tools with a software-driven approach. This analysis will assess which company’s operational model and growth trajectory offer superior risk-adjusted returns for a diversified portfolio in an evolving semiconductor landscape.
Table of contents
Companies Overview
ASML Holding N.V. and Onto Innovation Inc. stand as pivotal players shaping semiconductor equipment and process control markets globally.
ASML Holding N.V.: Semiconductor Lithography Pioneer
ASML dominates advanced semiconductor equipment, specializing in extreme ultraviolet lithography systems that drive chip manufacturing innovation. Its core revenue comes from selling and servicing lithography and inspection systems. In 2026, ASML prioritizes expanding EUV technology adoption across semiconductor nodes, reinforcing its leadership in precision and scale.
Onto Innovation Inc.: Process Control Specialist
Onto Innovation commands a niche in process control tools and analytical software for defect inspection and metrology. It generates revenue through standalone inspection systems, lithography solutions, and software licensing. The company’s 2026 strategy focuses on enhancing integrated process control suites to optimize semiconductor yield and device packaging efficiency.
Strategic Collision: Similarities & Divergences
ASML and Onto Innovation share a foundation in semiconductor equipment but diverge sharply in approach. ASML leads with a high-tech closed ecosystem centered on lithography, while Onto emphasizes adaptable, software-driven process control tools. Their primary battleground is yield optimization in chip production. Investors face distinct profiles: ASML offers scale and innovation leadership, Onto delivers specialized precision in process analytics.
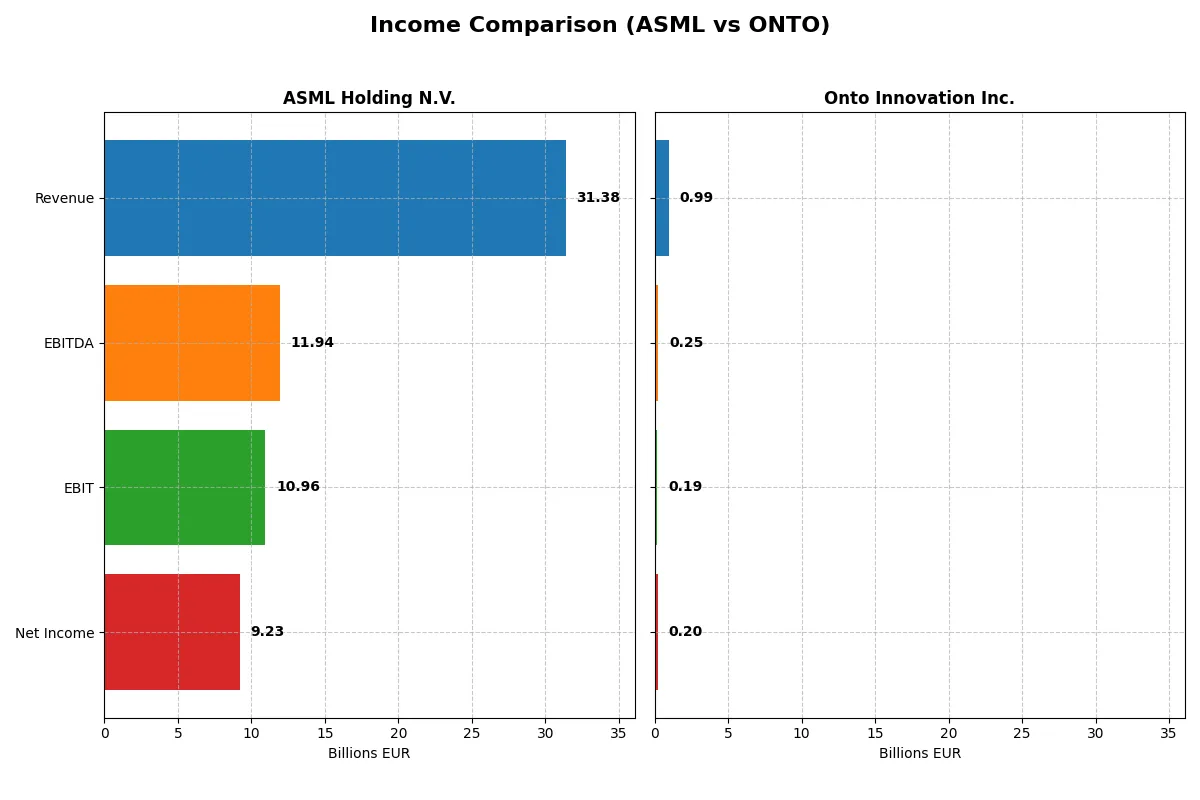
Income Statement Comparison
This data dissects the core profitability and scalability of both corporate engines to reveal who dominates the bottom line:
| Metric | ASML Holding N.V. (ASML) | Onto Innovation Inc. (ONTO) |
|---|---|---|
| Revenue | 31.4B EUR | 987M USD |
| Cost of Revenue | 14.8B EUR | 472M USD |
| Operating Expenses | 5.7B EUR | 328M USD |
| Gross Profit | 16.6B EUR | 515M USD |
| EBITDA | 11.9B EUR | 249M USD |
| EBIT | 11.0B EUR | 187M USD |
| Interest Expense | 0 | 0 |
| Net Income | 9.2B EUR | 202M USD |
| EPS | 23.76 EUR | 4.09 USD |
| Fiscal Year | 2025 | 2024 |
Income Statement Analysis: The Bottom-Line Duel
This income statement comparison exposes which company converts revenue into profit most efficiently over recent years.
ASML Holding N.V. Analysis
ASML’s revenue rose steadily from 18.6B EUR in 2021 to 31.4B EUR in 2025, with net income climbing from 5.9B EUR to 9.2B EUR. Its gross margin remains strong at 52.8%, and net margin stands at 29.4%, reflecting robust operational efficiency. The 2025 fiscal year shows accelerating EBIT growth of 19%, signaling increasing profitability momentum.
Onto Innovation Inc. Analysis
Onto Innovation grew revenue from 556M USD in 2020 to 987M USD in 2024, with net income surging from 31M USD to 202M USD. It sustains a healthy gross margin near 52.2% and a net margin of 20.4%, demonstrating improving cost control. Notably, Onto’s EBIT jumped 61% in 2024, highlighting strong operational leverage and rapid earnings acceleration.
Margin Dominance vs. Earnings Momentum
ASML delivers superior margins and consistent profitability growth, producing nearly triple the net income of Onto despite a similar gross margin. Onto, however, outpaces ASML in revenue and earnings growth rates, signaling dynamic expansion from a smaller base. Investors seeking steady margin power may favor ASML, while those valuing high momentum might find Onto’s profile compelling.
Financial Ratios Comparison
These vital ratios act as a diagnostic tool to expose the underlying fiscal health, valuation premiums, and capital efficiency:
| Ratios | ASML Holding N.V. (ASML) | Onto Innovation Inc. (ONTO) |
|---|---|---|
| ROE | 47.08% | 10.47% |
| ROIC | 34.14% | 8.77% |
| P/E | 38.33 | 41.76 |
| P/B | 18.05 | 4.37 |
| Current Ratio | 1.26 | 8.69 |
| Quick Ratio | 0.79 | 7.00 |
| D/E | 0.14 | 0.01 |
| Debt-to-Assets | 5.36% | 0.72% |
| Interest Coverage | N/A | N/A |
| Asset Turnover | 0.62 | 0.47 |
| Fixed Asset Turnover | 3.81 | 7.16 |
| Payout ratio | 26.54% | 0% |
| Dividend yield | 0.69% | 0% |
| Fiscal Year | 2025 | 2024 |
Efficiency & Valuation Duel: The Vital Signs
Financial ratios act as a company’s DNA, revealing hidden risks and operational excellence beyond surface-level earnings and revenues.
ASML Holding N.V.
ASML demonstrates strong profitability with a 47.08% ROE and a 29.42% net margin, underscoring operational efficiency. However, its valuation appears stretched with a P/E of 38.33 and a high P/B at 18.05. Shareholders receive modest dividends (0.69% yield), reflecting a slight preference for reinvestment in R&D and growth initiatives.
Onto Innovation Inc.
Onto Innovation posts a modest 10.47% ROE and 20.43% net margin, indicating moderate profitability and operational effectiveness. The stock carries a high P/E of 41.76 but a more reasonable P/B of 4.37. It pays no dividends, instead channeling capital into growth and R&D, consistent with a company in expansion mode.
Premium Valuation vs. Operational Safety
ASML offers superior profitability and operational metrics but trades at a stretched valuation, increasing risk. Onto Innovation balances moderate returns with a more conservative asset base but also faces valuation pressure. ASML suits investors seeking growth with high operational efficiency; Onto fits those favoring stability and reinvestment.
Which one offers the Superior Shareholder Reward?
I see ASML Holding N.V. pays dividends with a 0.97% yield and a sustainable 34% payout ratio, backed by strong free cash flow coverage (3.07x). ASML also engages in steady share buybacks, enhancing shareholder returns. Onto Innovation Inc. does not pay dividends but reinvests heavily in growth, reflected in robust margins and near-zero debt. Its buyback activity is minimal. Historically, I’ve observed that dividend-plus-buyback models like ASML’s better balance income and capital appreciation, especially in cyclical tech sectors. Therefore, I judge ASML offers a superior total return profile in 2026, combining income, capital discipline, and growth sustainability. Onto’s growth reinvestment is promising but lacks immediate shareholder reward.
Comparative Score Analysis: The Strategic Profile
The radar chart reveals the fundamental DNA and trade-offs of both firms, highlighting their financial strengths and valuation nuances:
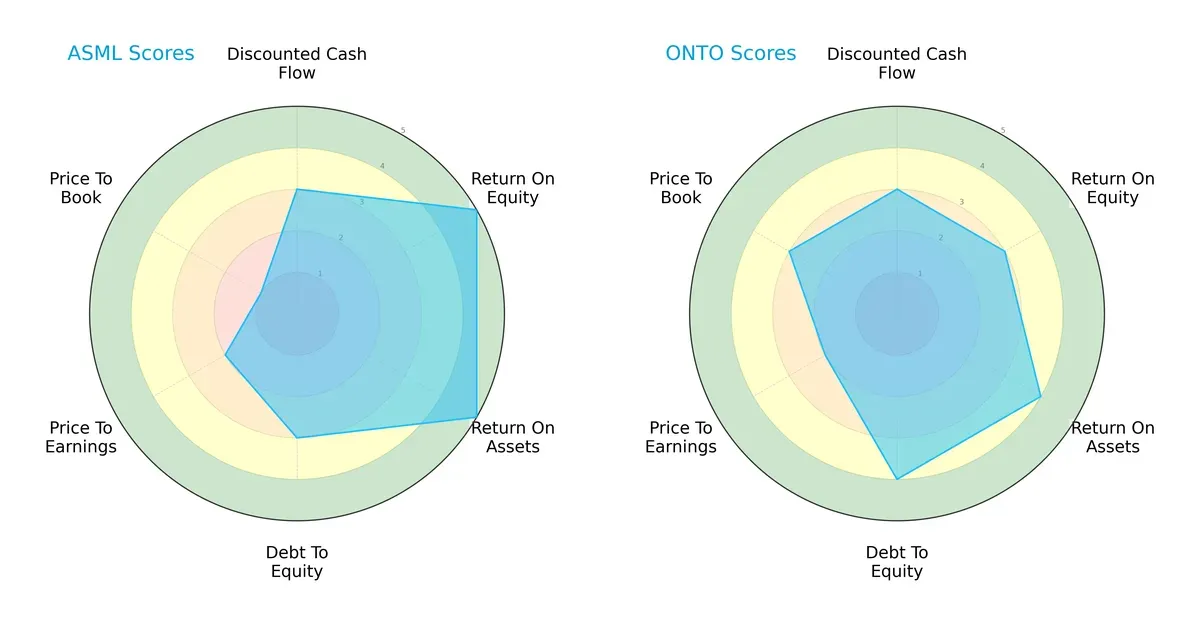
ASML Holding N.V. excels in return on equity and assets, scoring very favorable 5s, indicating robust profitability and asset utilization. Onto Innovation Inc. shows a more balanced financial risk profile with a favorable debt-to-equity score of 4 and a better price-to-book valuation. ASML leans on its operational efficiency, while Onto offers steadier valuation metrics, making Onto’s profile less reliant on a single edge.
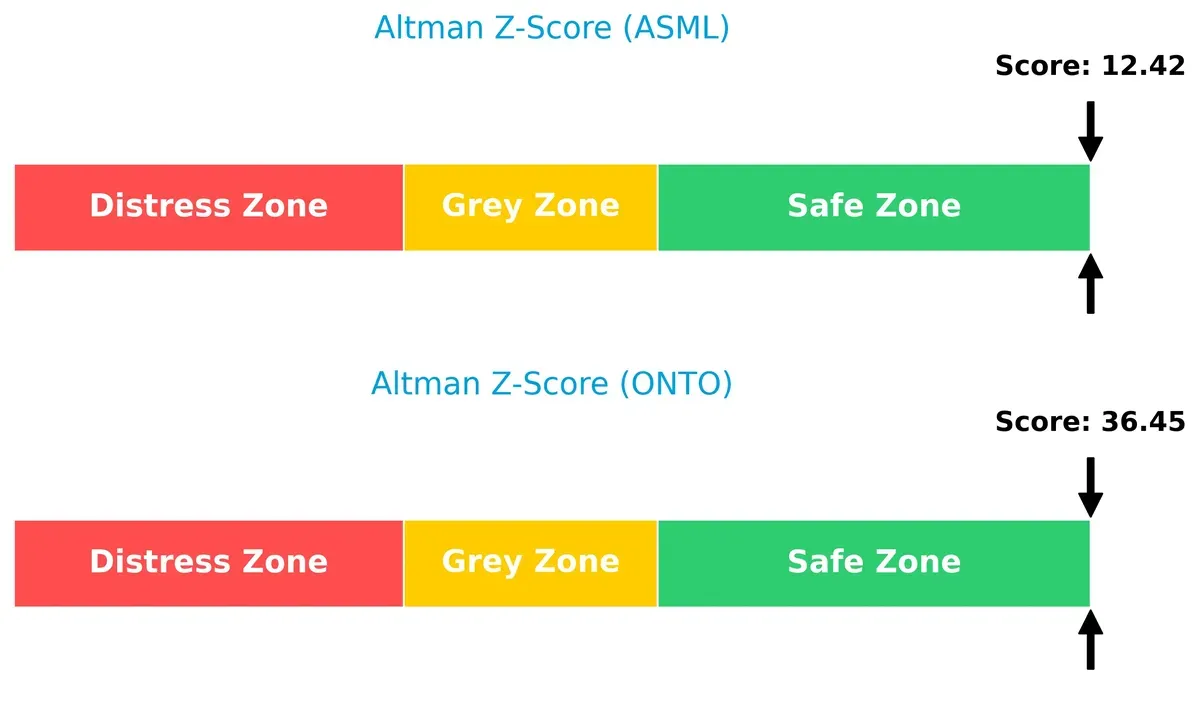
Bankruptcy Risk: Solvency Showdown
The Altman Z-Score delta indicates both companies are comfortably in the safe zone, with Onto Innovation far exceeding ASML, implying stronger long-term solvency in this market cycle:
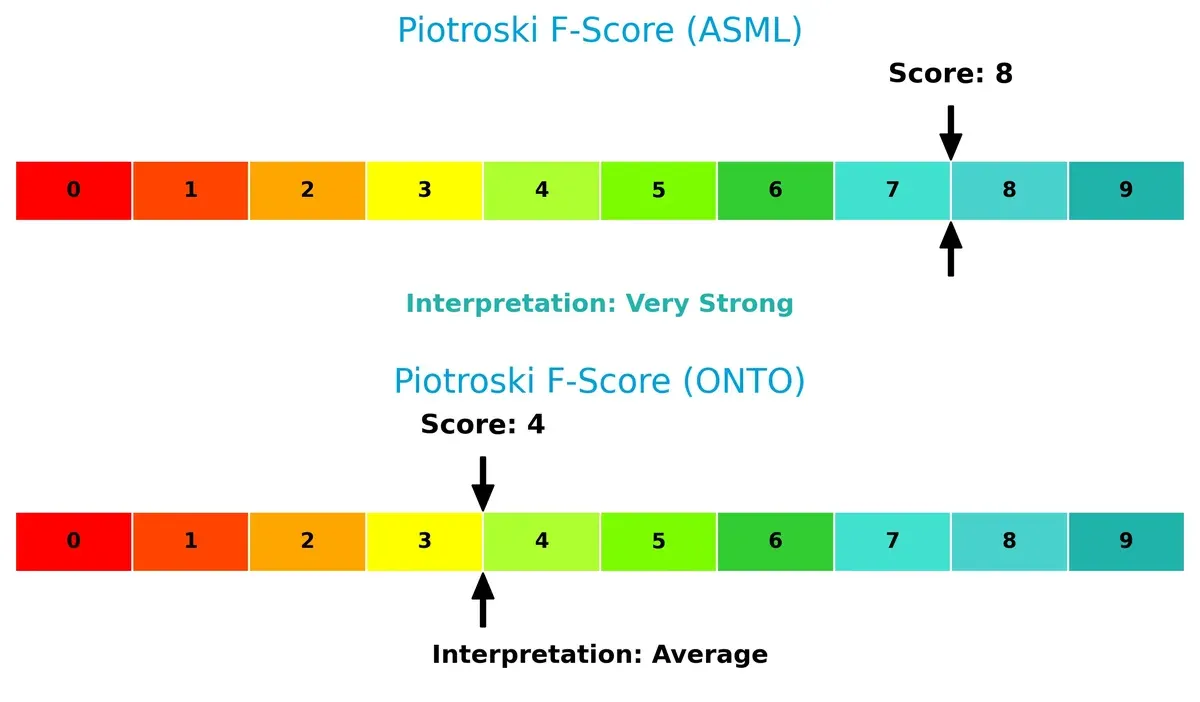
Financial Health: Quality of Operations
ASML’s Piotroski F-Score of 8 signals very strong financial health, reflecting superior internal metrics. Onto’s score of 4 suggests average health with potential red flags in operational quality:
How are the two companies positioned?
This section dissects ASML and Onto Innovation’s operational DNA by comparing their revenue distribution and internal strengths and weaknesses. The goal is to confront their economic moats and identify which model offers the most resilient, sustainable advantage today.
Revenue Segmentation: The Strategic Mix
This comparison dissects how ASML Holding N.V. and Onto Innovation Inc. diversify their income streams and where their primary sector bets lie:
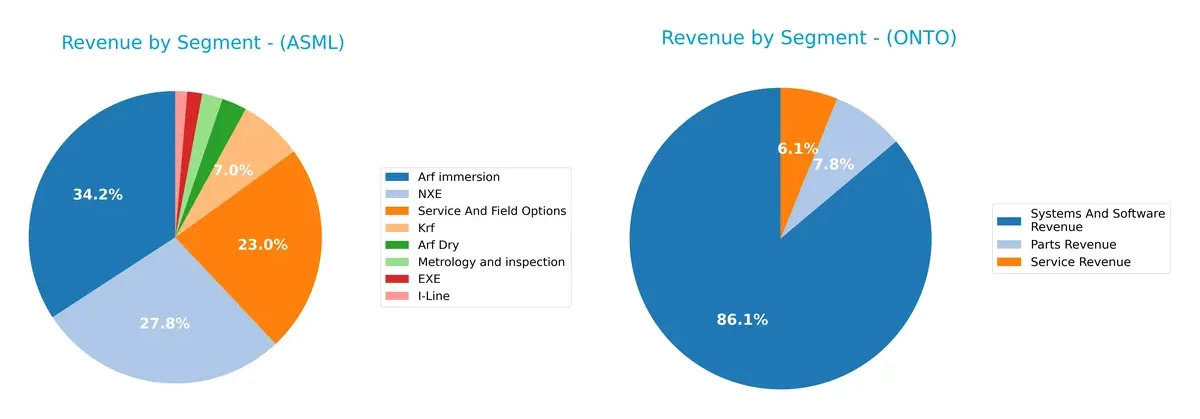
ASML anchors its revenue in Arf immersion at $9.7B and NXE at $7.9B, showing dominance in advanced lithography. Onto Innovation pivots on Systems and Software Revenue at $850M, dwarfing its Parts and Service revenues near $77M and $60M. ASML’s concentrated segments reflect infrastructure dominance with ecosystem lock-in. Onto’s more balanced streams imply diversified exposure but with less scale, heightening competitive pressure risks.
Strengths and Weaknesses Comparison
This table compares the Strengths and Weaknesses of ASML Holding N.V. and Onto Innovation Inc.:
ASML Strengths
- High profitability with 29.42% net margin
- Exceptional ROE at 47.08%
- Strong financial leverage with low debt-to-assets at 5.36%
- Robust fixed asset turnover at 3.81
- Extensive global presence, especially in China and Korea
- Diversified product portfolio including EUV and NXE technologies
ONTO Strengths
- Favorable net margin at 20.43%
- Very strong quick ratio at 7.0 indicating liquidity
- Minimal debt with debt-to-assets at 0.72%
- High fixed asset turnover at 7.16
- Global presence including Taiwan and Korea
- Growing systems and software revenue segment
ASML Weaknesses
- Unfavorable high P/E of 38.33 and P/B of 18.05
- Quick ratio below 1.0 at 0.79, signaling potential liquidity risk
- Dividend yield low at 0.69%
- WACC relatively high at 10.08%
- Slightly unfavorable market valuation metrics
ONTO Weaknesses
- Unfavorable high P/E of 41.76 and P/B of 4.37
- Excessively high current ratio at 8.69 may indicate inefficient asset use
- ROE and ROIC neutral and below cost of capital
- Zero dividend yield
- Asset turnover low at 0.47, suggesting lower operational efficiency
ASML demonstrates superior profitability and efficient capital use, supported by a broad geographic and product footprint. Onto Innovation shows strong liquidity and asset turnover but faces challenges in profitability and valuation metrics. Both companies exhibit distinct strategic profiles that reflect their market positioning and operational focus.
The Moat Duel: Analyzing Competitive Defensibility
A structural moat shields long-term profits from relentless competitive pressure. Understanding each firm’s moat reveals their true market resilience:
ASML Holding N.V.: Technological Leadership Moat
ASML’s moat stems from its near-monopoly in extreme ultraviolet lithography systems. This drives high ROIC (24%) and stable margins above 30%. New product innovations and expanding chip technology demand further strengthen this advantage in 2026.
Onto Innovation Inc.: Emerging Process Control Moat
Onto Innovation relies on proprietary process control tools and analytics. Unlike ASML’s scale, Onto’s moat is narrower, reflected in negative ROIC vs. WACC but with rapidly improving profitability. Growth in advanced packaging markets offers expansion opportunities in 2026.
Verdict: Monopoly Precision vs. Growth Momentum
ASML possesses a wider, deeper moat with robust value creation and durable technology dominance. Onto shows promise with accelerating profitability but remains a slight value destroyer. ASML is better equipped to defend and grow its market share long-term.
Which stock offers better returns?
The past year showed strong price gains for both stocks, with ASML accelerating sharply and Onto Innovation also posting notable gains amid evolving trading patterns.
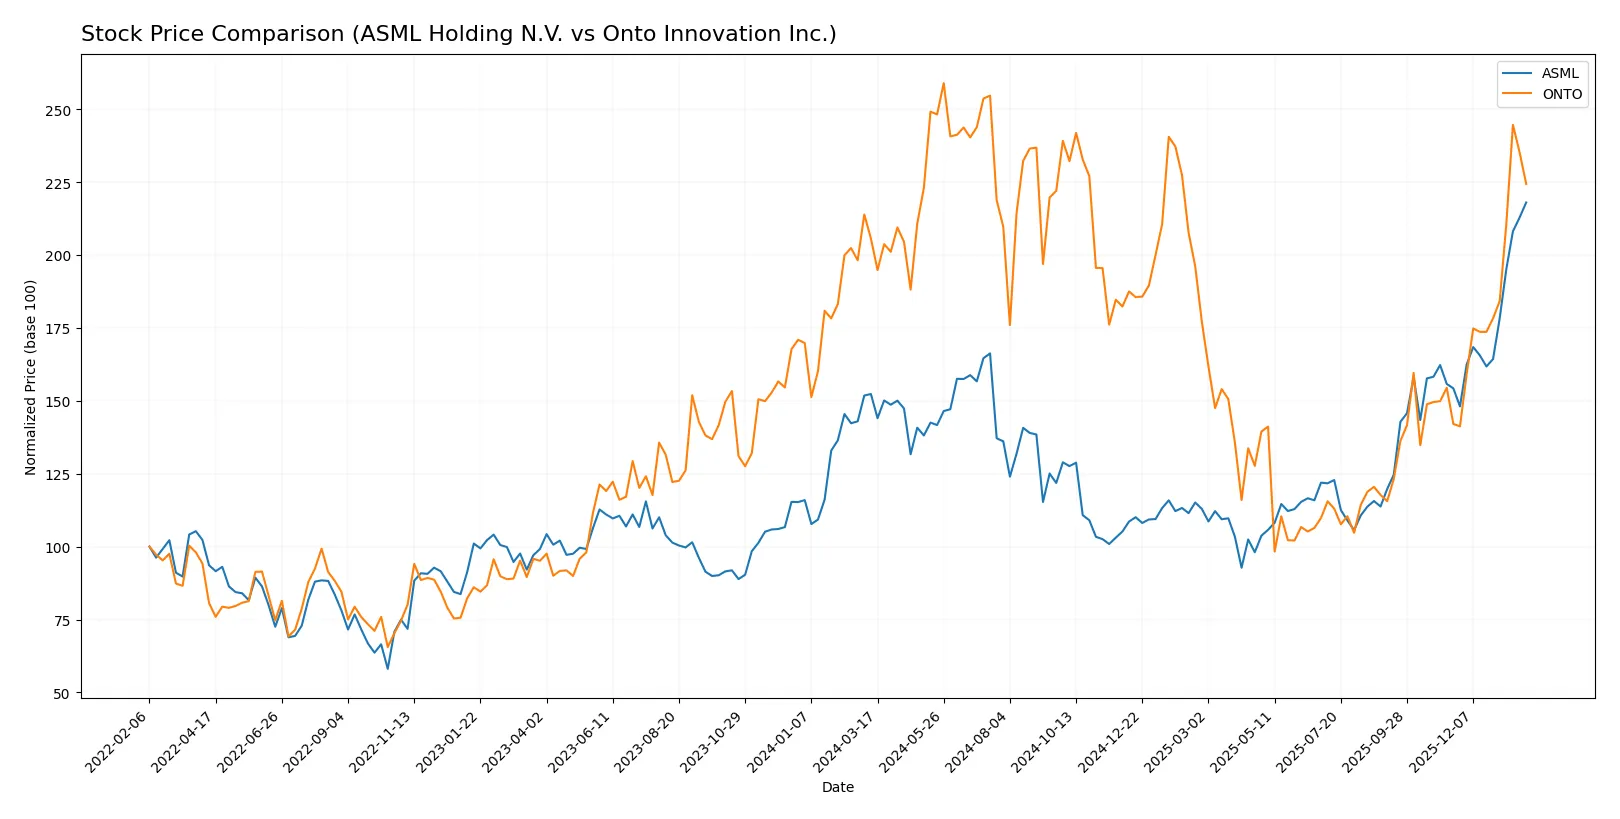
Trend Comparison
ASML Holding N.V. gained 43.11% over the past 12 months, showing a bullish trend with accelerating momentum and a high volatility level (std deviation 170.09). The stock hit a low of 605.55 and peaked at 1423.
Onto Innovation Inc. recorded a 9.1% increase over the same period, also bullish with acceleration but lower volatility (std deviation 42.99). Its price ranged between 88.5 and 233.14, reflecting steadier gains.
ASML outperformed Onto Innovation by a wide margin in total returns, demonstrating superior market performance and stronger acceleration over the last year.
Target Prices
Analysts present a mixed but generally positive outlook with wide target price ranges for ASML Holding N.V. and Onto Innovation Inc.
| Company | Target Low | Target High | Consensus |
|---|---|---|---|
| ASML Holding N.V. | 1150 | 1911 | 1458.5 |
| Onto Innovation Inc. | 160 | 260 | 191.67 |
The consensus target for ASML sits slightly above its current price of 1423, suggesting modest upside potential. Onto Innovation’s target consensus at 191.67 is below its current price of 202.05, indicating possible downside risk.

Don’t Let Luck Decide Your Entry Point
Optimize your entry points with our advanced ProRealTime indicators. You’ll get efficient buy signals with precise price targets for maximum performance. Start outperforming now!
How do institutions grade them?
Here is a summary of recent institutional grades for ASML Holding N.V. and Onto Innovation Inc.:
ASML Holding N.V. Grades
The following table displays recent grades assigned to ASML by reputable institutions.
| Grading Company | Action | New Grade | Date |
|---|---|---|---|
| Barclays | Upgrade | Overweight | 2026-01-29 |
| Wells Fargo | Maintain | Overweight | 2026-01-29 |
| RBC Capital | Maintain | Outperform | 2026-01-29 |
| Bernstein | Maintain | Outperform | 2026-01-22 |
| KGI Securities | Upgrade | Outperform | 2026-01-15 |
| Wells Fargo | Maintain | Overweight | 2026-01-15 |
| JP Morgan | Maintain | Overweight | 2026-01-14 |
| Bernstein | Upgrade | Outperform | 2026-01-05 |
| B of A Securities | Maintain | Buy | 2025-12-03 |
| JP Morgan | Maintain | Overweight | 2025-12-01 |
Onto Innovation Inc. Grades
Below is a summary of recent grades assigned to Onto Innovation by trusted grading firms.
| Grading Company | Action | New Grade | Date |
|---|---|---|---|
| Needham | Maintain | Buy | 2026-01-20 |
| B. Riley Securities | Maintain | Buy | 2026-01-15 |
| Stifel | Maintain | Hold | 2026-01-14 |
| Needham | Maintain | Buy | 2026-01-06 |
| Jefferies | Maintain | Buy | 2025-12-15 |
| Needham | Maintain | Buy | 2025-11-18 |
| B. Riley Securities | Maintain | Buy | 2025-11-18 |
| Evercore ISI Group | Maintain | Outperform | 2025-11-05 |
| Oppenheimer | Maintain | Outperform | 2025-10-14 |
| Stifel | Maintain | Hold | 2025-10-13 |
Which company has the best grades?
ASML consistently receives strong grades such as Overweight and Outperform from leading firms. Onto Innovation also earns mostly Buy and Outperform ratings but includes several Hold grades. ASML’s upgrades and maintenances reflect greater institutional confidence, which may influence investors seeking higher conviction.
Risks specific to each company
The following categories identify the critical pressure points and systemic threats facing both firms in the 2026 market environment:
1. Market & Competition
ASML Holding N.V.
- Dominates advanced lithography with high market cap but faces premium valuation risks.
Onto Innovation Inc.
- Smaller market cap, niche in process control tools, competes in a fragmented market.
2. Capital Structure & Debt
ASML Holding N.V.
- Low debt-to-equity (0.14) and debt-to-assets (5.36%) indicate conservative leverage.
Onto Innovation Inc.
- Extremely low debt levels (D/E 0.01), very strong liquidity but potential underuse of capital.
3. Stock Volatility
ASML Holding N.V.
- Beta of 1.34 shows moderate volatility typical of large-cap semiconductor firms.
Onto Innovation Inc.
- Higher beta of 1.46 suggests greater sensitivity to market swings and risk.
4. Regulatory & Legal
ASML Holding N.V.
- Operates globally with exposure to export controls, especially US-China tech tensions.
Onto Innovation Inc.
- US-centric operations face evolving regulatory scrutiny in semiconductor manufacturing.
5. Supply Chain & Operations
ASML Holding N.V.
- Complex global supply chain with high operational scale; vulnerable to geopolitical disruptions.
Onto Innovation Inc.
- Smaller scale but still exposed to supply chain risks in semiconductor components.
6. ESG & Climate Transition
ASML Holding N.V.
- Large footprint requires aggressive ESG compliance; growing investor pressure to decarbonize.
Onto Innovation Inc.
- Emerging ESG framework, less visibility but increasing stakeholder demands.
7. Geopolitical Exposure
ASML Holding N.V.
- Significant exposure to Asia and Europe amid US-China tensions impacting sales and tech transfer.
Onto Innovation Inc.
- Primarily US-based, less direct geopolitical risk but affected by trade policies.
Which company shows a better risk-adjusted profile?
ASML’s single largest risk lies in geopolitical and regulatory exposure given its global footprint and premium valuation. Onto Innovation’s greatest risk stems from higher stock volatility and operational scale limitations. ASML demonstrates a better risk-adjusted profile, supported by its robust Altman Z-score (12.4) and very strong Piotroski score (8). Onto’s elevated beta and moderate Piotroski score (4) reflect relatively higher financial and market risks. The contrast in liquidity metrics—ASML’s neutral current ratio versus Onto’s exceptionally high current ratio—signals Onto’s cautious capital deployment, which may limit growth agility amid market shifts.
Final Verdict: Which stock to choose?
ASML’s superpower lies in its durable competitive moat driven by exceptional capital efficiency and relentless innovation. It commands a premium valuation reflecting market confidence, but its high price-to-book ratio and stretched quick ratio warrant vigilance. ASML suits portfolios targeting long-term, aggressive growth with a tolerance for valuation risk.
Onto Innovation boasts a strategic moat centered on steady operational improvement and lean capital structure. It offers a safer balance sheet and strong liquidity compared to ASML, albeit with lower returns on invested capital. Onto fits well within GARP portfolios seeking growth potential balanced with financial prudence.
If you prioritize durable competitive advantage and high returns on capital, ASML outshines with its value-creating moat and strong profitability metrics. However, if you seek a more conservative growth profile with better liquidity and balance sheet safety, Onto offers superior stability and improving fundamentals. Both present distinct analytical scenarios for investors aligned with different risk and growth appetites.
Disclaimer: Investment carries a risk of loss of initial capital. The past performance is not a reliable indicator of future results. Be sure to understand risks before making an investment decision.
Go Further
I encourage you to read the complete analyses of ASML Holding N.V. and Onto Innovation Inc. to enhance your investment decisions: