Home > Comparison > Technology > ASML vs ON
The strategic rivalry between ASML Holding N.V. and ON Semiconductor Corporation shapes the semiconductor sector’s innovation race. ASML leads with capital-intensive, cutting-edge lithography systems, while ON focuses on intelligent power and sensing solutions with a diversified product mix. This head-to-head highlights a contrast between specialized manufacturing dominance and broad application-driven growth. This analysis will identify which trajectory offers superior risk-adjusted returns for a balanced, technology-focused portfolio.
Table of contents
Companies Overview
ASML Holding N.V. and ON Semiconductor Corporation are pivotal players shaping the semiconductor industry’s future.
ASML Holding N.V.: Advanced Lithography Pioneer
ASML dominates the semiconductor equipment sector with its cutting-edge lithography systems. Its revenue primarily comes from selling extreme ultraviolet and deep ultraviolet lithography machines that enable chipmakers to produce advanced semiconductor nodes. In 2026, ASML’s strategic focus centers on expanding its technology leadership through continuous innovation in computational lithography and system upgrades.
ON Semiconductor Corporation: Intelligent Power Innovator
ON Semiconductor leads in intelligent sensing and power solutions critical for electrification and sustainable energy. It generates revenue by supplying analog and mixed-signal semiconductors that power electric vehicles, fast chargers, and solar systems. The company’s 2026 strategy emphasizes scaling its power and sensing capabilities across automotive and industrial markets to capitalize on the shift toward electrification.
Strategic Collision: Similarities & Divergences
ASML pursues a highly specialized, technology-driven approach focused on closed-system lithography, while ON Semiconductor adopts a broader open-market strategy with diverse power and sensing solutions. Their main battleground is the semiconductor value chain, with ASML targeting chip fabrication and ON focusing on end-use applications. Investors face distinct profiles: ASML offers a technology moat with high barriers, while ON presents growth potential tied to electrification trends but with more market variability.
Income Statement Comparison
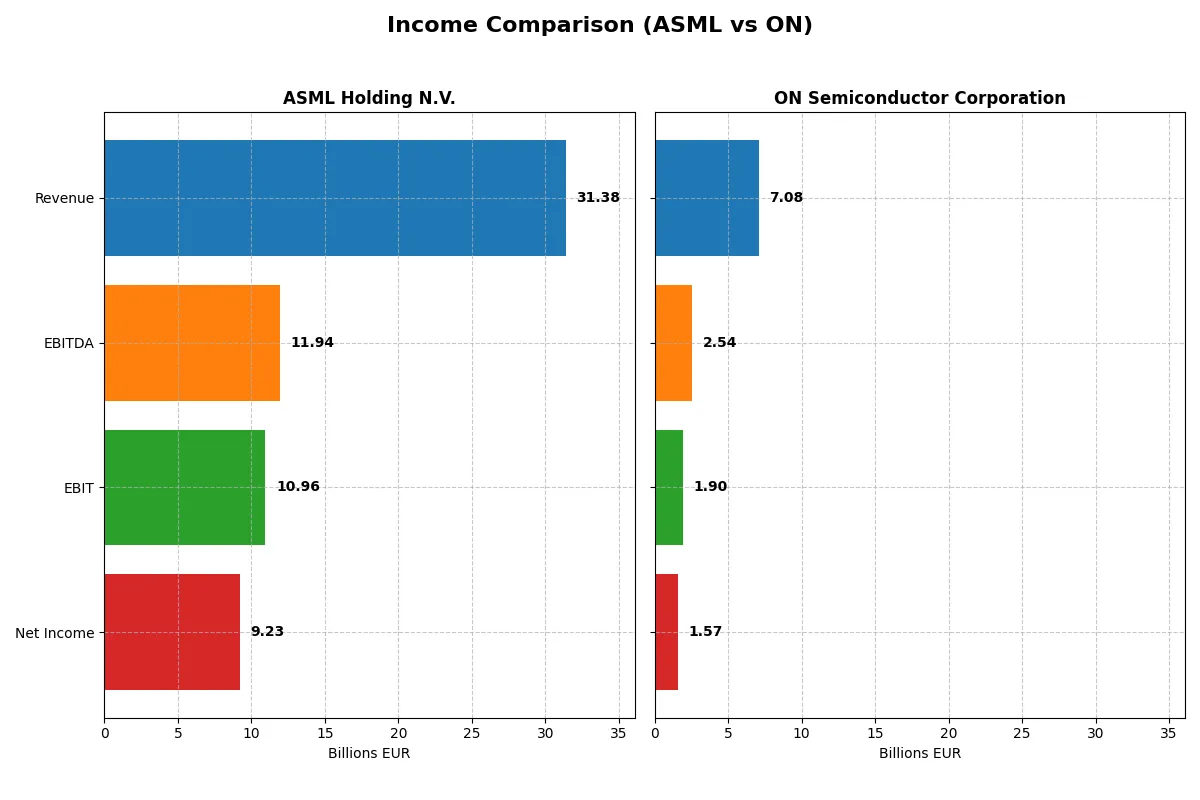
This data dissects the core profitability and scalability of both corporate engines to reveal who dominates the bottom line:
| Metric | ASML Holding N.V. (ASML) | ON Semiconductor Corporation (ON) |
|---|---|---|
| Revenue | 31.4B EUR | 7.1B USD |
| Cost of Revenue | 14.8B EUR | 3.9B USD |
| Operating Expenses | 5.7B EUR | 1.4B USD |
| Gross Profit | 16.6B EUR | 3.2B USD |
| EBITDA | 11.9B EUR | 2.5B USD |
| EBIT | 11.0B EUR | 1.9B USD |
| Interest Expense | 0 EUR | 62M USD |
| Net Income | 9.2B EUR | 1.6B USD |
| EPS | 23.76 EUR | 3.68 USD |
| Fiscal Year | 2025 | 2024 |
Income Statement Analysis: The Bottom-Line Duel
This comparison reveals how ASML Holding N.V. and ON Semiconductor Corporation leverage their income statements to drive operational efficiency and profitability.
ASML Holding N.V. Analysis
ASML’s revenue climbed steadily from 18.6B EUR in 2021 to 31.4B EUR in 2025, with net income rising from 5.9B EUR to 9.2B EUR. Its gross margin holds strong at 52.8%, and net margin stays robust near 29.4%. The 2025 results show accelerating earnings growth, signaling excellent cost control and operational leverage.
ON Semiconductor Corporation Analysis
ON’s revenue peaked at 8.3B USD in 2022 before declining 14% to 7.1B USD in 2024, while net income also fell from 2.2B USD to 1.6B USD. Despite a respectable 45.4% gross margin and 22.2% net margin in 2024, margins contracted alongside revenue. The latest year reflects margin pressure and reduced profitability momentum.
Margin Strength vs. Revenue Momentum
ASML outperforms ON with superior margin health and sustained revenue growth, delivering a nearly 30% net margin versus ON’s 22%. ASML’s expanding operating and net income confirms its operational efficiency lead. Investors favor a company that combines robust growth with strong profitability over one facing recent margin declines amid shrinking sales.
Financial Ratios Comparison
These vital ratios act as a diagnostic tool to expose the underlying fiscal health, valuation premiums, and capital efficiency of the companies compared below:
| Ratios | ASML Holding N.V. (ASML) | ON Semiconductor Corporation (ON) |
|---|---|---|
| ROE | 47.08% | 17.88% |
| ROIC | 34.14% | 11.88% |
| P/E | 38.33 | 17.13 |
| P/B | 18.05 | 3.06 |
| Current Ratio | 1.26 | 5.06 |
| Quick Ratio | 0.79 | 3.38 |
| D/E (Debt to Equity) | 0.14 | 0.38 |
| Debt-to-Assets | 5.36% | 23.90% |
| Interest Coverage | 0 (not reported) | 28.37 |
| Asset Turnover | 0.62 | 0.50 |
| Fixed Asset Turnover | 3.81 | 1.61 |
| Payout Ratio | 26.54% | 0% |
| Dividend Yield | 0.69% | 0% |
| Fiscal Year | 2025 | 2024 |
Efficiency & Valuation Duel: The Vital Signs
Financial ratios serve as a company’s DNA, unveiling operational strengths and hidden risks critical for investor insight.
ASML Holding N.V.
ASML demonstrates exceptional profitability with a 47.08% ROE and a strong 29.42% net margin, signaling operational excellence. However, its valuation appears stretched, with a high 38.33 P/E and 18.05 P/B ratios. Shareholders receive a modest 0.69% dividend yield, while significant R&D investment supports future growth.
ON Semiconductor Corporation
ON Semiconductor shows solid profitability with a 17.88% ROE and 22.21% net margin, indicating efficient operations. Its valuation is more reasonable at a 17.13 P/E, though the 3.06 P/B ratio is unfavorable. The company pays no dividend, instead focusing on reinvestment to fuel growth and innovation.
Premium Valuation vs. Operational Safety
ASML’s premium valuation reflects superior profitability but carries valuation risk. ON offers a more balanced valuation with stable returns. Investors seeking growth may prefer ASML’s strong profitability, while those prioritizing valuation discipline might favor ON’s prudent profile.
Which one offers the Superior Shareholder Reward?
I find ASML Holding N.V. offers a more compelling shareholder reward than ON Semiconductor Corporation in 2026. ASML pays a dividend yield near 0.97% with a sustainable payout ratio around 34%, well-covered by free cash flow. Its buyback program, though less aggressive than ON’s absence of dividends, complements returns by reducing shares outstanding. ON pays no dividends, instead reinvesting heavily in growth and R&D, which suits growth investors but lacks immediate shareholder cash returns. ASML’s balanced distribution—dividends plus buybacks—provides both income and capital appreciation potential. I see ASML’s model as more sustainable and attractive for total return investors today.
Comparative Score Analysis: The Strategic Profile
The radar chart reveals the fundamental DNA and trade-offs of ASML Holding N.V. and ON Semiconductor Corporation’s financial profiles:
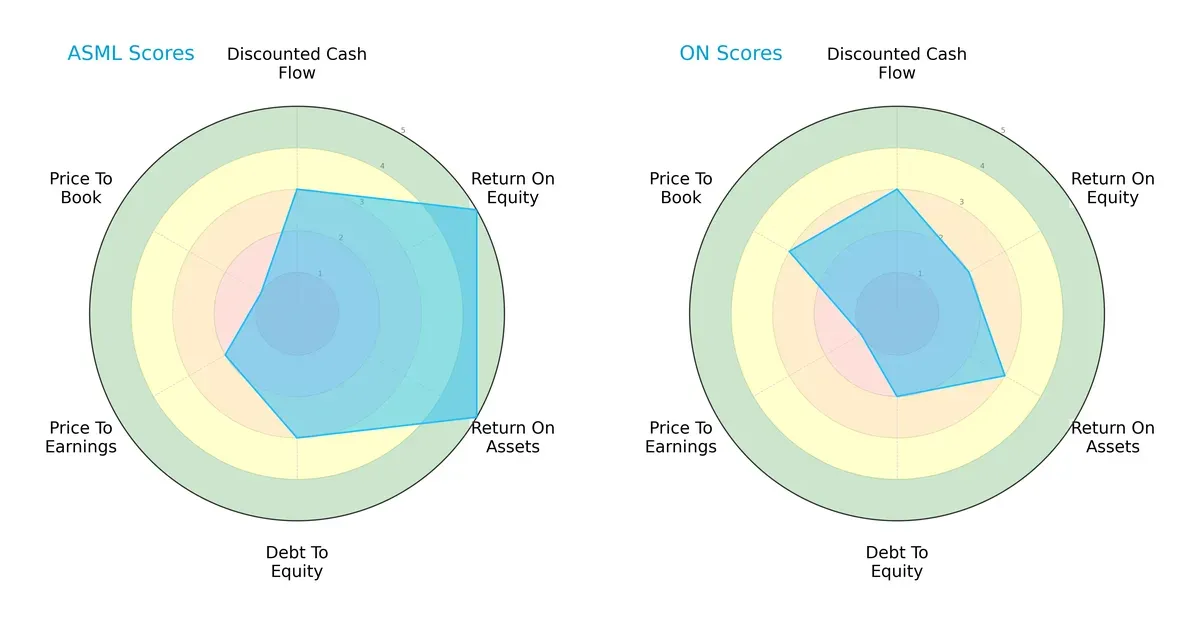
ASML shows superior efficiency with top ROE and ROA scores (5 each), indicating excellent asset and equity utilization. ON Semiconductor lags with moderate scores (ROE 2, ROA 3). Both match on discounted cash flow (3), but ASML’s debt-to-equity is stronger (3 vs. 2). Valuation metrics reveal ASML trades at a premium (P/E 2, P/B 1), while ON offers a more attractive book value score (P/B 3). ASML’s profile is more balanced with operational excellence, whereas ON relies on valuation appeal.
Bankruptcy Risk: Solvency Showdown
ASML’s Altman Z-Score of 12.4 versus ON’s 4.9 confirms both firms are in the safe zone, but ASML’s financial safety buffer is substantially higher:
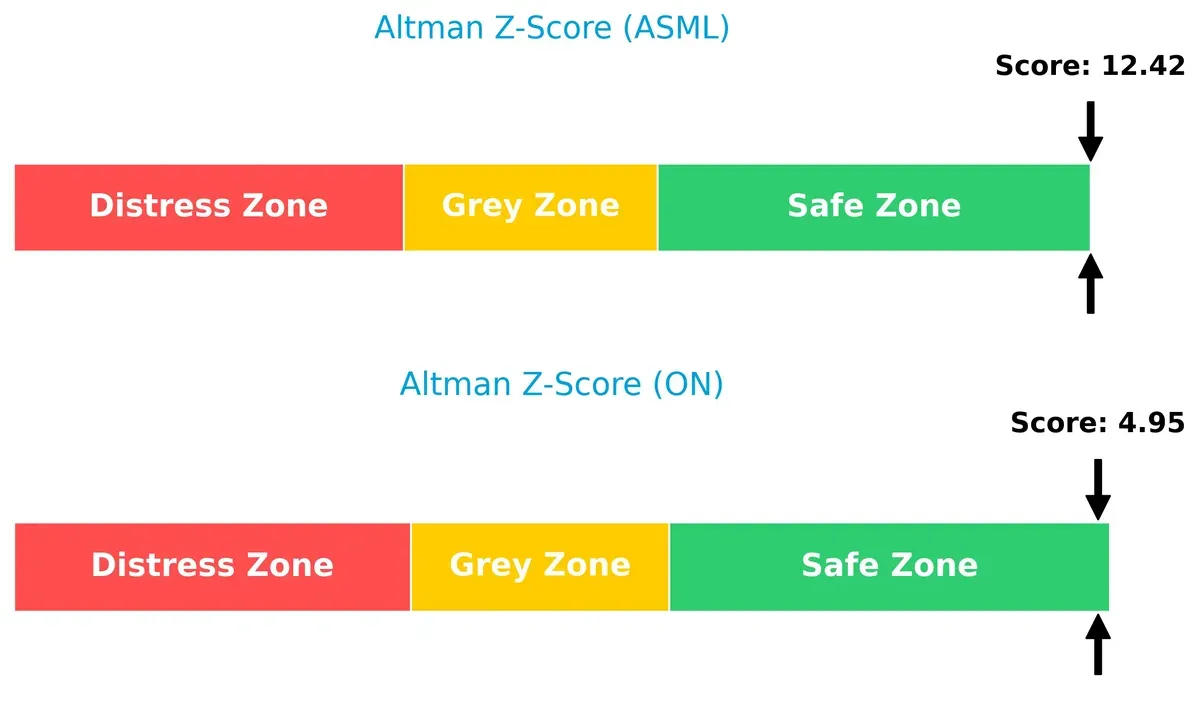
ASML’s elevated score reflects strong liquidity and low bankruptcy risk, consistent with its sector leadership. ON remains solvent but with less margin for error in turbulent cycles, warranting cautious capital allocation.
Financial Health: Quality of Operations
ASML’s Piotroski F-Score of 8 surpasses ON’s 6, signaling stronger internal financial health and operational quality:
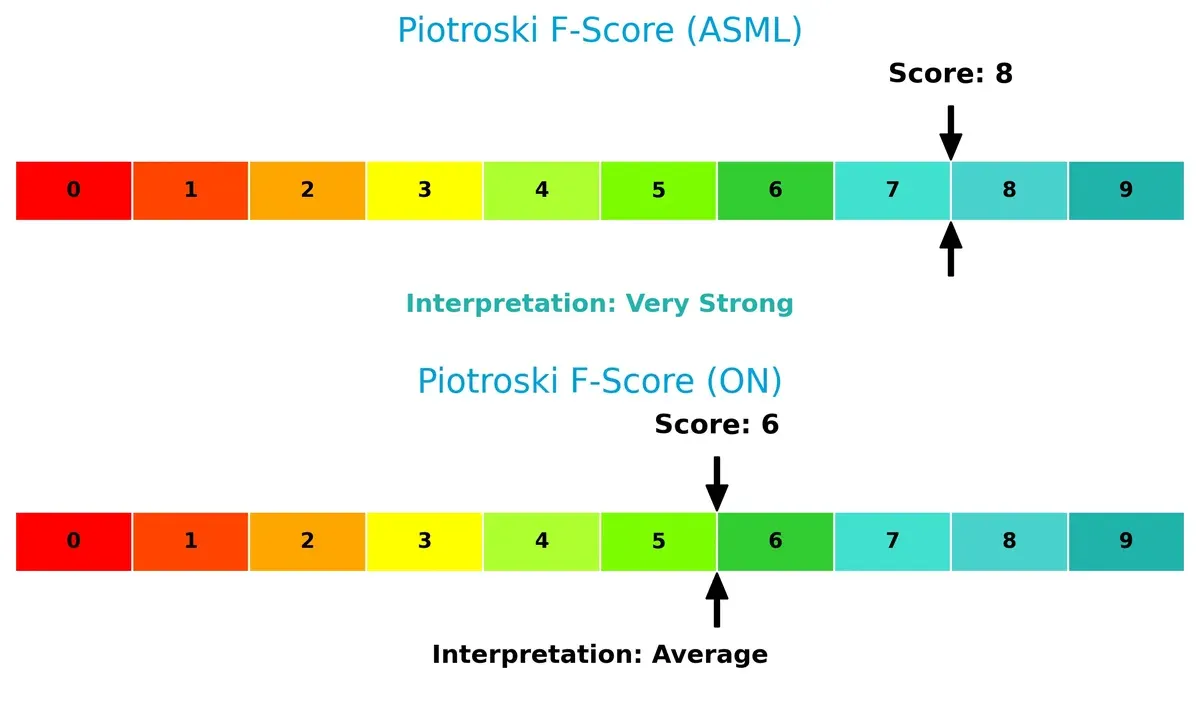
This gap highlights ASML’s superior profitability, leverage management, and efficiency metrics. ON’s average score suggests some red flags in internal controls or profitability that investors should monitor closely.
How are the two companies positioned?
This section dissects ASML and ON’s operational DNA by comparing revenue distribution and internal dynamics. The goal is to confront their economic moats and reveal which model offers the most resilient competitive advantage today.
Revenue Segmentation: The Strategic Mix
This visual comparison dissects how ASML Holding N.V. and ON Semiconductor Corporation diversify their income streams and where their primary sector bets lie:
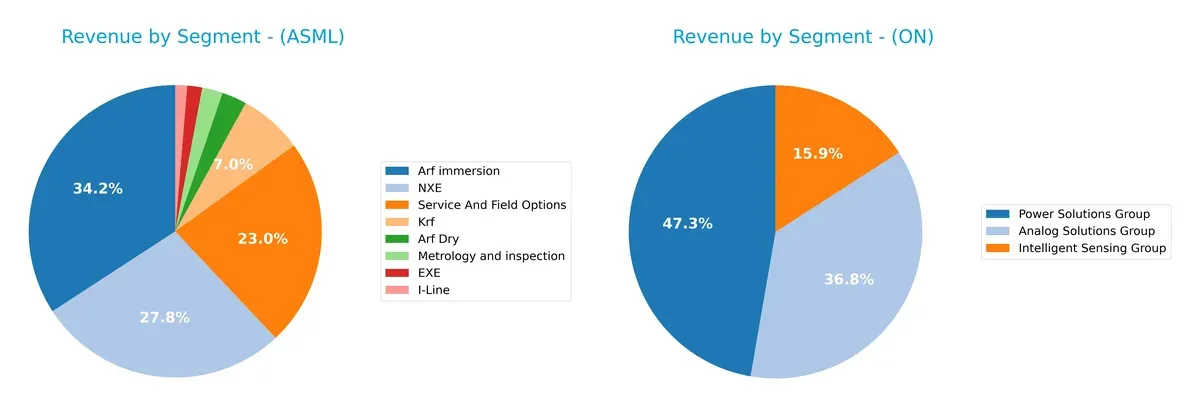
ASML anchors its revenue in advanced lithography segments, with Arf immersion at $9.7B and NXE at $7.9B, showing strong reliance on semiconductor manufacturing tech. ON Semiconductor shows a more balanced mix, with Power Solutions at $3.3B, Analog Solutions at $2.6B, and Intelligent Sensing at $1.1B. ASML’s focus drives infrastructure dominance but risks concentration, while ON’s diversified portfolio reduces exposure to single-market shifts.
Strengths and Weaknesses Comparison
This table compares the Strengths and Weaknesses of ASML Holding N.V. and ON Semiconductor Corporation:
ASML Strengths
- High net margin of 29.42%
- Strong ROE at 47.08%
- Robust ROIC at 34.14%
- Low debt-to-assets ratio of 5.36%
- Leading global presence in Asia and US
- Diverse semiconductor lithography product portfolio
ON Strengths
- Favorable net margin of 22.21%
- Solid ROE of 17.88%
- Positive ROIC at 11.88%
- High current and quick ratios indicating liquidity
- Broad geographic sales including US, UK, and Asia
- Diversified product groups in power and analog solutions
ASML Weaknesses
- High PE at 38.33 and PB at 18.05 suggest valuation premium
- Quick ratio below 1.0 at 0.79 signals liquidity concern
- Dividend yield low at 0.69%
- WACC slightly above 10%
- Moderate asset turnover
ON Weaknesses
- Elevated debt-to-assets ratio at 23.9%
- Current ratio unusually high at 5.06, possibly inefficient capital use
- PB ratio unfavorable at 3.06
- Zero dividend yield
- WACC above 10% limits capital efficiency
Both companies show balanced strengths in profitability and diversification, with ASML excelling in capital efficiency and innovation-driven segments. ON demonstrates stronger liquidity but carries higher leverage, requiring careful capital allocation to optimize returns.
The Moat Duel: Analyzing Competitive Defensibility
A structural moat is the only reliable shield protecting long-term profits from relentless competition erosion. Let’s dissect the competitive defenses of two semiconductor players:
ASML Holding N.V.: Technological Innovation Moat
ASML’s competitive edge stems from proprietary lithography technology, creating high switching costs for chipmakers. Its 25% ROIC premium over WACC and stable margins confirm durable value creation. In 2026, expanding extreme ultraviolet (EUV) systems solidifies its fortress.
ON Semiconductor Corporation: Emerging Operational Efficiency Moat
ON leans on cost advantages and growing operational efficiencies, reflected in improving ROIC trends but marginally above WACC. Unlike ASML’s tech dominance, ON’s moat is nascent, relying on expanding power solutions into automotive electrification to deepen its moat.
Verdict: Technological Innovation vs. Operational Efficiency
ASML wields a wider, deeper moat built on unmatched tech leadership and strong financials. ON’s rising profitability is promising but insufficient yet to match ASML’s fortress. ASML stands better equipped to defend and expand market share in 2026.
Which stock offers better returns?
Over the past year, ASML Holding N.V. surged 43.1%, showing strong upward momentum, while ON Semiconductor Corporation declined 24.1%, despite recent positive shifts.
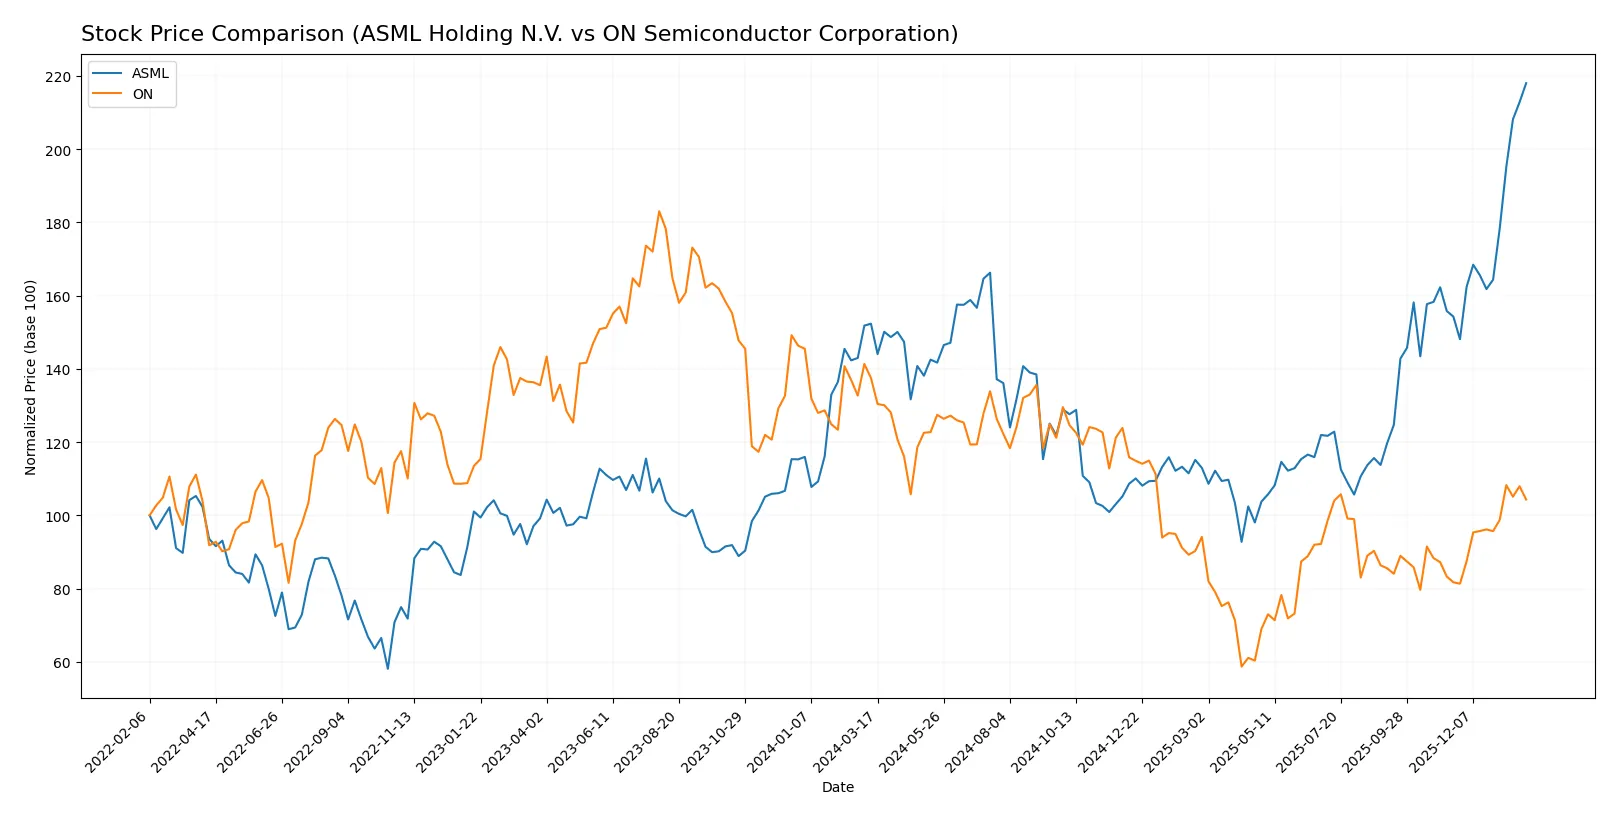
Trend Comparison
ASML’s stock shows a bullish trend with a 43.1% gain over 12 months and accelerating price growth, reaching a high of 1423.0 and a low of 605.55.
ON’s stock displays a bearish trend with a 24.1% loss over the past year, though recent months reveal a 27.6% rebound and modest acceleration.
Comparing trends, ASML clearly outperformed ON, delivering the highest market returns and sustained bullish momentum throughout the year.
Target Prices
The current analyst consensus presents a balanced view on target prices for ASML Holding N.V. and ON Semiconductor Corporation.
| Company | Target Low | Target High | Consensus |
|---|---|---|---|
| ASML Holding N.V. | 1150 | 1911 | 1458.5 |
| ON Semiconductor Corporation | 51 | 64 | 59.25 |
Analysts expect ASML’s price to slightly appreciate from its current 1423, reflecting confidence in its technological moat. ON Semiconductor’s target consensus aligns closely with its current 59.89, indicating stable market sentiment.

Don’t Let Luck Decide Your Entry Point
Optimize your entry points with our advanced ProRealTime indicators. You’ll get efficient buy signals with precise price targets for maximum performance. Start outperforming now!
How do institutions grade them?
Here is a summary of recent institutional grades for ASML Holding N.V. and ON Semiconductor Corporation:
ASML Holding N.V. Grades
The table below shows the latest grades from major financial institutions for ASML Holding N.V.:
| Grading Company | Action | New Grade | Date |
|---|---|---|---|
| Barclays | Upgrade | Overweight | 2026-01-29 |
| Wells Fargo | Maintain | Overweight | 2026-01-29 |
| RBC Capital | Maintain | Outperform | 2026-01-29 |
| Bernstein | Maintain | Outperform | 2026-01-22 |
| KGI Securities | Upgrade | Outperform | 2026-01-15 |
| Wells Fargo | Maintain | Overweight | 2026-01-15 |
| JP Morgan | Maintain | Overweight | 2026-01-14 |
| Bernstein | Upgrade | Outperform | 2026-01-05 |
| B of A Securities | Maintain | Buy | 2025-12-03 |
| JP Morgan | Maintain | Overweight | 2025-12-01 |
ON Semiconductor Corporation Grades
Below are the recent institutional grades for ON Semiconductor Corporation:
| Grading Company | Action | New Grade | Date |
|---|---|---|---|
| B of A Securities | Maintain | Neutral | 2026-01-21 |
| B. Riley Securities | Maintain | Neutral | 2026-01-20 |
| Stifel | Maintain | Hold | 2026-01-16 |
| Citigroup | Maintain | Neutral | 2026-01-15 |
| Wells Fargo | Maintain | Overweight | 2026-01-15 |
| Piper Sandler | Maintain | Overweight | 2026-01-07 |
| Truist Securities | Maintain | Hold | 2025-12-19 |
| Morgan Stanley | Maintain | Equal Weight | 2025-11-24 |
| Morgan Stanley | Maintain | Equal Weight | 2025-11-04 |
| Baird | Maintain | Neutral | 2025-11-04 |
Which company has the best grades?
ASML Holding N.V. consistently receives stronger grades, including multiple “Outperform” and “Overweight” ratings. ON Semiconductor’s grades remain mostly “Neutral” or “Hold,” with fewer upgrades. This divergence may influence investor confidence and portfolio positioning.
Risks specific to each company
The following categories identify critical pressure points and systemic threats facing ASML Holding N.V. and ON Semiconductor Corporation in the 2026 market environment:
1. Market & Competition
ASML Holding N.V.
- Dominates advanced lithography with strong technological moat but faces premium valuation risks.
ON Semiconductor Corporation
- Competes in power solutions with broader product range but lower margins and pricing pressures.
2. Capital Structure & Debt
ASML Holding N.V.
- Maintains conservative leverage (D/E 0.14) with excellent interest coverage (infinite).
ON Semiconductor Corporation
- Higher leverage (D/E 0.38) but robust interest coverage (30.5x) signals manageable debt risk.
3. Stock Volatility
ASML Holding N.V.
- Beta at 1.34 indicates moderate market sensitivity amid semiconductor cycles.
ON Semiconductor Corporation
- Higher beta of 1.54 shows elevated volatility, increasing investment risk.
4. Regulatory & Legal
ASML Holding N.V.
- Faces export controls impacting sales in China, a key market.
ON Semiconductor Corporation
- Subject to US regulatory scrutiny, particularly in defense and foundry services.
5. Supply Chain & Operations
ASML Holding N.V.
- Relies on specialized suppliers for EUV systems, vulnerable to component shortages.
ON Semiconductor Corporation
- More diversified supply chain but exposed to raw material cost fluctuations.
6. ESG & Climate Transition
ASML Holding N.V.
- Increasing ESG commitments but high energy use in manufacturing challenges carbon targets.
ON Semiconductor Corporation
- Focused on electrification solutions, directly benefiting from climate transition trends.
7. Geopolitical Exposure
ASML Holding N.V.
- Significant exposure to Asia, especially China and Taiwan tensions.
ON Semiconductor Corporation
- US-based but global footprint exposes it to trade conflicts and tariffs.
Which company shows a better risk-adjusted profile?
ASML’s strongest risk is geopolitical and regulatory pressures impacting sales in China. ON Semiconductor’s key risk lies in higher stock volatility and competitive pricing pressures. ASML’s robust balance sheet and technological moat provide a better risk-adjusted profile. Its Altman Z-Score of 12.4 and Piotroski score of 8 reflect superior financial health versus ON’s scores of 4.9 and 6. The recent surge in geopolitical tensions in Asia justifies caution but ASML’s capital strength offers resilience.
Final Verdict: Which stock to choose?
ASML’s superpower lies in its formidable economic moat, driven by a robust ROIC well above its cost of capital. It consistently creates value through innovation and operational excellence. A point of vigilance remains its elevated valuation multiples, which could temper near-term upside. It suits portfolios targeting aggressive growth with a tolerance for premium pricing.
ON Semiconductor’s strategic moat emerges from its improving profitability and expanding ROIC, signaling growing operational efficiency. Its valuation appears more reasonable, offering a safer profile relative to ASML’s premium. This stock fits well within a GARP (Growth at a Reasonable Price) portfolio, balancing growth prospects with valuation discipline.
If you prioritize durable competitive advantages and are comfortable with high valuations, ASML outshines as the compelling choice due to its proven value creation and innovation leadership. However, if you seek better valuation safety with improving profitability, ON Semiconductor offers better stability and a more accessible entry point. Both represent distinct analytical scenarios tailored to different investor risk appetites.
Disclaimer: Investment carries a risk of loss of initial capital. The past performance is not a reliable indicator of future results. Be sure to understand risks before making an investment decision.
Go Further
I encourage you to read the complete analyses of ASML Holding N.V. and ON Semiconductor Corporation to enhance your investment decisions: