Home > Comparison > Technology > NVDA vs ASML
The strategic rivalry between NVIDIA Corporation and ASML Holding N.V. shapes the semiconductor industry’s evolution. NVIDIA excels as a high-margin innovator in GPUs and AI computing platforms, while ASML dominates as a capital-intensive leader in advanced lithography equipment. This analysis pits NVIDIA’s growth-driven model against ASML’s critical manufacturing tech, aiming to identify which company offers superior risk-adjusted returns for a diversified portfolio.

Table of contents
Companies Overview
NVIDIA and ASML dominate critical segments of the semiconductor technology landscape with distinct market roles.
NVIDIA Corporation: Leader in Visual Computing and AI Solutions
NVIDIA dominates the graphics processing unit (GPU) market, generating revenue from gaming, professional visualization, and AI-driven data center platforms. Its core strength lies in delivering high-performance GPUs and software for gaming, AI, and autonomous vehicles. In 2026, NVIDIA’s strategy sharpens on expanding its AI enterprise software and automotive AI platforms, reinforcing its competitive edge in accelerated computing.
ASML Holding N.V.: Pioneer in Semiconductor Lithography
ASML commands the advanced semiconductor equipment market, specializing in lithography systems essential for chip manufacturing. Its revenues stem from selling extreme ultraviolet (EUV) and deep ultraviolet lithography machines, along with metrology and inspection systems. In 2026, ASML focuses on refining its EUV technology and computational lithography to enable more advanced semiconductor nodes, maintaining its critical role in the semiconductor supply chain.
Strategic Collision: Similarities & Divergences
NVIDIA embraces a software-hardware integrated ecosystem targeting end-user performance and AI acceleration. ASML operates as a pure-play equipment provider enabling chipmakers’ production capabilities. They compete indirectly; NVIDIA fuels demand for advanced chips, while ASML supplies the tools to manufacture them. Their investment appeal diverges—NVIDIA’s growth hinges on expanding AI applications, ASML’s on technological dominance in lithography systems.
Income Statement Comparison
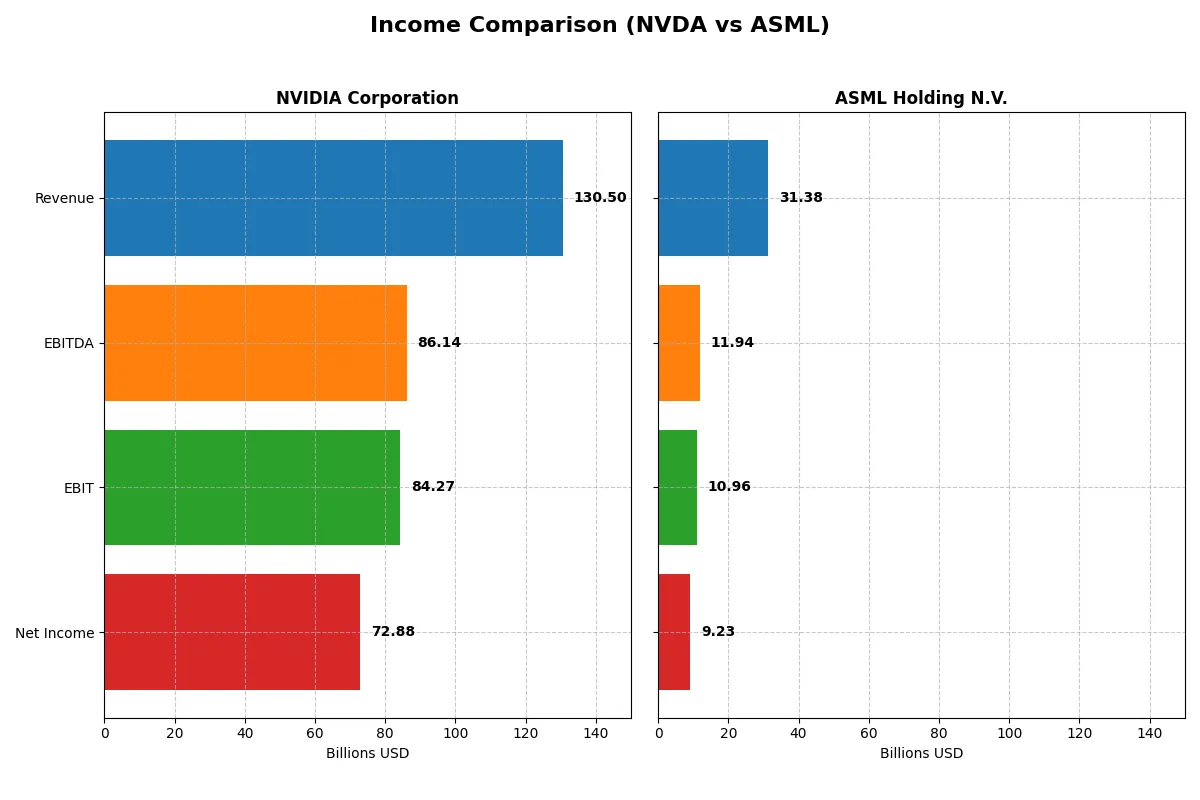
This data dissects the core profitability and scalability of both corporate engines to reveal who dominates the bottom line:
| Metric | NVIDIA Corporation (NVDA) | ASML Holding N.V. (ASML) |
|---|---|---|
| Revenue | 130.5B USD | 31.4B EUR |
| Cost of Revenue | 32.6B USD | 14.8B EUR |
| Operating Expenses | 16.4B USD | 5.7B EUR |
| Gross Profit | 97.9B USD | 16.6B EUR |
| EBITDA | 86.1B USD | 11.9B EUR |
| EBIT | 84.3B USD | 11.0B EUR |
| Interest Expense | 247M USD | 0 |
| Net Income | 72.9B USD | 0 |
| EPS | 2.97 USD | 23.76 EUR |
| Fiscal Year | 2025 | 2025 |
Income Statement Analysis: The Bottom-Line Duel
This comparison reveals which company converts revenue into profit most efficiently, exposing the true strength of each corporate engine.
NVIDIA Corporation Analysis
NVIDIA’s revenue surged from $16.7B in 2021 to $130.5B in 2025, with net income exploding from $4.3B to $72.9B. Gross margin remains robust near 75%, while net margin climbed to 55.9%, reflecting exceptional cost control and scalability. The 2025 jump showcases powerful operational momentum and superior profitability.
ASML Holding N.V. Analysis
ASML grew revenue steadily from €18.6B in 2021 to €31.4B in 2025, with net income rising from €5.9B to €9.2B. Gross margin hovers around 53%, and net margin stands at 29.4%, signaling solid but less aggressive margin expansion. The company maintains consistent efficiency gains, but growth lacks NVIDIA’s explosive acceleration.
Margin Mastery vs. Steady Growth
NVIDIA outpaces ASML dramatically in revenue growth and margin expansion, delivering a net margin nearly double ASML’s. While ASML shows steady, reliable progress, NVIDIA’s scale and profitability dominate. For investors prioritizing rapid earnings growth and high efficiency, NVIDIA’s profile presents a more compelling fundamental case.
Financial Ratios Comparison
These vital ratios act as a diagnostic tool to expose the underlying fiscal health, valuation premiums, and capital efficiency of these two semiconductor leaders:
| Ratios | NVIDIA Corporation (NVDA) | ASML Holding N.V. (ASML) |
|---|---|---|
| ROE | 91.9% | 47.1% |
| ROIC | 75.3% | 34.1% |
| P/E | 39.9 | 38.3 |
| P/B | 36.7 | 18.0 |
| Current Ratio | 4.44 | 1.26 |
| Quick Ratio | 3.88 | 0.79 |
| D/E | 0.13 | 0.14 |
| Debt-to-Assets | 9.2% | 5.4% |
| Interest Coverage | 330x | N/A |
| Asset Turnover | 1.17 | 0.62 |
| Fixed Asset Turnover | 16.2 | 3.81 |
| Payout ratio | 1.1% | 26.5% |
| Dividend yield | 0.029% | 0.69% |
| Fiscal Year | 2025 | 2025 |
Efficiency & Valuation Duel: The Vital Signs
Financial ratios act as a company’s DNA, revealing hidden risks and operational excellence crucial for investment analysis.
NVIDIA Corporation
NVIDIA exhibits exceptional profitability with a 91.87% ROE and a commanding 55.85% net margin, demonstrating operational dominance. However, its valuation is stretched, with a P/E near 40 and a P/B of 36.66, reflecting high market expectations. Shareholder returns are minimal via dividends, favoring reinvestment in robust R&D to fuel growth.
ASML Holding N.V.
ASML shows solid profitability, posting a 47.08% ROE and a 29.42% net margin, reflecting efficient operations. The P/E ratio stands at 38.33, indicating a slightly stretched valuation but less extreme than NVIDIA. Dividends yield 0.69%, suggesting moderate shareholder returns alongside steady reinvestment in innovation and capital expenditures.
Premium Valuation vs. Operational Safety
NVIDIA commands a premium valuation justified by superior profitability and reinvestment strategy but carries valuation risk. ASML offers a more balanced profile with solid returns and moderate shareholder payouts. Investors seeking aggressive growth may prefer NVIDIA, while those favoring steadier operational safety might lean toward ASML.
Which one offers the Superior Shareholder Reward?
I observe NVIDIA delivers a minimal dividend yield near 0.03%, with an ultra-low payout ratio around 1%. It aggressively reinvests free cash flow (2.5/share) into growth and innovation. Buybacks are significant but less disclosed here. ASML offers a higher dividend yield close to 0.7%, with a payout near 27%, supported by strong free cash flow (27.4/share) and regular buybacks. ASML’s model balances income with growth, while NVIDIA prioritizes capital reinvestment. For 2026, I favor ASML’s more sustainable, shareholder-friendly total return profile, blending dividends and buybacks with solid cash flow.
Comparative Score Analysis: The Strategic Profile
The radar chart reveals the fundamental DNA and trade-offs of NVIDIA Corporation and ASML Holding N.V., highlighting their financial strengths and valuation complexities:
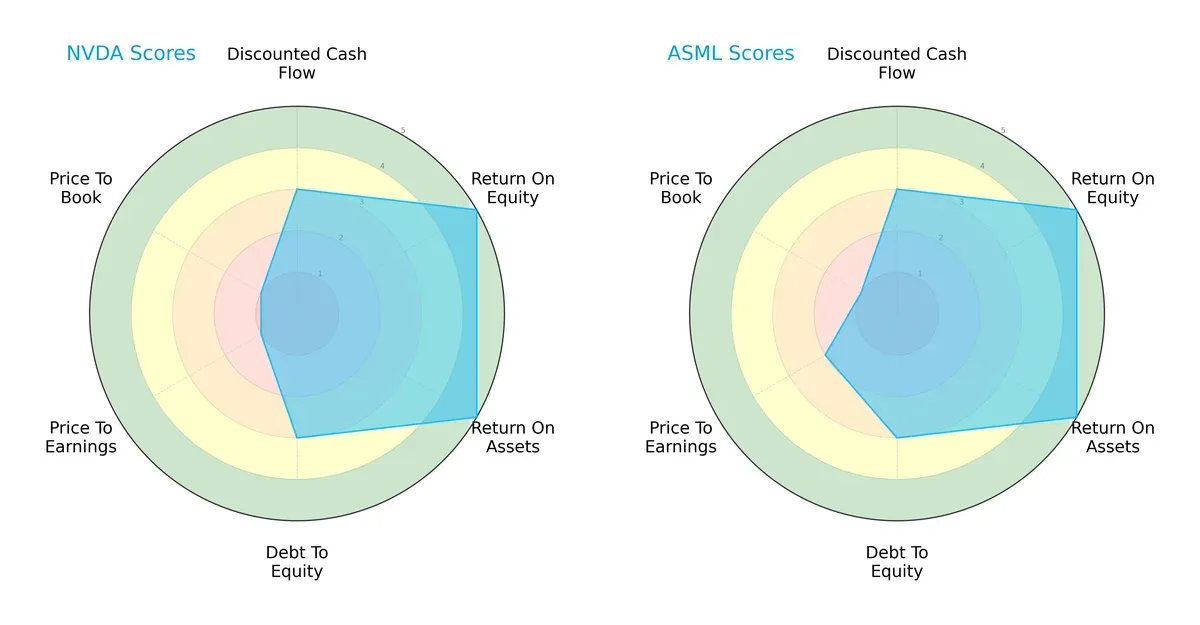
Both firms share identical scores in overall, discounted cash flow, ROE, ROA, and debt-to-equity metrics, demonstrating balanced operational efficiency and moderate leverage. However, ASML edges NVIDIA slightly on price-to-earnings valuation (moderate vs. very unfavorable), suggesting ASML trades at a more reasonable earnings multiple. NVIDIA’s valuation scores on P/E and P/B are very unfavorable, indicating potential overpricing risks despite its strong profitability. ASML offers a marginally more balanced risk-return profile grounded in valuation discipline.
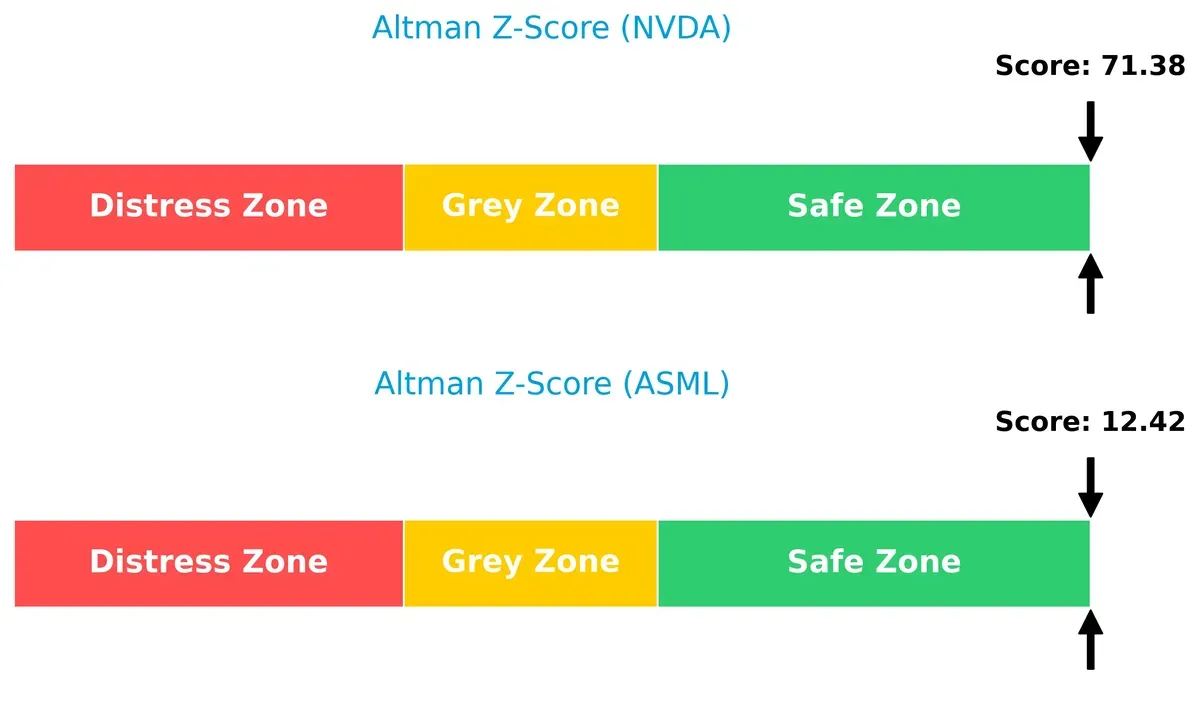
Bankruptcy Risk: Solvency Showdown
The Altman Z-Scores place NVIDIA at 71.4 and ASML at 12.4, both well within the safe zone, signaling robust solvency and minimal bankruptcy risk in this cycle:
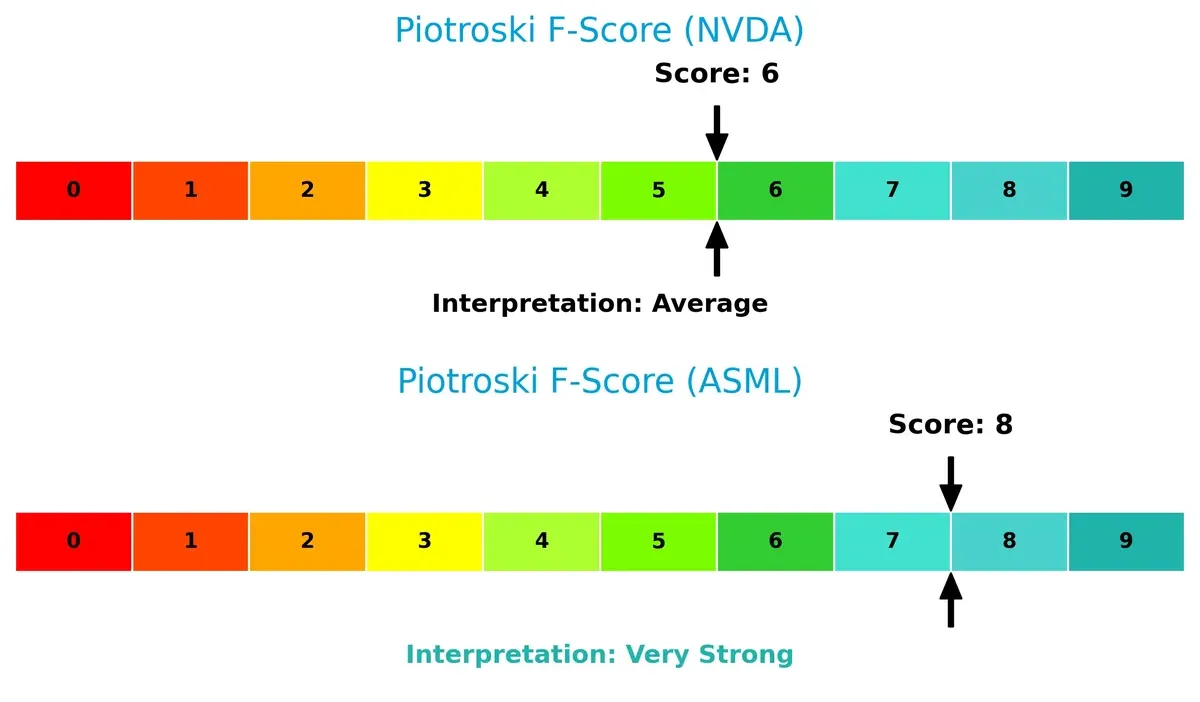
Financial Health: Quality of Operations
ASML’s Piotroski F-Score of 8 beats NVIDIA’s 6, indicating stronger internal financial health and operational quality. NVIDIA’s average score suggests minor red flags versus ASML’s very strong fundamentals:
How are the two companies positioned?
This section dissects the operational DNA of NVIDIA and ASML by comparing their revenue distribution and internal strengths and weaknesses. The goal is to confront their economic moats and identify which model offers the most resilient competitive advantage today.
Revenue Segmentation: The Strategic Mix
This comparison dissects how NVIDIA and ASML diversify their income streams and reveals where each firm places its primary sector bets:
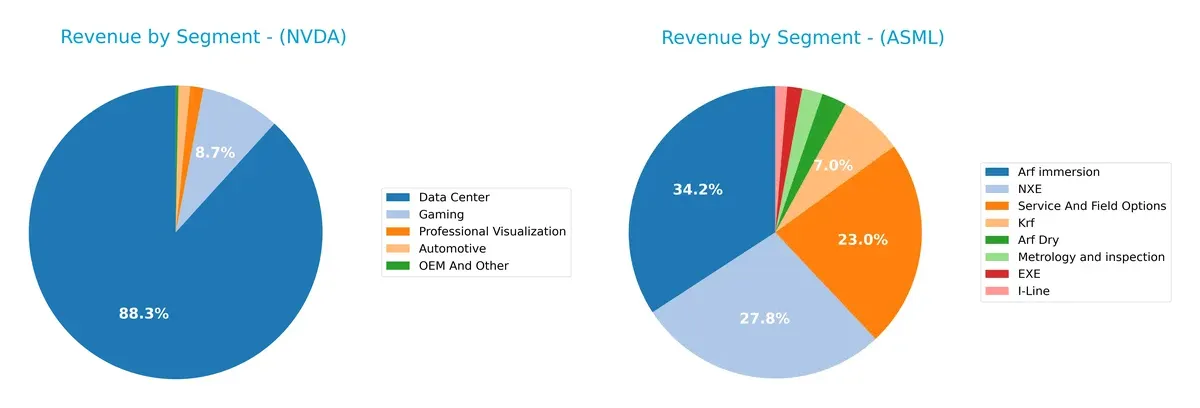
NVIDIA’s revenue pivots heavily on its Data Center segment, which dwarfs others at $115B in 2025, anchoring its AI and cloud dominance. In contrast, ASML balances across lithography systems and service options, with Arf immersion ($9.7B) and NXE ($7.9B) leading. NVIDIA’s concentration risks its dependency on hyperscale demand, while ASML’s diversified mix secures resilience through hardware sales and long-term service contracts.
Strengths and Weaknesses Comparison
This table compares the Strengths and Weaknesses of NVIDIA and ASML:
NVIDIA Strengths
- High net margin of 55.85%
- Exceptional ROE at 91.87%
- Strong ROIC at 75.28%
- Diverse revenue streams across Data Center, Gaming, Automotive
- Robust global presence with significant US and Asia sales
- Low debt-to-assets ratio at 9.2%
- Excellent asset turnover ratios
ASML Strengths
- Solid net margin of 29.42%
- Strong ROE at 47.08%
- Favorable ROIC of 34.14%
- Diverse product portfolio including EUV and Metrology
- Significant sales in China, Korea, Taiwan, and US
- Very strong interest coverage ratio
- Moderate debt-to-assets ratio at 5.36%
NVIDIA Weaknesses
- High WACC at 14.69% indicating costly capital
- Elevated P/E and P/B ratios suggest premium valuation
- Very high current ratio at 4.44 may indicate inefficient asset use
- Minimal dividend yield at 0.03%
- Concentrated market share in Data Center segment
- Possible risk from unfavorable liquidity metrics
ASML Weaknesses
- WACC of 10.08% is relatively high for the sector
- Unfavorable quick ratio at 0.79 signals liquidity concerns
- P/E and P/B ratios remain elevated
- Dividend yield low at 0.69%
- Asset turnover ratio moderate at 0.62
- Some geographic concentration in East Asia
NVIDIA’s superior profitability and strong global diversification contrast with its costly capital and valuation premium. ASML balances solid financials with product innovation but faces liquidity pressures. These factors shape each company’s strategic opportunities and challenges.
The Moat Duel: Analyzing Competitive Defensibility
A structural moat is the only reliable shield that protects long-term profits from relentless competitive pressures and market disruption:
NVIDIA Corporation: AI-Driven Innovation and Ecosystem Lock-in
NVIDIA’s moat stems from dominant AI computing platforms and deep ecosystem lock-in. Its soaring ROIC above 60% reflects efficient capital use and margin stability. Expansion into AI and autonomous vehicles in 2026 should deepen this advantage.
ASML Holding N.V.: Exclusive Lithography Technology Barrier
ASML’s moat relies on near-monopoly in advanced lithography systems. Its ROIC above 24% confirms value creation, though lower than NVIDIA’s. Sustained demand for EUV tools and geographic diversification support steady moat growth into 2026.
Verdict: AI Ecosystem Lock-in vs. Lithography Monopoly
NVIDIA’s wider moat outpaces ASML’s specialized technology barrier by delivering superior ROIC and faster growth. I believe NVIDIA is better equipped to defend and expand its market share amid accelerating AI innovation.
Which stock offers better returns?
Over the past year, NVIDIA’s stock surged over 118%, showing strong gains with slowing momentum, while ASML gained 43% with accelerating upward momentum and notably higher volatility.
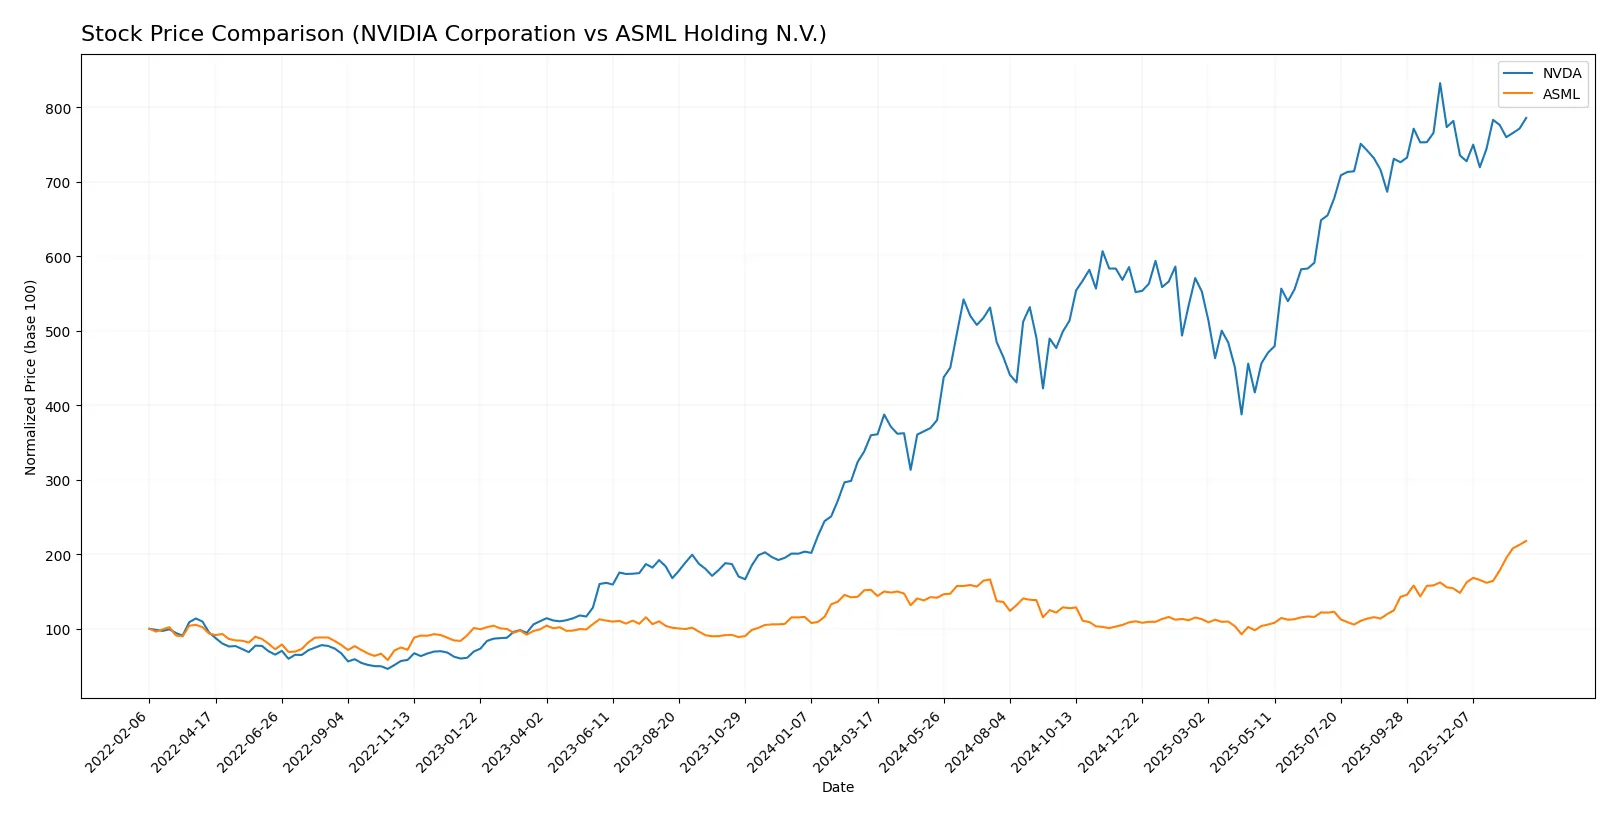
Trend Comparison
NVIDIA’s stock rose 118.36% over 12 months, marking a bullish trend with decelerating momentum and a volatility level at 32.29, peaking at 202.49 and bottoming at 76.2.
ASML’s stock climbed 43.11% over the same period, sustaining a bullish trend with accelerating momentum but much higher volatility at 170.09, reaching a peak of 1423.0 and a low of 605.55.
NVIDIA outperformed ASML in total return despite decelerating momentum, delivering the highest market gains over the past year.
Target Prices
Analysts show a broad but optimistic target range for NVIDIA Corporation and ASML Holding N.V.
| Company | Target Low | Target High | Consensus |
|---|---|---|---|
| NVIDIA Corporation | 140 | 352 | 265.21 |
| ASML Holding N.V. | 1150 | 1911 | 1458.5 |
The consensus target prices for NVIDIA and ASML exceed current prices by a significant margin, indicating strong analyst confidence despite recent market volatility.

Don’t Let Luck Decide Your Entry Point
Optimize your entry points with our advanced ProRealTime indicators. You’ll get efficient buy signals with precise price targets for maximum performance. Start outperforming now!
How do institutions grade them?
The following tables summarize recent institutional grades for NVIDIA Corporation and ASML Holding N.V.:
NVIDIA Corporation Grades
This table lists the latest grades issued by reputable financial institutions for NVIDIA.
| Grading Company | Action | New Grade | Date |
|---|---|---|---|
| Jefferies | Maintain | Buy | 2026-01-16 |
| Mizuho | Maintain | Outperform | 2026-01-09 |
| Stifel | Maintain | Buy | 2025-12-29 |
| Truist Securities | Maintain | Buy | 2025-12-29 |
| Bernstein | Maintain | Outperform | 2025-12-26 |
| Baird | Maintain | Outperform | 2025-12-26 |
| B of A Securities | Maintain | Buy | 2025-12-26 |
| Truist Securities | Maintain | Buy | 2025-12-19 |
| Tigress Financial | Maintain | Strong Buy | 2025-12-18 |
| Morgan Stanley | Maintain | Overweight | 2025-12-01 |
ASML Holding N.V. Grades
This table shows recent grades from well-known grading companies for ASML Holding.
| Grading Company | Action | New Grade | Date |
|---|---|---|---|
| Barclays | Upgrade | Overweight | 2026-01-29 |
| Wells Fargo | Maintain | Overweight | 2026-01-29 |
| RBC Capital | Maintain | Outperform | 2026-01-29 |
| Bernstein | Maintain | Outperform | 2026-01-22 |
| KGI Securities | Upgrade | Outperform | 2026-01-15 |
| Wells Fargo | Maintain | Overweight | 2026-01-15 |
| JP Morgan | Maintain | Overweight | 2026-01-14 |
| Bernstein | Upgrade | Outperform | 2026-01-05 |
| B of A Securities | Maintain | Buy | 2025-12-03 |
| JP Morgan | Maintain | Overweight | 2025-12-01 |
Which company has the best grades?
Both companies receive predominantly positive grades from reputable institutions. NVIDIA shows consistent “Buy” and “Outperform” ratings, including a “Strong Buy” from Tigress Financial. ASML benefits from multiple recent upgrades to “Overweight” and “Outperform.” ASML’s recent upward revisions suggest growing institutional confidence, while NVIDIA maintains steady strong support. Investors may interpret ASML’s trend of upgrades as a signal of improving outlook relative to NVIDIA’s stable but unchanged ratings.
Risks specific to each company
The following categories outline critical pressure points and systemic threats facing NVIDIA Corporation and ASML Holding N.V. in the 2026 market environment:
1. Market & Competition
NVIDIA Corporation
- Faces intense competition in GPUs and AI sectors with rapid innovation cycles.
ASML Holding N.V.
- Dominates lithography equipment but challenged by evolving semiconductor tech and customer concentration.
2. Capital Structure & Debt
NVIDIA Corporation
- Low debt-to-equity ratio (0.13) signals conservative leverage and strong balance sheet.
ASML Holding N.V.
- Similarly low leverage (0.14 DE), maintaining financial flexibility in capital-intensive industry.
3. Stock Volatility
NVIDIA Corporation
- High beta of 2.314 indicates significant stock price volatility relative to market.
ASML Holding N.V.
- Moderate beta at 1.341 suggests less sensitivity to market swings.
4. Regulatory & Legal
NVIDIA Corporation
- US-based with exposure to export controls and antitrust scrutiny in tech sector.
ASML Holding N.V.
- EU-based with complex compliance in multiple jurisdictions, including export restrictions on advanced tech.
5. Supply Chain & Operations
NVIDIA Corporation
- Relies on global semiconductor foundries and geopolitical hotspots like Taiwan and China.
ASML Holding N.V.
- Faces risks from specialized suppliers and long lead times for lithography components.
6. ESG & Climate Transition
NVIDIA Corporation
- Moderate ESG risks due to energy-intensive data centers and manufacturing footprint.
ASML Holding N.V.
- Stronger focus on sustainable manufacturing and climate initiatives but still exposed to resource constraints.
7. Geopolitical Exposure
NVIDIA Corporation
- High exposure to US-China tensions impacting supply and sales channels.
ASML Holding N.V.
- Significant exposure to Asia-Pacific tensions given customer base in Taiwan, South Korea, and China.
Which company shows a better risk-adjusted profile?
NVIDIA’s highest risk lies in market volatility amplified by its high beta and competitive pressure in AI chips. ASML’s key risk stems from geopolitical exposure and supply chain complexity amid semiconductor tech shifts. Despite its volatility, NVIDIA’s strong capital structure and profitability provide a robust cushion. ASML’s stable beta and very strong Piotroski score signal financial resilience but geopolitical tensions remain a material concern. Overall, ASML offers a more balanced risk-adjusted profile due to lower volatility and very strong financial health, even as both firms navigate a challenging semiconductor landscape.
Final Verdict: Which stock to choose?
NVIDIA’s superpower lies in its unmatched efficiency and explosive growth trajectory, driven by dominant market positioning in AI and GPUs. Its high valuation multiples and stretched current ratio are points of vigilance. It suits aggressive growth portfolios seeking significant capital appreciation.
ASML commands a strategic moat through its irreplaceable lithography technology and recurring revenue stream from semiconductor manufacturing customers. It offers better financial stability compared to NVIDIA’s high-flying profile. ASML fits well in GARP portfolios balancing growth and reasonable valuation.
If you prioritize rapid innovation and market disruption, NVIDIA is the compelling choice due to its superior ROIC growth and robust cash generation. However, if you seek stability with a durable competitive advantage and consistent free cash flow, ASML offers better stability and a safer investment profile despite a more moderate growth pace.
Disclaimer: Investment carries a risk of loss of initial capital. The past performance is not a reliable indicator of future results. Be sure to understand risks before making an investment decision.
Go Further
I encourage you to read the complete analyses of NVIDIA Corporation and ASML Holding N.V. to enhance your investment decisions: