Home > Comparison > Technology > ASML vs NVEC
The strategic rivalry between ASML Holding N.V. and NVE Corporation shapes the semiconductor landscape. ASML dominates as a capital-intensive semiconductor equipment giant, while NVE focuses on niche spintronic sensor innovation with a lean operational model. This contrast highlights a battle between scale-driven technological leadership and specialized innovation. This analysis aims to identify which trajectory offers superior risk-adjusted returns for a diversified portfolio in the evolving tech sector.
Table of contents
Companies Overview
ASML Holding N.V. and NVE Corporation represent two distinct pillars within the semiconductor sector, each driving innovation in their specialized niches.
ASML Holding N.V.: Semiconductor Equipment Pioneer
ASML dominates the semiconductor equipment market with its advanced lithography systems, critical for chipmakers worldwide. Its core revenue stems from selling and servicing extreme ultraviolet and deep ultraviolet lithography machines. In 2026, ASML focuses on enhancing computational lithography and system upgrades, reinforcing its technological leadership and broad global footprint.
NVE Corporation: Spintronics Innovator
NVE Corporation specializes in spintronic devices that leverage electron spin for data acquisition and transmission. Its revenue primarily comes from sensors and couplers used in factory automation and medical markets. In 2026, NVE concentrates on expanding its Industrial IoT presence and advancing magnetoresistive memory licensing, reflecting a nimble approach in a niche semiconductor segment.
Strategic Collision: Similarities & Divergences
ASML and NVE share a commitment to semiconductor innovation but diverge in scale and scope—ASML’s capital-intensive lithography systems contrast with NVE’s focused spintronic sensor technology. Their battleground lies in serving semiconductor production versus specialized device markets. ASML’s vast global reach contrasts with NVE’s targeted, research-driven profile, defining distinct investment dynamics within the semiconductor ecosystem.
Income Statement Comparison
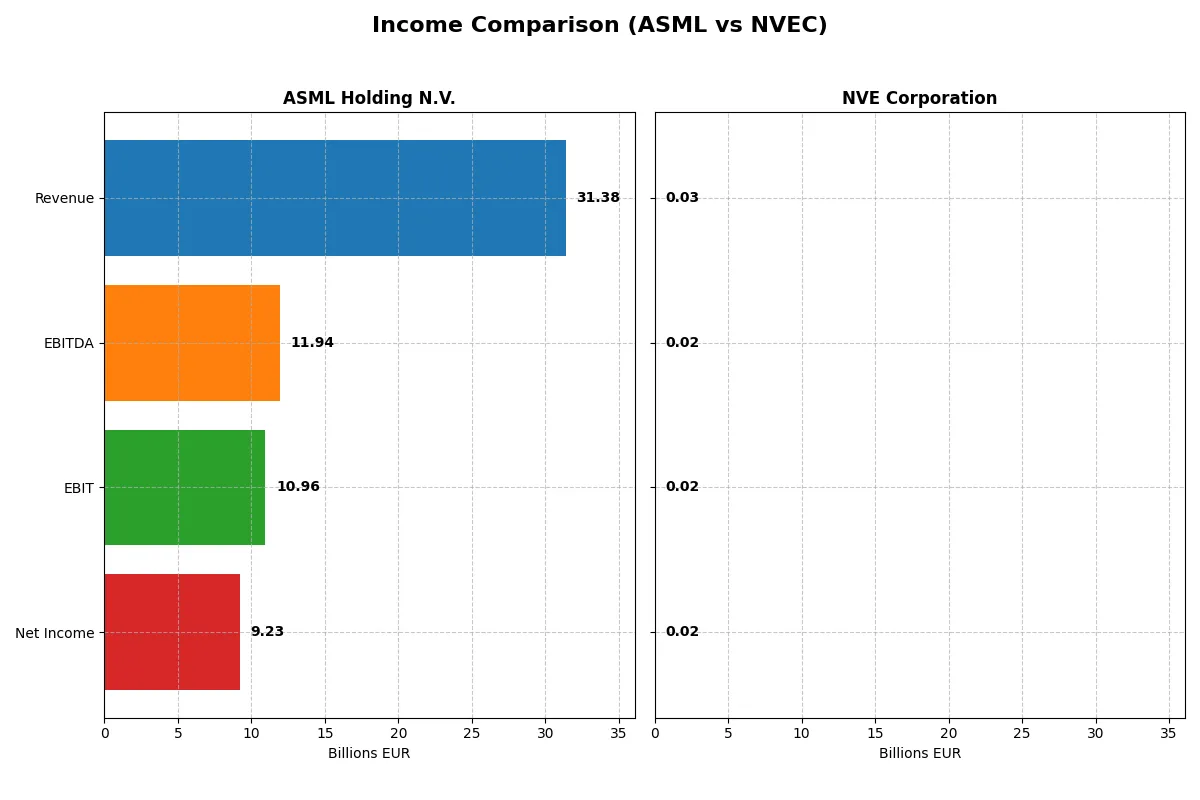
This data dissects the core profitability and scalability of both corporate engines to reveal who dominates the bottom line:
| Metric | ASML Holding N.V. (ASML) | NVE Corporation (NVEC) |
|---|---|---|
| Revenue | 31.4B EUR | 25.9M USD |
| Cost of Revenue | 14.8B EUR | 4.2M USD |
| Operating Expenses | 5.7B EUR | 5.6M USD |
| Gross Profit | 16.6B EUR | 21.6M USD |
| EBITDA | 11.9B EUR | 16.3M USD |
| EBIT | 11.0B EUR | 16.0M USD |
| Interest Expense | 0 | 0 |
| Net Income | 9.2B EUR | 15.1M USD |
| EPS | 23.76 EUR | 3.12 USD |
| Fiscal Year | 2025 | 2025 |
Income Statement Analysis: The Bottom-Line Duel
This income statement comparison uncovers which company runs a more efficient and profitable business engine in the current market cycle.
ASML Holding N.V. Analysis
ASML’s revenue surged 11% to €31.4B in 2025, with net income climbing 22% to €9.2B. Its gross margin holds strong at 52.8%, while the net margin remains robust near 29.4%. The company’s EBIT margin expanded to 34.9%, signaling improved operational efficiency and solid momentum heading into 2026.
NVE Corporation Analysis
NVE’s revenue contracted 13% to $25.9M in 2025, while net income declined 12% to $15.1M. Despite this, it sustains a remarkable gross margin of 83.6% and an even more impressive net margin at 58.2%. The EBIT margin stands at 61.8%, reflecting high profitability but recent softness in top-line growth.
Margin Dominance vs. Growth Momentum
ASML leads with strong revenue and net income growth, showing scalable margins around 30%. NVE boasts exceptional margins but faces a revenue downturn. ASML’s combination of growth and efficiency offers a clearer path for sustained profitability. Investors looking for growth aligned with margin stability may find ASML’s profile more compelling.
Financial Ratios Comparison
These vital ratios act as a diagnostic tool to expose the underlying fiscal health, valuation premiums, and capital efficiency of the companies compared below:
| Ratios | ASML Holding N.V. (ASML) | NVE Corporation (NVEC) |
|---|---|---|
| ROE | 47.08% | 24.19% |
| ROIC | 34.14% | 21.14% |
| P/E | 38.33 | 20.46 |
| P/B | 18.05 | 4.95 |
| Current Ratio | 1.26 | 28.40 |
| Quick Ratio | 0.79 | 22.03 |
| D/E (Debt-to-Equity) | 0.14 | 0.01 |
| Debt-to-Assets | 5.36% | 1.43% |
| Interest Coverage | N/A | N/A |
| Asset Turnover | 0.62 | 0.40 |
| Fixed Asset Turnover | 3.81 | 8.91 |
| Payout ratio | 26.54% | 128.38% |
| Dividend yield | 0.69% | 6.28% |
| Fiscal Year | 2025 | 2025 |
Efficiency & Valuation Duel: The Vital Signs
Ratios act as the company’s DNA, revealing hidden risks and operational excellence that numbers alone cannot fully capture.
ASML Holding N.V.
ASML reports a commanding ROE of 47% and a strong net margin of 29.4%, showcasing robust profitability. However, its P/E ratio of 38.3 signals a stretched valuation compared to market norms. The company returns modest dividends at 0.69%, favoring reinvestment in R&D to sustain growth and technological leadership.
NVE Corporation
NVE boasts an impressive net margin of 58.2% but a lower ROE of 24.2%, highlighting efficient profit conversion with moderate equity returns. Its P/E of 20.5 appears reasonable, suggesting fair valuation. NVE pays a 6.28% dividend yield, balancing shareholder returns with ongoing investments in R&D for future expansion.
Premium Valuation vs. Operational Safety
ASML’s high profitability comes with a premium valuation and restrained dividend, reflecting a growth-focused strategy with moderate risk. NVE offers a more balanced valuation and stronger dividend yield, indicating operational efficiency with income appeal. Investors seeking growth might prefer ASML, while income-focused profiles could favor NVE’s stable returns.
Which one offers the Superior Shareholder Reward?
I observe ASML’s steady dividend yield around 0.7–1.2% with a moderate payout ratio (~27–34%). Its buybacks are less emphasized but supported by strong free cash flow (24–27/share). NVEC impresses with a high dividend yield near 4.5–6.3%, though payout ratios exceed 100%, signaling dividends above free cash flow (2.7–3.8/share). NVEC’s massive cash buffers (cash ratio >6) and negligible debt support buybacks, but its dividend coverage is less sustainable. ASML’s balanced yield, controlled payout, and robust free cash flow underpin a more sustainable total return in 2026. I conclude ASML offers the superior shareholder reward through disciplined capital allocation and stable distributions.
Comparative Score Analysis: The Strategic Profile
The radar chart reveals the fundamental DNA and trade-offs of ASML Holding N.V. and NVE Corporation, highlighting their core financial strengths and weaknesses:
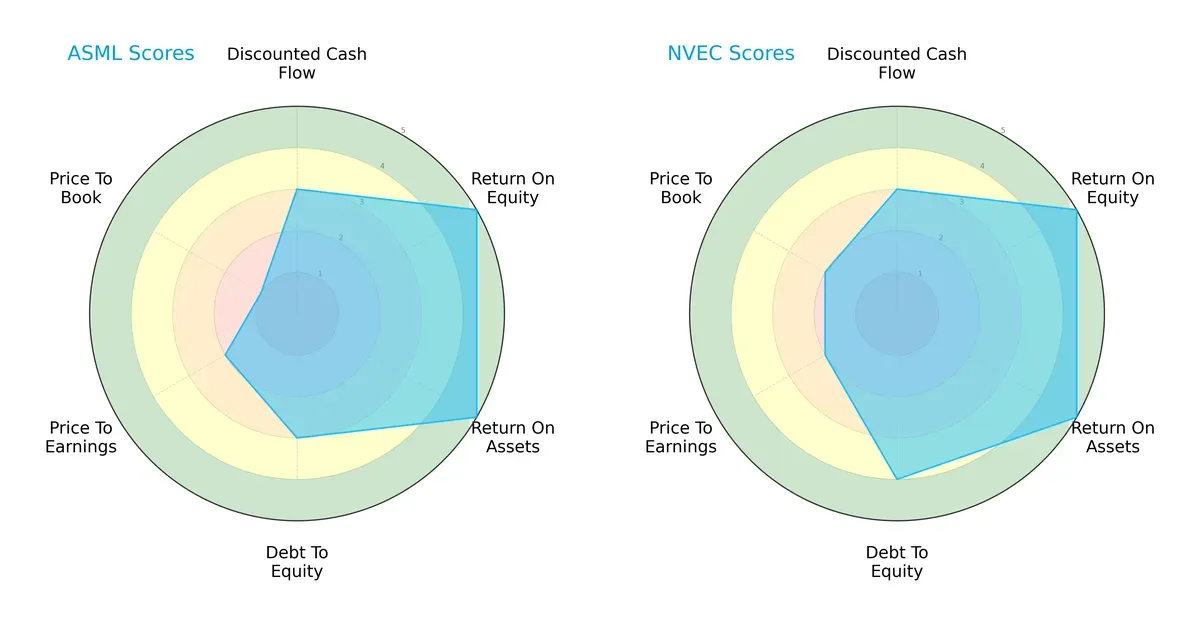
ASML and NVE share top marks in ROE and ROA, reflecting strong profitability and asset efficiency. NVE leads with a better overall score (4 vs. 3) and a stronger debt-to-equity profile, indicating lower financial risk. Conversely, ASML suffers valuation pressure with a very unfavorable price-to-book score, while NVE maintains a more balanced valuation multiple. ASML relies on operational excellence, while NVE offers a more balanced financial profile.
Bankruptcy Risk: Solvency Showdown
NVE’s Altman Z-Score (120.35) far exceeds ASML’s (12.42), both safely in the safe zone:
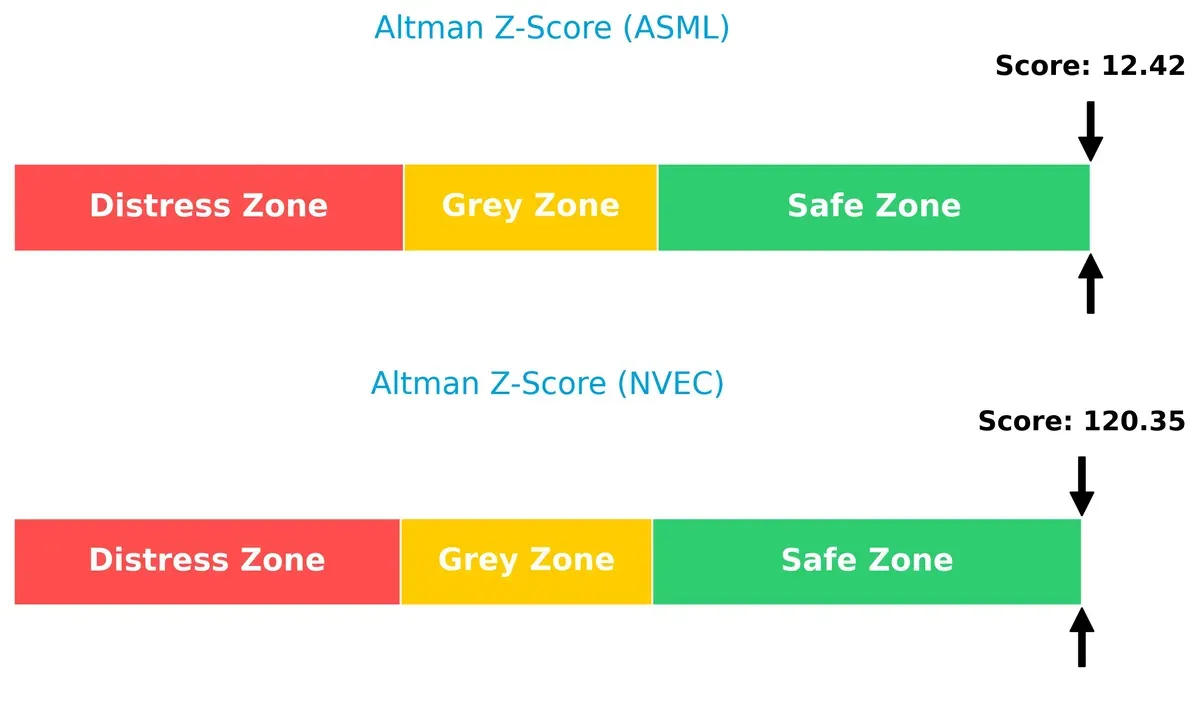
Both companies demonstrate robust solvency well above distress thresholds. However, NVE’s exceptionally high score signals an almost negligible bankruptcy risk, underscoring superior financial resilience amidst market cycles. ASML remains solvent but with a wider margin for caution.
Financial Health: Quality of Operations
ASML scores an 8 on the Piotroski F-Score, indicating very strong financial health, while NVE scores a moderate 5:
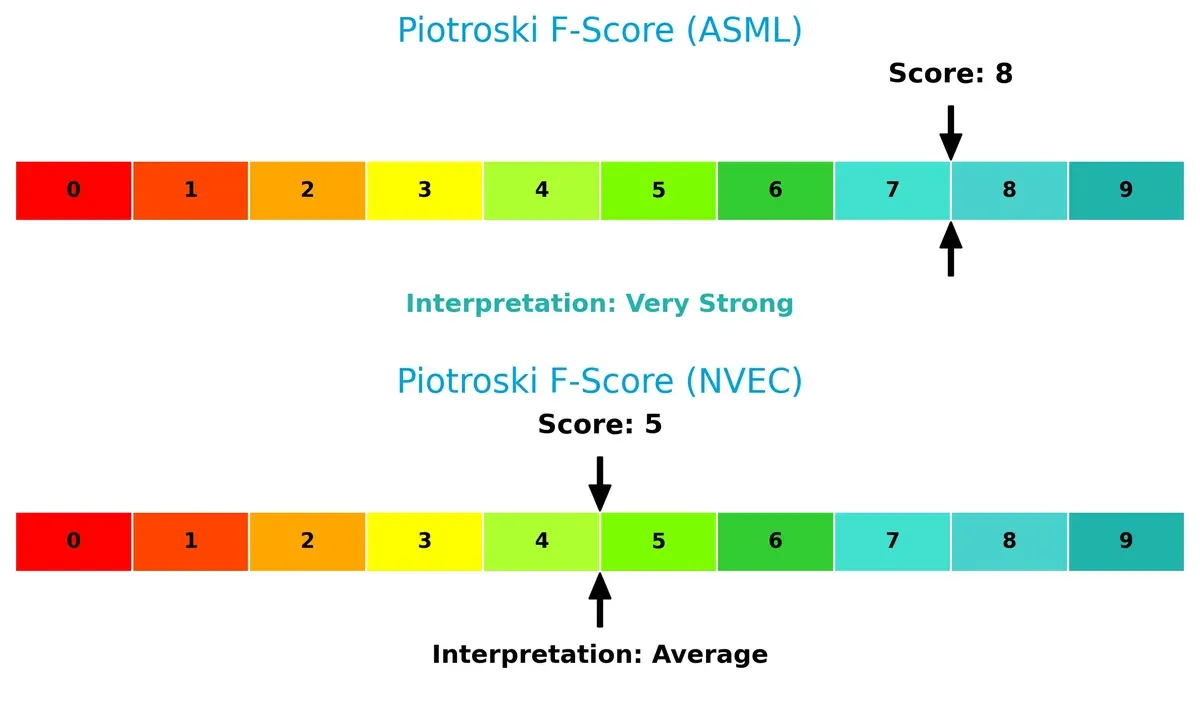
ASML exhibits peak operational quality and internal financial strength, minimizing red flags. NVE’s average score suggests some internal metrics need improvement to match ASML’s rigor. This disparity may affect long-term value stability under economic stress.
How are the two companies positioned?
This section dissects ASML and NVEC’s operational DNA by comparing their revenue distribution and internal dynamics—strengths and weaknesses. The goal is to confront their economic moats to reveal which model offers the most resilient competitive advantage today.
Revenue Segmentation: The Strategic Mix
This visual comparison dissects how ASML Holding N.V. and NVE Corporation diversify their income streams and where their primary sector bets lie:
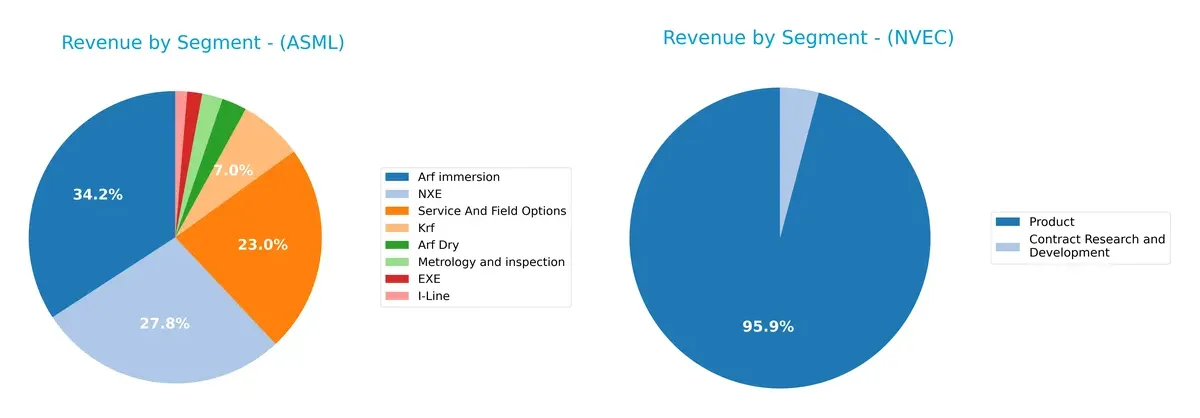
ASML’s revenue spans multiple specialized segments, with Arf immersion at 9.67B and NXE at 7.86B anchoring its portfolio. Service and Field Options also contribute a solid 6.49B, signaling ecosystem lock-in. In contrast, NVE relies heavily on its Product segment at roughly 26M, dwarfing its Contract Research and Development at about 1.1M, revealing concentration risk. ASML’s diversified mix supports resilience, while NVE’s focus demands caution.
Strengths and Weaknesses Comparison
This table compares the Strengths and Weaknesses of ASML and NVEC based on diversification, profitability, financials, innovation, global presence, and market share:
ASML Strengths
- Strong global presence with significant revenues from China, Korea, Taiwan, and US
- High ROE (47.08%) and ROIC (34.14%) indicating efficient capital use
- Low debt-to-equity (0.14) and solid interest coverage
- Diverse product segments including advanced EUV and service options
NVEC Strengths
- Exceptional net margin (58.22%) and favorable ROIC (21.14%)
- Very high current and quick ratios showing strong liquidity
- Low debt levels and infinite interest coverage
- High fixed asset turnover (8.91) suggesting operational efficiency
ASML Weaknesses
- Elevated valuation multiples (PE 38.33, PB 18.05) may limit upside
- Quick ratio below 1 (0.79) signals potential short-term liquidity pressure
- WACC higher than ROIC, indicating cost of capital concerns
- Dividend yield relatively low (0.69%)
NVEC Weaknesses
- Extremely high current ratio (28.4) may indicate inefficient asset use
- PB ratio unfavorable (4.95) compared to sector norms
- Asset turnover low (0.4) suggesting less efficient asset utilization
- Geographic revenue less diversified, concentrated in US and Europe
Both companies show robust profitability and strong capital management, but ASML’s valuation and liquidity ratios require caution. NVEC presents excellent margins and liquidity but faces challenges in asset efficiency and geographic diversification. These contrasts highlight distinct strategic focuses and operational trade-offs.
The Moat Duel: Analyzing Competitive Defensibility
A structural moat is the only defense preserving long-term profits against relentless competition and market entry pressures. Let’s dissect the moats of two semiconductor players:
ASML Holding N.V.: Technological Intangible Asset Moat
ASML’s moat stems from its advanced lithography technology, reflected in a robust 34.9% EBIT margin and 24% ROIC premium over WACC. Its dominance in EUV systems underpins high barriers and margin stability. Expansion into new chip nodes and computational lithography deepens this moat in 2026.
NVE Corporation: Niche Innovation and Cost Advantage
NVE’s moat relies on proprietary spintronic nanotech, yielding an exceptional 61.8% EBIT margin and steadily rising ROIC. Unlike ASML’s broad market grip, NVE commands a specialized IoT and medical sensor niche. Growth depends on scaling adoption and pushing spintronics into industrial IoT markets.
Moat Strength Showdown: Intangible Assets vs. Niche Innovation
ASML boasts a wider moat with substantial scale, high ROIC, and global market penetration, while NVE’s moat, though narrower, shows remarkable margin efficiency and growth in a specialized segment. ASML stands better equipped to defend and expand its complex technological lead.
Which stock offers better returns?
The past year shows ASML Holding N.V. surging with strong price gains and buyer dominance, while NVE Corporation faces prolonged declines despite a modest recent rebound.
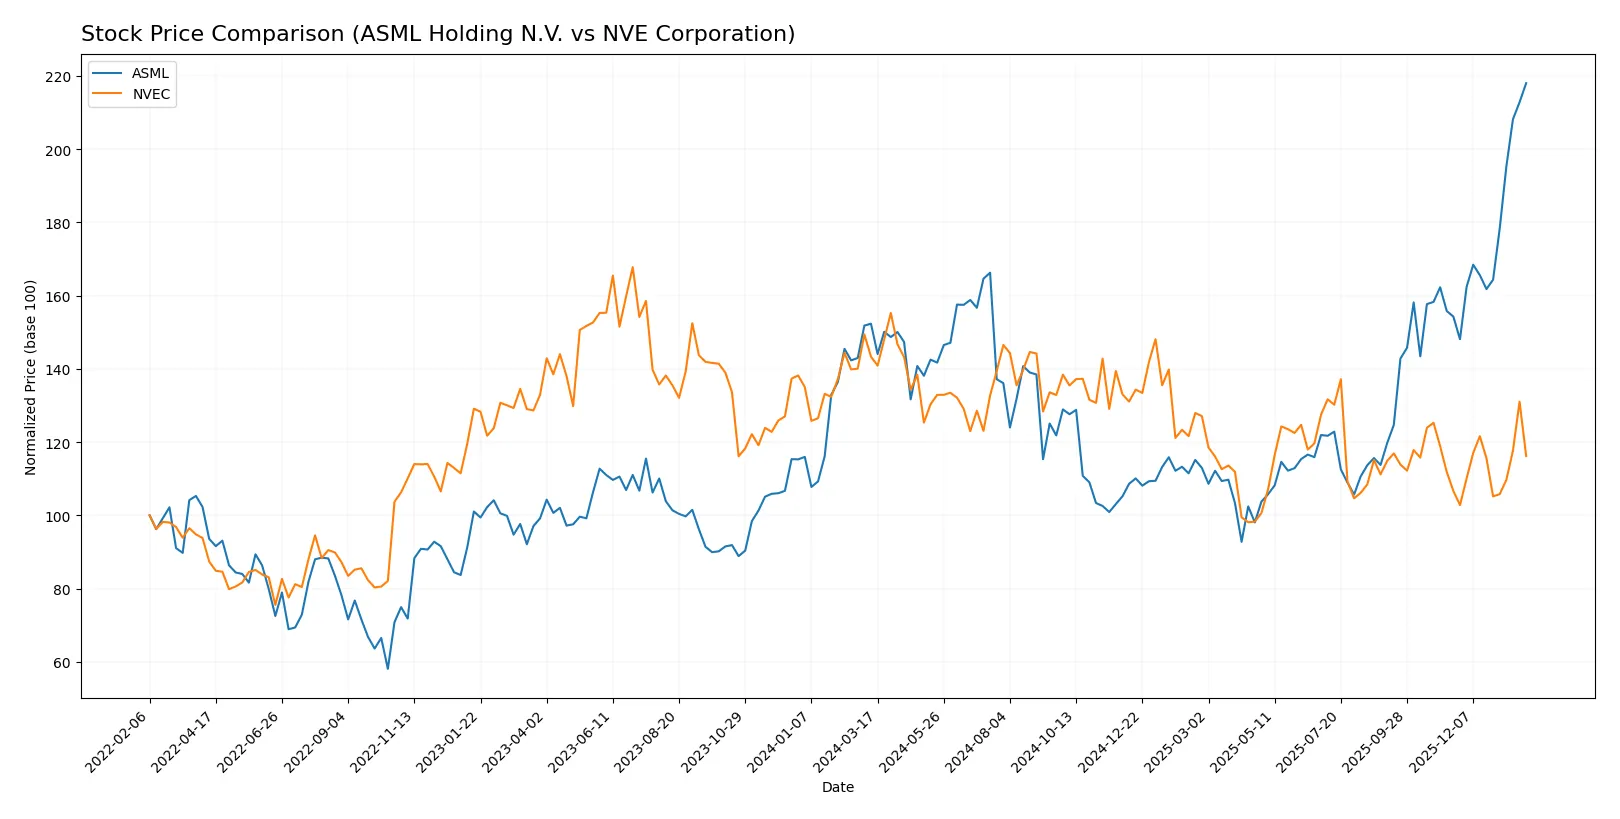
Trend Comparison
ASML Holding N.V. posted a 43.11% price increase over the past 12 months, marking a bullish trend with accelerating momentum and a wide price range from 605.55 to 1423.0.
NVE Corporation declined 18.93% over the same period, reflecting a bearish trend with accelerating downside, though it showed a recent 8.94% partial recovery since November 2025.
ASML clearly outperformed NVEC in market returns, maintaining strong buyer dominance and steady acceleration, while NVEC’s bearish trend limits its near-term upside potential.
Target Prices
Analysts present a broad target range for ASML Holding N.V., reflecting varied expectations in the semiconductor sector.
| Company | Target Low | Target High | Consensus |
|---|---|---|---|
| ASML Holding N.V. | 1150 | 1911 | 1458.5 |
The consensus target of 1458.5 slightly exceeds ASML’s current price of 1423, suggesting modest upside potential amid sector cyclicality. No verified target price data is available for NVE Corporation.

Don’t Let Luck Decide Your Entry Point
Optimize your entry points with our advanced ProRealTime indicators. You’ll get efficient buy signals with precise price targets for maximum performance. Start outperforming now!
How do institutions grade them?
ASML Holding N.V. Grades
The following table shows recent grades from reliable financial institutions for ASML Holding N.V.:
| Grading Company | Action | New Grade | Date |
|---|---|---|---|
| Barclays | Upgrade | Overweight | 2026-01-29 |
| Wells Fargo | Maintain | Overweight | 2026-01-29 |
| RBC Capital | Maintain | Outperform | 2026-01-29 |
| Bernstein | Maintain | Outperform | 2026-01-22 |
| KGI Securities | Upgrade | Outperform | 2026-01-15 |
| Wells Fargo | Maintain | Overweight | 2026-01-15 |
| JP Morgan | Maintain | Overweight | 2026-01-14 |
| Bernstein | Upgrade | Outperform | 2026-01-05 |
| B of A Securities | Maintain | Buy | 2025-12-03 |
| JP Morgan | Maintain | Overweight | 2025-12-01 |
Which company has the best grades?
ASML Holding N.V. has multiple current upgrades and strong ratings, while NVE Corporation has no available grades. This disparity signals higher institutional confidence in ASML, potentially attracting more investor interest.
Risks specific to each company
The following categories identify the critical pressure points and systemic threats facing both firms in the 2026 market environment:
1. Market & Competition
ASML Holding N.V.
- Dominates semiconductor lithography with high barriers to entry but faces intense competition from global chipmakers and tech advances.
NVE Corporation
- Operates in niche spintronics with fewer competitors but limited market size and slower adoption curve.
2. Capital Structure & Debt
ASML Holding N.V.
- Maintains low debt-to-equity (0.14) and strong interest coverage, reflecting conservative leverage and financial stability.
NVE Corporation
- Extremely low debt ratio (0.01) and excellent interest coverage signify a very strong balance sheet with minimal financial risk.
3. Stock Volatility
ASML Holding N.V.
- Beta at 1.34 indicates above-market volatility typical for semiconductor equipment makers in cyclical markets.
NVE Corporation
- Beta at 1.20 shows moderate volatility, reflecting smaller size but steady niche market exposure.
4. Regulatory & Legal
ASML Holding N.V.
- Must navigate complex export controls and IP laws globally, especially amid US-China tech tensions.
NVE Corporation
- Faces standard US regulatory environments with less international legal complexity due to smaller global footprint.
5. Supply Chain & Operations
ASML Holding N.V.
- Complex global supply chain with risks from geopolitical tensions and component shortages in semiconductor industry.
NVE Corporation
- Smaller scale supply chain focused on niche sensor components, less exposed but dependent on specialized suppliers.
6. ESG & Climate Transition
ASML Holding N.V.
- Increasing pressure to reduce environmental footprint amid semiconductor industry’s energy intensity and material use.
NVE Corporation
- Faces emerging ESG demands, but smaller operational scale eases transition risks relative to larger peers.
7. Geopolitical Exposure
ASML Holding N.V.
- High exposure to Asia-Pacific political risks and export restrictions affecting supply and sales.
NVE Corporation
- Primarily US-based, limiting geopolitical risks but still indirectly affected by global trade dynamics.
Which company shows a better risk-adjusted profile?
ASML’s biggest risk lies in geopolitical and supply chain complexity, threatening its advanced tech leadership. NVE’s primary risk is its limited market scale and dependency on niche demand. NVE shows a stronger balance sheet and less volatility, delivering a better risk-adjusted profile. However, ASML’s global dominance and higher profitability justify higher risk tolerance despite external pressures.
Final Verdict: Which stock to choose?
ASML’s superpower lies in its durable competitive moat, driven by an exceptional ROIC well above its cost of capital. It efficiently converts invested capital into growing profits despite a premium valuation. A point of vigilance is its stretched liquidity ratios, which could pressure short-term flexibility. It suits portfolios targeting aggressive growth with a tolerance for valuation risk.
NVE Corporation’s strategic moat centers on its high net margins and ultra-conservative balance sheet, offering robust financial safety. Though growth has slowed recently, its recurring profitability and remarkably strong liquidity make it a steadier choice than ASML. This stock fits well within GARP portfolios seeking a blend of reasonable valuation and dependable cash flow.
If you prioritize capturing long-term innovation and market dominance, ASML outshines with superior capital efficiency and growth momentum. However, if you seek better stability and a defensive posture against volatility, NVE offers a safer profile supported by strong margins and liquidity. Both present viable scenarios depending on your risk tolerance and investment horizon.
Disclaimer: Investment carries a risk of loss of initial capital. The past performance is not a reliable indicator of future results. Be sure to understand risks before making an investment decision.
Go Further
I encourage you to read the complete analyses of ASML Holding N.V. and NVE Corporation to enhance your investment decisions: