Home > Comparison > Technology > ASML vs NVMI
The strategic rivalry between ASML Holding N.V. and Nova Ltd. shapes the semiconductor equipment landscape. ASML operates as a capital-intensive leader in advanced lithography systems, while Nova focuses on high-precision semiconductor process control solutions. This contrast highlights a battle between scale-driven innovation and niche technological expertise. This analysis will assess which company’s trajectory offers superior risk-adjusted returns for a diversified portfolio in the evolving technology sector.
Table of contents
Companies Overview
ASML Holding N.V. and Nova Ltd. stand as pivotal players shaping semiconductor manufacturing technology worldwide.
ASML Holding N.V.: The Lithography Powerhouse
ASML dominates the semiconductor equipment sector with its advanced lithography systems, crucial for chip production. Its core revenue stems from selling extreme ultraviolet and deep ultraviolet lithography solutions. In 2026, ASML focuses strategically on refining computational lithography and expanding customer support services to maintain its competitive edge.
Nova Ltd.: Precision in Process Control
Nova Ltd. specializes in process control systems critical to semiconductor manufacturing. It drives revenue by supplying metrology platforms that measure dimensions, films, and chemical properties across multiple production stages. The company’s 2026 strategy emphasizes innovation in measurement technologies to serve logic, memory, and foundry sectors globally.
Strategic Collision: Similarities & Divergences
Both firms operate in semiconductor manufacturing but pursue distinct philosophies. ASML champions a highly integrated lithography ecosystem, while Nova prioritizes versatile open-process control solutions. Their primary battleground is advanced semiconductor process optimization, targeting chipmakers’ yield and quality. ASML’s scale and technological moat contrast with Nova’s niche precision, defining unique risk and growth profiles.
Income Statement Comparison
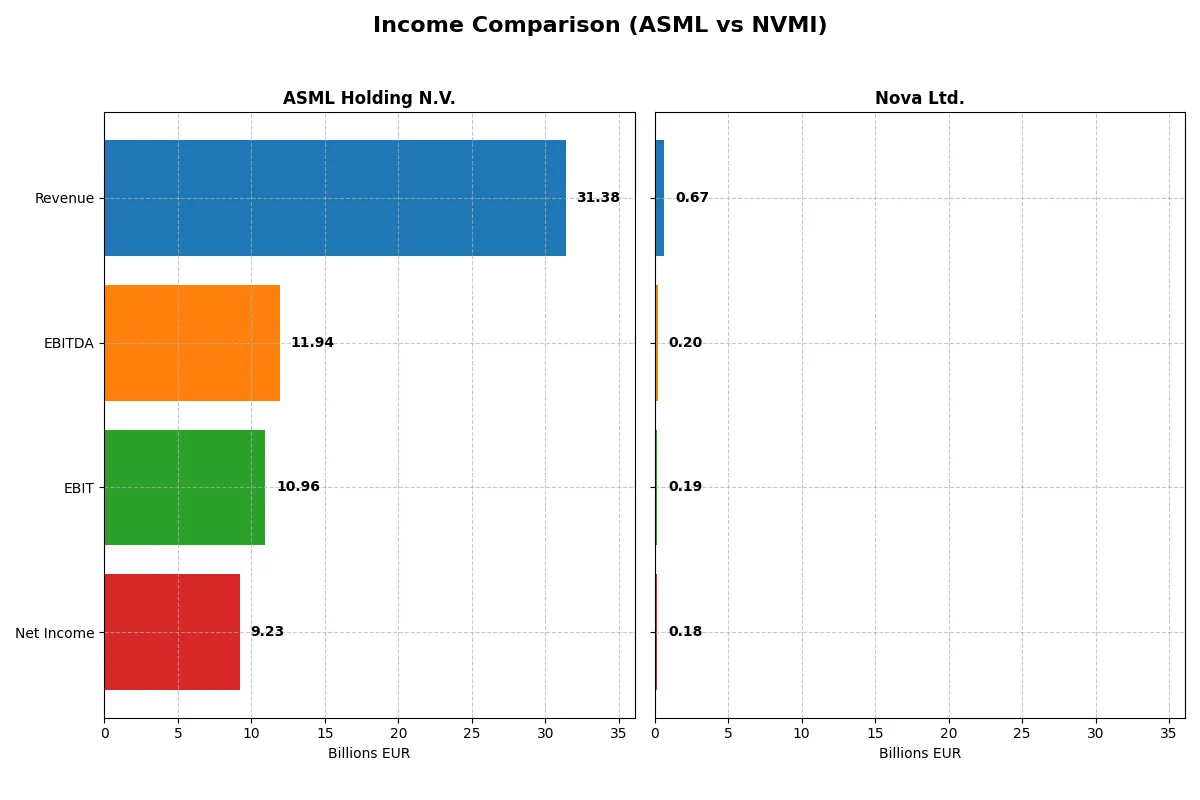
This data dissects the core profitability and scalability of both corporate engines to reveal who dominates the bottom line:
| Metric | ASML Holding N.V. (ASML) | Nova Ltd. (NVMI) |
|---|---|---|
| Revenue | 31.4B EUR | 672M USD |
| Cost of Revenue | 14.8B EUR | 285M USD |
| Operating Expenses | 5.7B EUR | 200M USD |
| Gross Profit | 16.6B EUR | 387M USD |
| EBITDA | 11.9B EUR | 205M USD |
| EBIT | 11.0B EUR | 188M USD |
| Interest Expense | 0 EUR | 1.6M USD |
| Net Income | 9.2B EUR | 184.9M USD |
| EPS | 23.76 EUR | 6.31 USD |
| Fiscal Year | 2025 | 2024 |
Income Statement Analysis: The Bottom-Line Duel
This income statement comparison reveals which company runs a more efficient and profitable corporate engine through revenue growth and margin control.
ASML Holding N.V. Analysis
ASML’s revenue climbed steadily from 18.6B EUR in 2021 to 31.4B EUR in 2025, with net income rising from 5.9B to 9.2B EUR. Its gross margin remains strong near 53%, and net margin holds a favorable 29%. The 2025 year shows solid momentum with revenue up 11% and EBIT rising 19%, reflecting operational efficiency.
Nova Ltd. Analysis
Nova’s revenue surged from 269M USD in 2020 to 672M USD in 2024, with net income more than tripling to 184M USD. Gross margin stands higher at 58%, while net margin approaches 27%. The latest year delivered nearly 30% revenue growth and 20% EBIT growth, signaling rapid expansion with improving profitability.
Margin Strength vs. Growth Velocity
ASML commands superior scale and margin stability, delivering consistent double-digit revenue and profit growth over five years. Nova impresses with faster revenue and net income acceleration, albeit from a smaller base and slightly lower net margin. ASML’s profile suits investors valuing established operational efficiency, while Nova appeals to those chasing high-growth momentum.
Financial Ratios Comparison
These vital ratios act as a diagnostic tool to expose the underlying fiscal health, valuation premiums, and capital efficiency of the companies compared below:
| Ratios | ASML Holding N.V. (ASML) | Nova Ltd. (NVMI) |
|---|---|---|
| ROE | 47.1% | 19.8% |
| ROIC | 34.1% | 13.4% |
| P/E | 38.3x | 31.2x |
| P/B | 18.0x | 6.2x |
| Current Ratio | 1.26 | 2.32 |
| Quick Ratio | 0.79 | 1.92 |
| D/E (Debt-to-Equity) | 0.14 | 0.25 |
| Debt-to-Assets | 5.4% | 17.0% |
| Interest Coverage | N/A | 116.2x |
| Asset Turnover | 0.62 | 0.48 |
| Fixed Asset Turnover | 3.81 | 5.06 |
| Payout Ratio | 26.5% | 0% |
| Dividend Yield | 0.69% | 0% |
| Fiscal Year | 2025 | 2024 |
Efficiency & Valuation Duel: The Vital Signs
Ratios serve as a company’s DNA, uncovering hidden risks and revealing operational excellence critical for investment decisions.
ASML Holding N.V.
ASML displays robust profitability with a 47.1% ROE and a strong 29.4% net margin, signaling operational efficiency. However, its valuation appears stretched, with a high 38.3 P/E and 18.1 P/B ratios. The company returns modest dividends (0.69% yield), balancing shareholder rewards with significant R&D investment fueling growth.
Nova Ltd.
Nova reports favorable profitability, with a 19.8% ROE and a 27.3% net margin, indicating solid efficiency. Its valuation is less inflated but still elevated, reflected in a 31.2 P/E and 6.18 P/B ratio. Lacking dividends, Nova prioritizes reinvestment in R&D and growth, supported by strong liquidity and lower leverage ratios.
Premium Valuation vs. Operational Safety
ASML commands a premium valuation justified by superior profitability but carries modest liquidity risks and stretched multiples. Nova offers a more conservative valuation with stronger liquidity and solid profitability. Investors seeking growth with operational safety may prefer Nova’s profile, while those favoring high returns at higher risk might lean toward ASML.
Which one offers the Superior Shareholder Reward?
I observe ASML Holding N.V. balances dividends and buybacks, yielding ~0.97% with a 34% payout ratio, well-covered by free cash flow (FCF/Dividend ratio ~3). ASML’s buybacks add value, reflecting strong capital allocation. Nova Ltd. pays no dividends but retains 93%+ FCF for growth and acquisitions, supporting a robust reinvestment model. Nova’s lack of buybacks shifts total return reliance to capital gains, risking short-term income. Historically, ASML’s hybrid model offers steady income plus capital growth, more sustainable in volatile cycles. I conclude ASML provides a superior total shareholder return for 2026 investors seeking income and growth balance.
Comparative Score Analysis: The Strategic Profile
The radar chart reveals the fundamental DNA and trade-offs of ASML Holding N.V. and Nova Ltd., highlighting their core financial strengths and vulnerabilities:
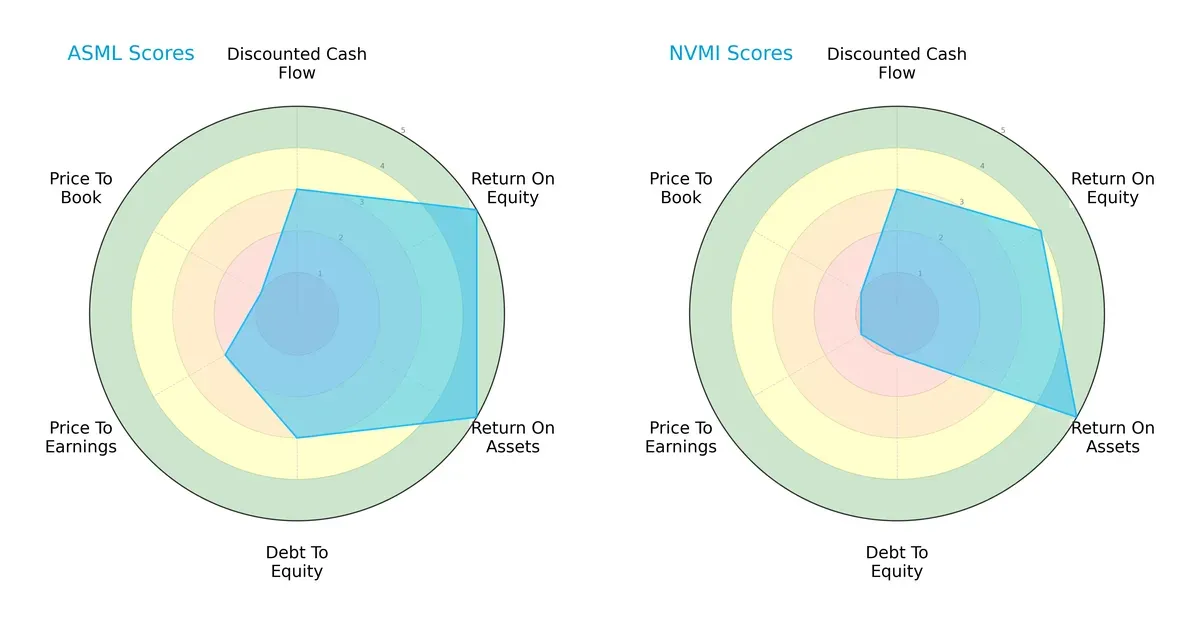
ASML shows superior returns with a ROE and ROA score of 5 each, demonstrating efficient capital and asset use. Nova Ltd. keeps pace on ROA but lags slightly on ROE with a score of 4. Debt-to-Equity favors ASML (3) over Nova’s weak 1, signaling ASML’s more balanced financial leverage. Both share moderate DCF scores (3), but ASML’s valuation scores indicate more risk, notably a very unfavorable Price-to-Book score (1). ASML maintains a balanced operational profile, while Nova leans heavily on asset efficiency but struggles with leverage and valuation.
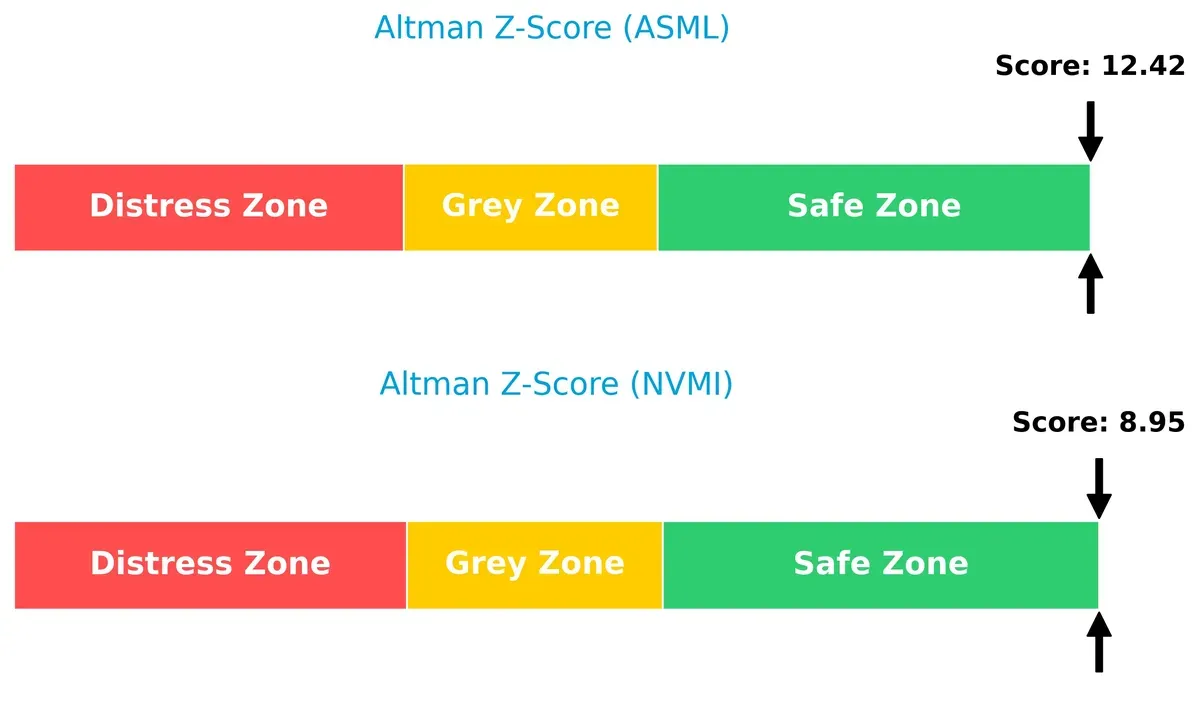
Bankruptcy Risk: Solvency Showdown
ASML’s Altman Z-Score of 12.4 significantly surpasses Nova’s 8.95, both safely above distress thresholds, confirming robust solvency but a clear edge for ASML’s long-term financial resilience:
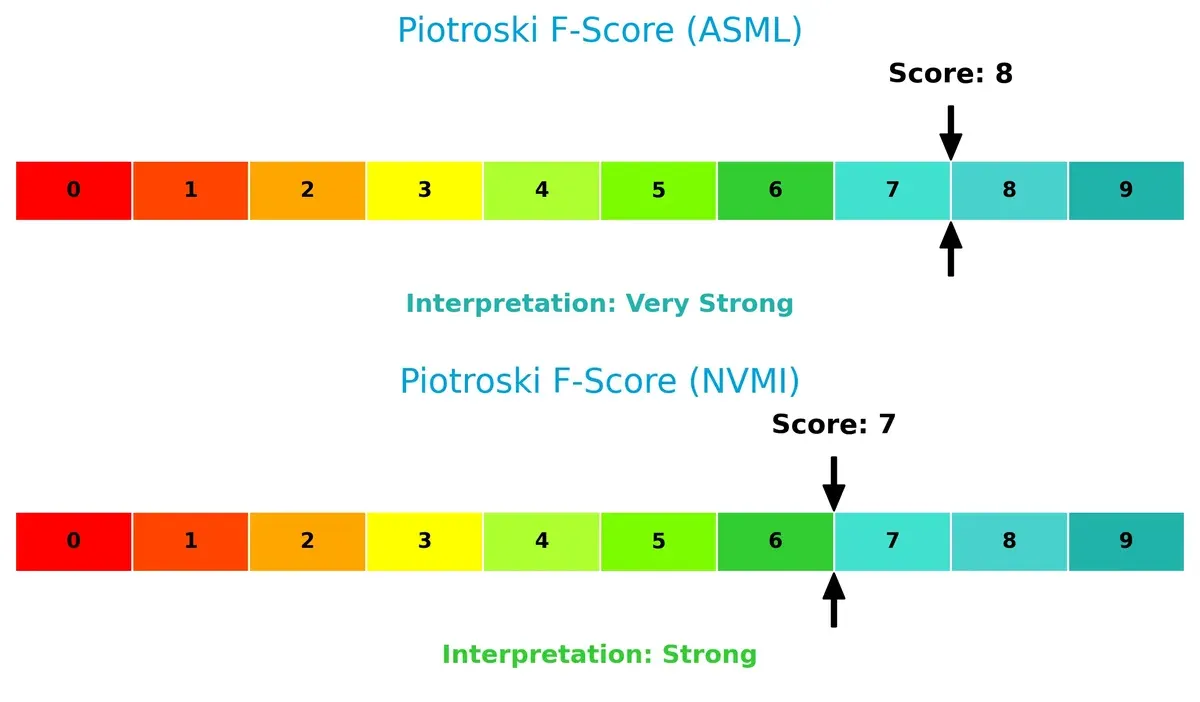
Financial Health: Quality of Operations
ASML’s Piotroski F-Score of 8 outperforms Nova’s 7, marking both firms as financially strong but with ASML demonstrating closer proximity to peak operational health and fewer red flags:
How are the two companies positioned?
This section dissects the operational DNA of ASML and NVMI by comparing their revenue distribution and internal dynamics. The goal is to confront their economic moats to identify which model offers the most resilient competitive advantage today.
Revenue Segmentation: The Strategic Mix
This visual comparison dissects how ASML Holding N.V. and Nova Ltd. diversify their income streams and reveals where their primary sector bets lie:
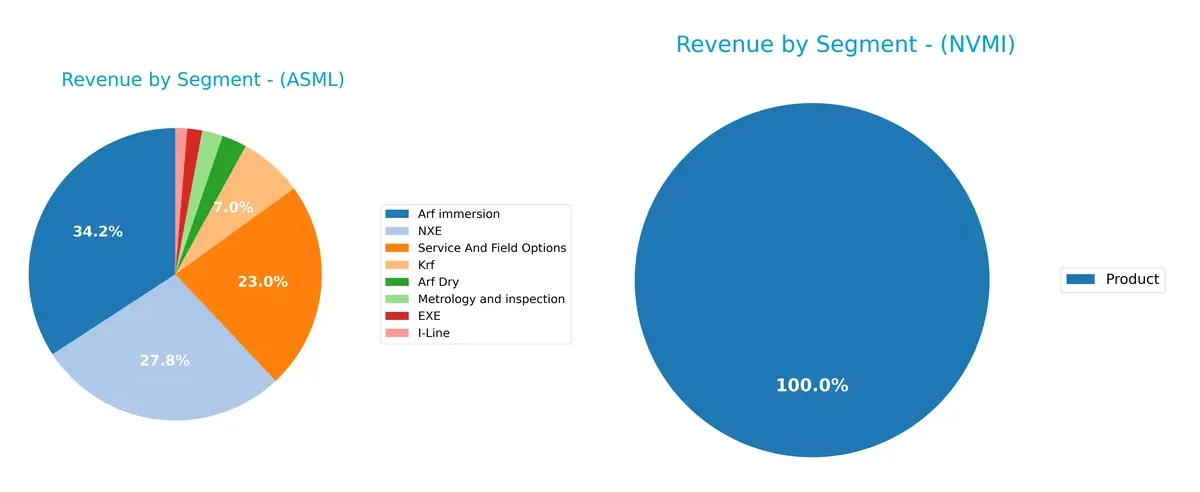
ASML boasts a richly diversified revenue base, anchored by multiple segments like Arf immersion at 9.67B, NXE at 7.86B, and Service And Field Options at 6.49B. In contrast, Nova Ltd. relies solely on a single product line generating 538M. ASML’s multi-segment approach reduces concentration risk and signals strong ecosystem lock-in. Nova’s reliance on one segment heightens vulnerability, limiting strategic flexibility.
Strengths and Weaknesses Comparison
This table compares the strengths and weaknesses of ASML Holding N.V. and Nova Ltd.:
ASML Strengths
- High net margin at 29.42%
- Strong ROE at 47.08%
- Favorable ROIC of 34.14%
- Low debt-to-assets at 5.36%
- Significant global presence with large revenues in China and Korea
- Diverse product segments including EUV and metrology
NVMI Strengths
- Solid net margin at 27.33%
- Favorable ROE at 19.81%
- Good current and quick ratios above 1.9
- Favorable debt-to-assets at 16.98%
- High interest coverage ratio of 116.2
- Efficient fixed asset turnover at 5.06
ASML Weaknesses
- Unfavorable high WACC at 10.08%
- Elevated P/E at 38.33 and P/B at 18.05
- Quick ratio below 1 at 0.79
- Dividend yield low at 0.69%
- Moderate asset turnover at 0.62
- Exposure to geopolitical risks from heavy sales in China
NVMI Weaknesses
- Unfavorable WACC at 12.29%
- P/E at 31.2 and P/B at 6.18 seen as expensive
- Asset turnover weak at 0.48
- No dividend yield reported
- Lower ROIC at 13.39%
- Limited geographic diversification with no reported regional revenues
ASML demonstrates commanding profitability and a broad global footprint, though it faces valuation and liquidity pressures. NVMI shows sound financial health and operational efficiency but lacks geographic diversification and dividend income, which could constrain growth options. Both companies exhibit risks related to valuation and cost of capital that warrant close monitoring in their strategic execution.
The Moat Duel: Analyzing Competitive Defensibility
A structural moat alone safeguards long-term profits from relentless competitive erosion. Let’s dissect the nature of moats for these two semiconductor leaders:
ASML Holding N.V.: Technological Dominance via Intangible Assets
ASML’s moat stems from proprietary lithography technology and patents. This drives a strong ROIC well above WACC, reflecting sustained value creation and margin stability. In 2026, advances in EUV systems deepen this advantage, but competition in emerging markets poses a watchpoint.
Nova Ltd.: Growing Competitive Edge through Process Control Innovation
Nova’s moat relies on specialized metrology and process control platforms. Unlike ASML, its ROIC barely surpasses WACC, indicating a nascent moat. However, rapid ROIC growth signals improving profitability. Expansion into advanced packaging and logic sectors offers upside potential but with execution risk.
Moat Strength Showdown: Intangible Assets vs. Emerging Innovation
ASML commands a wider, more durable moat with a 24% ROIC premium over WACC, showing entrenched market leadership. Nova’s faster ROIC growth is promising but its moat remains shallow. ASML is better positioned to defend market share amid intensifying industry competition.
Which stock offers better returns?
The past year shows strong bullish trends for both stocks, with ASML accelerating sharply and NVMI delivering even higher growth amid dominant buyer activity.
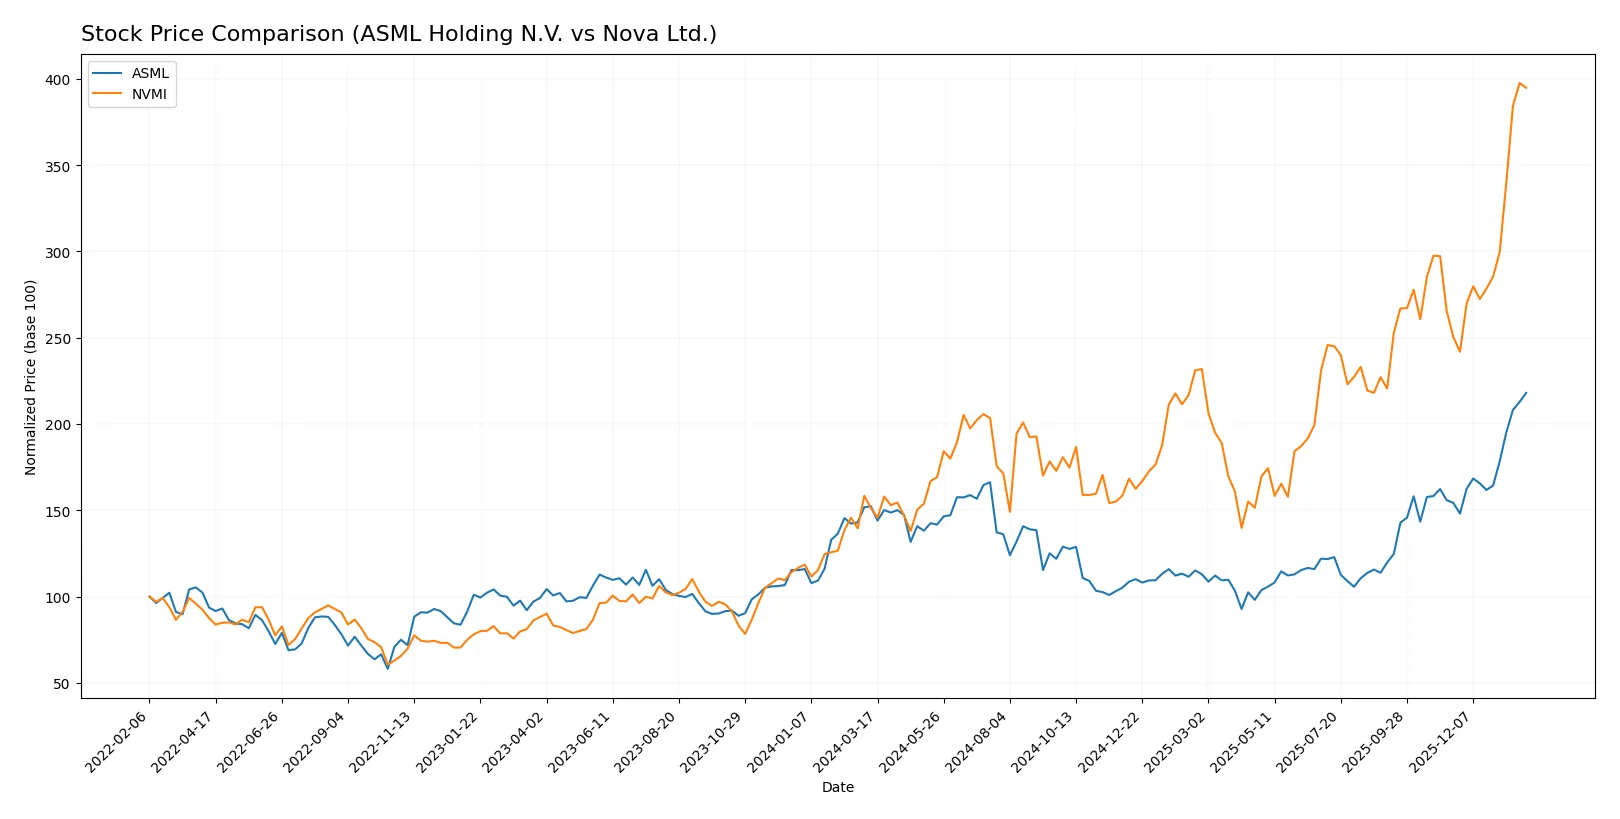
Trend Comparison
ASML Holding N.V. gained 43.11% over the past year, showing accelerating bullish momentum. Prices ranged from 606 to 1,423, with significant volatility (std dev 170.09).
Nova Ltd. surged 161.13% in the same period, also accelerating. Its price fluctuated between 160 and 461, with lower volatility (std dev 63.77) than ASML.
NVMI clearly outperformed ASML, delivering the highest market returns and a robust upward trend over the last 12 months.
Target Prices
Analysts maintain a cautiously optimistic consensus for ASML Holding N.V. and Nova Ltd. in the semiconductor space.
| Company | Target Low | Target High | Consensus |
|---|---|---|---|
| ASML Holding N.V. | 1,150 | 1,911 | 1,458.5 |
| Nova Ltd. | 335 | 500 | 408.33 |
The consensus target for ASML sits slightly above its current price of 1,423, indicating moderate upside potential. Nova’s target consensus of 408.33 is below its current price of 457.84, reflecting a more cautious outlook from analysts.

Don’t Let Luck Decide Your Entry Point
Optimize your entry points with our advanced ProRealTime indicators. You’ll get efficient buy signals with precise price targets for maximum performance. Start outperforming now!
How do institutions grade them?
The following tables summarize recent institutional grades for ASML Holding N.V. and Nova Ltd.:
ASML Holding N.V. Grades
This table shows the latest grade actions from major financial institutions on ASML Holding N.V.:
| Grading Company | Action | New Grade | Date |
|---|---|---|---|
| Barclays | Upgrade | Overweight | 2026-01-29 |
| Wells Fargo | Maintain | Overweight | 2026-01-29 |
| RBC Capital | Maintain | Outperform | 2026-01-29 |
| Bernstein | Maintain | Outperform | 2026-01-22 |
| KGI Securities | Upgrade | Outperform | 2026-01-15 |
| Wells Fargo | Maintain | Overweight | 2026-01-15 |
| JP Morgan | Maintain | Overweight | 2026-01-14 |
| Bernstein | Upgrade | Outperform | 2026-01-05 |
| B of A Securities | Maintain | Buy | 2025-12-03 |
| JP Morgan | Maintain | Overweight | 2025-12-01 |
Nova Ltd. Grades
This table presents recent grade updates from reputable firms on Nova Ltd.:
| Grading Company | Action | New Grade | Date |
|---|---|---|---|
| Needham | Upgrade | Buy | 2026-01-20 |
| B of A Securities | Maintain | Buy | 2026-01-13 |
| Jefferies | Maintain | Buy | 2025-12-15 |
| Evercore ISI Group | Maintain | Outperform | 2025-11-07 |
| Benchmark | Maintain | Buy | 2025-11-07 |
| Cantor Fitzgerald | Maintain | Overweight | 2025-06-24 |
| B of A Securities | Maintain | Buy | 2025-06-24 |
| Citigroup | Maintain | Buy | 2025-05-09 |
| Benchmark | Maintain | Buy | 2025-05-09 |
| B of A Securities | Maintain | Buy | 2025-04-16 |
Which company has the best grades?
ASML Holding N.V. holds a stronger consensus with multiple Outperform ratings and recent upgrades to Overweight. Nova Ltd. mostly earns Buy ratings with fewer Outperform grades. Investors may see ASML as having higher institutional conviction, which could influence confidence in its growth prospects.
Risks specific to each company
The following categories identify critical pressure points and systemic threats facing ASML Holding N.V. and Nova Ltd. in the 2026 market environment:
1. Market & Competition
ASML Holding N.V.
- Dominates advanced lithography niche with strong moat but faces intense global semiconductor competition.
Nova Ltd.
- Competes in semiconductor metrology with niche focus but higher vulnerability to market shifts and rivals.
2. Capital Structure & Debt
ASML Holding N.V.
- Low debt-to-equity (0.14) and minimal leverage reduce financial risk, supporting stability.
Nova Ltd.
- Higher debt ratio (0.25) increases financial risk, reflected in a weaker debt-to-equity score.
3. Stock Volatility
ASML Holding N.V.
- Beta of 1.34 indicates moderate volatility aligned with tech sector norms.
Nova Ltd.
- Beta of 1.83 signals higher stock volatility, increasing risk during market downturns.
4. Regulatory & Legal
ASML Holding N.V.
- Faces complex export controls given global footprint, especially in China and US tech tensions.
Nova Ltd.
- Exposed to regulatory shifts in Israel and US markets, with potential geopolitical legal risks.
5. Supply Chain & Operations
ASML Holding N.V.
- Operates global, sophisticated supply chain; resilient but sensitive to semiconductor shortages.
Nova Ltd.
- Smaller scale supply chain; more exposed to disruptions and limited bargaining power.
6. ESG & Climate Transition
ASML Holding N.V.
- Increasing ESG focus driven by EU regulations; good governance but energy-intensive production.
Nova Ltd.
- Emerging ESG initiatives; faces pressure to improve sustainability amid industry standards.
7. Geopolitical Exposure
ASML Holding N.V.
- Significant exposure to Asia-Pacific tensions impacting operations and sales, especially China.
Nova Ltd.
- Geopolitical risks heightened by Israel location and US-China semiconductor trade conflicts.
Which company shows a better risk-adjusted profile?
ASML’s dominant market position and low leverage create a more stable risk profile. Nova’s higher volatility and debt levels raise caution. ASML’s Altman Z-score of 12.4 confirms financial safety versus Nova’s 8.9, though both remain in the safe zone. Nova’s higher beta and debt-to-equity ratio present notable risk. The key risk for ASML is geopolitical exposure in Asia, while Nova’s is financial leverage. ASML’s superior operating scale and capital structure justify a better risk-adjusted stance despite sector headwinds.
Final Verdict: Which stock to choose?
ASML’s superpower lies in its durable competitive advantage and exceptional capital efficiency. Its ability to generate returns well above its cost of capital signals a strong moat and consistent value creation. A point of vigilance is its high valuation multiples, which may temper near-term upside. It suits an aggressive growth portfolio that can tolerate premium pricing for leadership in semiconductor lithography.
Nova Ltd. (NVMI) leverages a strategic moat through rapid revenue and earnings growth backed by a solid recurring revenue base. Its financial safety profile, marked by strong liquidity ratios, offers better downside protection than ASML. This stock fits well in a GARP (Growth at a Reasonable Price) portfolio seeking robust growth with a margin of safety.
If you prioritize industry-leading profitability and a proven moat, ASML is the compelling choice due to its superior capital returns and market dominance. However, if you seek accelerating top-line growth combined with stronger liquidity and lower relative risk, NVMI offers better stability and growth potential at a more accessible valuation. Both present compelling but distinct investment scenarios depending on your risk tolerance and growth expectations.
Disclaimer: Investment carries a risk of loss of initial capital. The past performance is not a reliable indicator of future results. Be sure to understand risks before making an investment decision.
Go Further
I encourage you to read the complete analyses of ASML Holding N.V. and Nova Ltd. to enhance your investment decisions: