Home > Comparison > Technology > ASML vs MPWR
The strategic rivalry between ASML Holding N.V. and Monolithic Power Systems, Inc. shapes the semiconductor industry’s evolution. ASML dominates as a capital-intensive semiconductor equipment leader, while Monolithic Power Systems excels as a high-margin power electronics innovator. This head-to-head contrasts scale and specialization in semiconductor technologies. This analysis aims to identify which company’s trajectory offers superior risk-adjusted returns for a diversified portfolio amid ongoing sector disruption.
Table of contents
Companies Overview
ASML Holding N.V. and Monolithic Power Systems, Inc. stand as key innovators shaping semiconductor technology and power electronics markets globally.
ASML Holding N.V.: Semiconductor Equipment Pioneer
ASML dominates the advanced semiconductor equipment sector. It generates revenue by selling lithography and metrology systems critical for chip manufacturing. In 2026, ASML focuses on expanding its extreme ultraviolet lithography technology, maintaining its competitive edge in enabling smaller, more powerful semiconductors.
Monolithic Power Systems, Inc.: Power Electronics Specialist
Monolithic Power Systems leads in semiconductor-based power electronics. Its core revenue comes from DC to DC integrated circuits powering computing, automotive, and industrial applications. The company prioritizes innovation in energy-efficient power conversion and lighting control, targeting diverse end markets worldwide in 2026.
Strategic Collision: Similarities & Divergences
Both companies operate within semiconductors but address distinct value chains—ASML targets chip fabrication, while MPWR focuses on power management. Their competition centers on technological leadership and market penetration in highly specialized niches. ASML’s capital-intensive, high-moat model contrasts with MPWR’s scalable, diversified product approach, offering investors different risk and growth profiles.
Income Statement Comparison
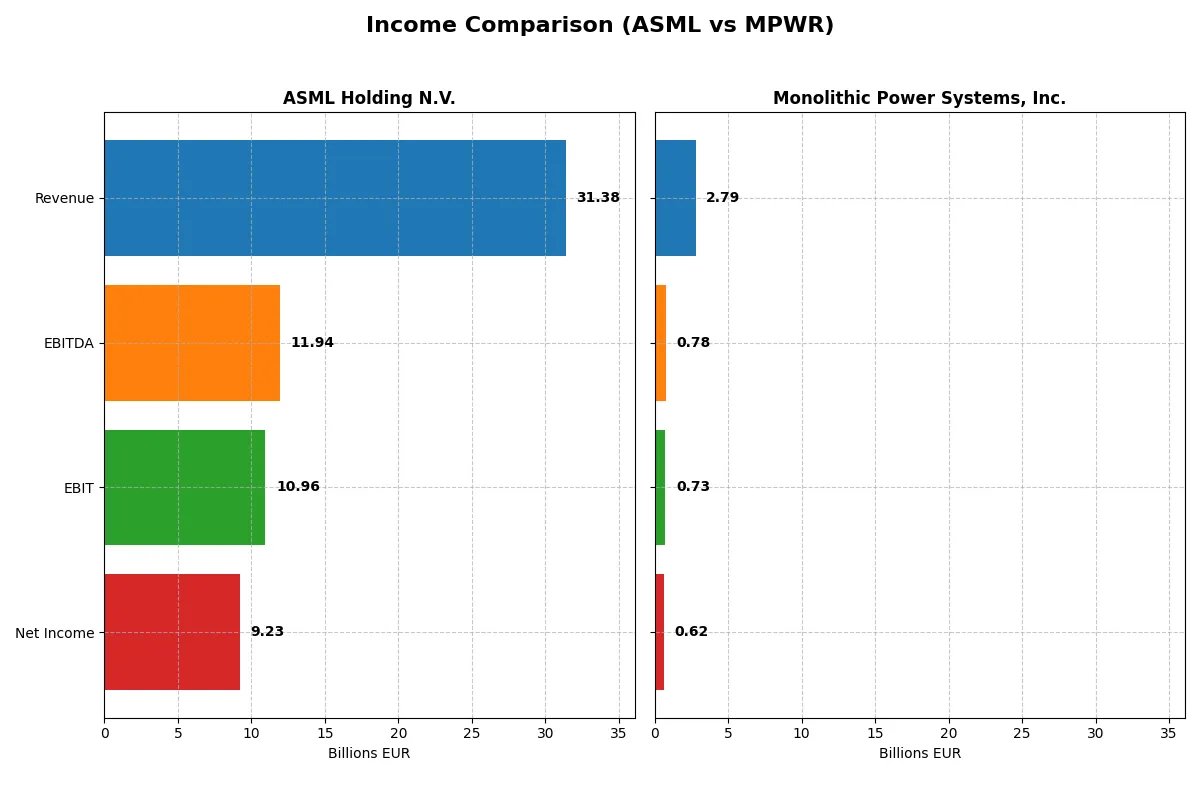
This data dissects the core profitability and scalability of both corporate engines to reveal who dominates the bottom line:
| Metric | ASML Holding N.V. (ASML) | Monolithic Power Systems, Inc. (MPWR) |
|---|---|---|
| Revenue | 31.4B EUR | 2.79B USD |
| Cost of Revenue | 14.8B EUR | 1.25B USD |
| Operating Expenses | 5.72B EUR | 811M USD |
| Gross Profit | 16.6B EUR | 1.54B USD |
| EBITDA | 11.9B EUR | 780M USD |
| EBIT | 11.0B EUR | 729M USD |
| Interest Expense | 0 | 0 |
| Net Income | 9.23B EUR | 616M USD |
| EPS | 23.76 EUR | 12.82 USD |
| Fiscal Year | 2025 | 2025 |
Income Statement Analysis: The Bottom-Line Duel
This income statement comparison reveals which company runs its operations with greater efficiency and sustained profitability.
ASML Holding N.V. Analysis
ASML’s revenue climbed steadily from 18.6B EUR in 2021 to 31.4B EUR in 2025, with net income rising from 5.9B to 9.2B EUR. Its gross margin holds strong above 52%, and net margin nears 29.4%, indicating robust profitability. The 2025 figures show accelerating EBIT growth (+19%) and expanding EPS (+23%), signaling solid operational momentum.
Monolithic Power Systems, Inc. Analysis
MPWR’s revenue more than doubled from 1.2B USD in 2021 to 2.8B USD in 2025, with net income growing from 242M to 616M USD. Gross margin surpasses 55%, but net margin lags at 22%. Despite impressive 1-year revenue (+26%) and EBIT (+35%) growth, net margin and EPS declined sharply last year, reflecting margin pressure despite top-line strength.
Margin Strength vs. Growth Trajectory
ASML leads in absolute scale and margin efficiency, delivering consistent profitability and high returns on capital. MPWR shines with rapid revenue growth and expanding gross margins but suffers from volatile net margins and EPS declines recently. For investors prioritizing stable earnings and margin power, ASML’s profile appears more attractive, while MPWR suits those chasing high growth with higher risk.
Financial Ratios Comparison
These vital ratios act as a diagnostic tool to expose the underlying fiscal health, valuation premiums, and capital efficiency of the companies compared below:
| Ratios | ASML Holding N.V. (ASML) | Monolithic Power Systems, Inc. (MPWR) |
|---|---|---|
| ROE | 47.1% | 16.6% |
| ROIC | 34.1% | 14.9% |
| P/E | 38.3 | 70.7 |
| P/B | 18.0 | 11.7 |
| Current Ratio | 1.26 | 5.91 |
| Quick Ratio | 0.79 | 4.38 |
| D/E | 0.14 | 0.00 |
| Debt-to-Assets | 5.4% | 0.0% |
| Interest Coverage | N/A | N/A |
| Asset Turnover | 0.62 | 0.65 |
| Fixed Asset Turnover | 3.81 | 4.45 |
| Payout ratio | 26.5% | 46.2% |
| Dividend yield | 0.69% | 0.65% |
| Fiscal Year | 2025 | 2025 |
Efficiency & Valuation Duel: The Vital Signs
Ratios act as a company’s DNA, revealing hidden risks and operational excellence beyond surface-level financials.
ASML Holding N.V.
ASML delivers a powerful 47.1% ROE and a robust 29.4% net margin, signaling strong profitability. Yet, its P/E of 38.3 and P/B of 18.1 mark the stock as stretched. The company returns value modestly through dividends (0.69% yield) while heavily investing in R&D to sustain growth and innovation.
Monolithic Power Systems, Inc.
MPWR posts a lower 16.6% ROE and 22.1% net margin but maintains solid profitability. Its valuation appears expensive, with a P/E of 70.7 and P/B of 11.7. The firm does not prioritize dividends, instead reinvesting aggressively in R&D to fuel future expansion. Its high current ratio (5.91) signals ample liquidity.
Premium Valuation vs. Operational Safety
ASML balances superior profitability with stretched valuation, reflecting premium pricing for operational excellence. MPWR offers a favorable liquidity profile and growth focus but demands a higher valuation multiple. Investors seeking stability may prefer ASML’s robust returns; growth-oriented profiles might lean toward MPWR’s reinvestment strategy.
Which one offers the Superior Shareholder Reward?
I compare ASML Holding N.V. and Monolithic Power Systems, Inc. on their shareholder reward approaches. ASML yields about 0.97%, with a moderate payout ratio near 34%, supported by strong free cash flow coverage above 80%. It also executes sizeable buybacks, enhancing total returns sustainably. MPWR offers a 0.65% yield, with a lower payout ratio around 13% in 2024 but limited free cash flow data and less visible buyback activity. MPWR’s strategy likely prioritizes reinvestment for growth, but ASML’s balanced dividend and buyback mix presents a more reliable total return in 2026. I conclude ASML offers the superior shareholder reward due to its proven cash flow-backed distributions and consistent buybacks.
Comparative Score Analysis: The Strategic Profile
The radar chart reveals the fundamental DNA and trade-offs of ASML Holding N.V. and Monolithic Power Systems, Inc.:
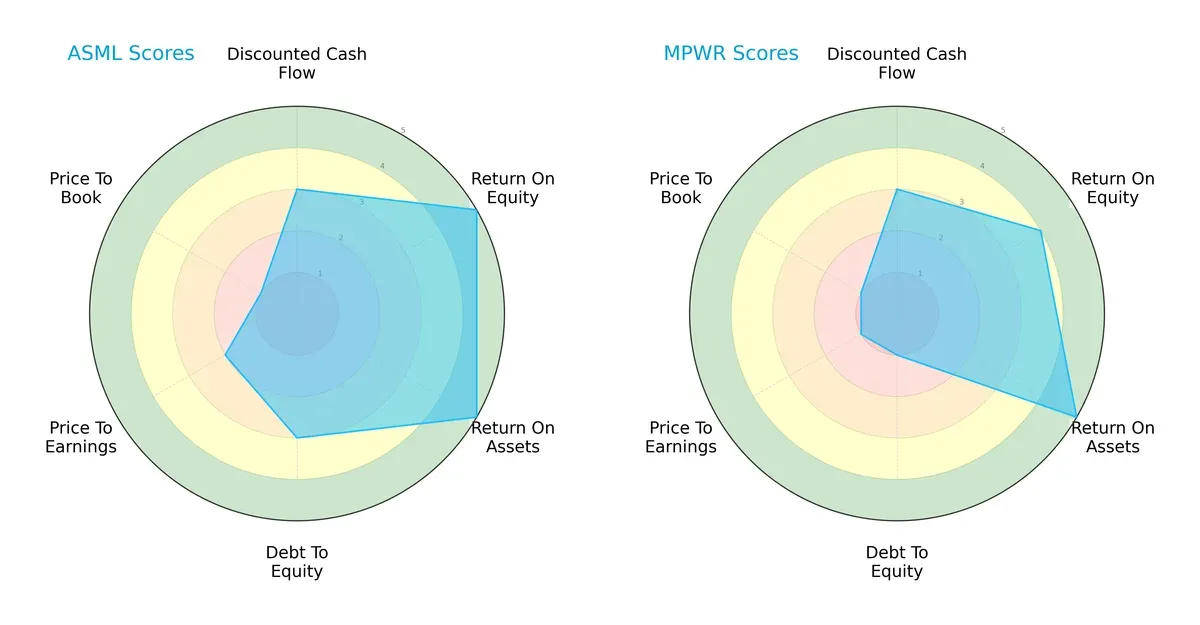
ASML shows superior profitability metrics with top ROE (5) and ROA (5) scores, reflecting efficient capital and asset use. MPWR matches ASML’s asset efficiency but lags slightly on ROE (4). ASML maintains moderate leverage (Debt/Equity 3) versus MPWR’s weak balance sheet (1). Both firms share moderate DCF scores (3), but ASML’s valuation scores (P/E 2, P/B 1) indicate higher market skepticism compared to MPWR’s very unfavorable valuation scores (all 1). ASML offers a more balanced profile, leveraging operational excellence amid valuation concerns. MPWR relies heavily on asset efficiency but faces financial risk and valuation headwinds.
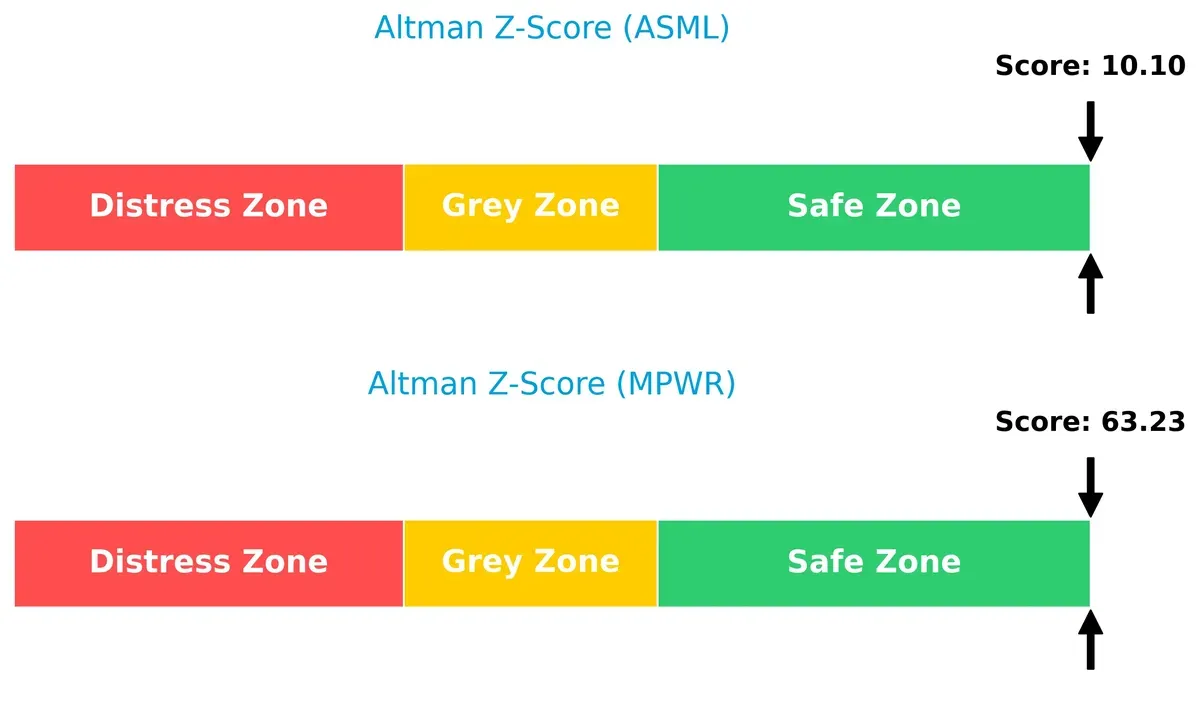
Bankruptcy Risk: Solvency Showdown
ASML’s Altman Z-Score of 10.1 versus MPWR’s 63.2 places both comfortably in the safe zone, underscoring very strong long-term solvency in the current cycle:
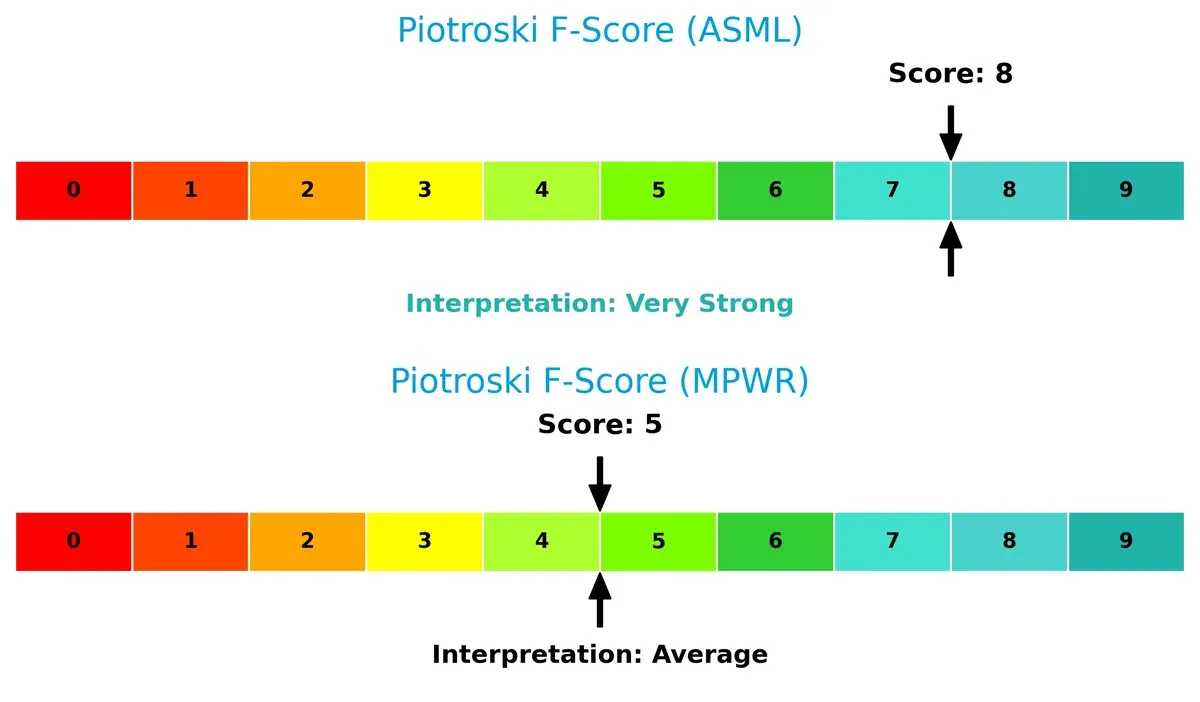
Financial Health: Quality of Operations
ASML’s Piotroski F-Score of 8 signals very strong financial health, outperforming MPWR’s average score of 5. This suggests ASML’s internal operations and fundamentals are more robust, while MPWR shows some red flags in internal financial metrics:
How are the two companies positioned?
This section dissects ASML and MPWR’s operational DNA by comparing their revenue distribution and internal dynamics. The goal is to confront their economic moats to reveal which model offers the most resilient, sustainable advantage today.
Revenue Segmentation: The Strategic Mix
This visual comparison dissects how ASML Holding N.V. and Monolithic Power Systems, Inc. diversify their income streams and where their primary sector bets lie:
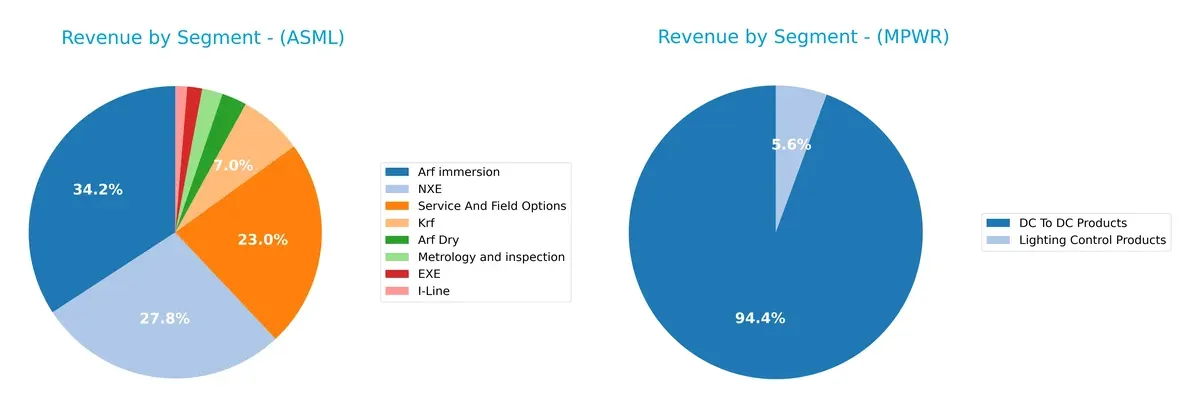
ASML anchors revenue heavily in Arf immersion at $9.67B and NXE at $7.86B, complemented by $6.49B in Service and Field Options, showing a mix of advanced lithography and support services. In contrast, Monolithic Power Systems relies predominantly on DC To DC Products at $1.72B, with minimal diversification from Lighting Control Products at $102M. ASML’s broader portfolio reduces concentration risk and leverages ecosystem lock-in, while MPWR’s focus suggests vulnerability to shifts in power management demand.
Strengths and Weaknesses Comparison
This table compares the strengths and weaknesses of ASML Holding N.V. and Monolithic Power Systems, Inc.:
ASML Strengths
- High net margin of 29.42%
- ROE of 47.08%
- ROIC well above WACC at 34.14%
- Low debt-to-equity of 0.14
- Strong global presence with significant revenues from China and Korea
- Diversified product segments including EUV and service options
MPWR Strengths
- Favorable net margin of 22.07%
- ROE and ROIC positive at 16.55% and 14.93%
- Zero debt and infinite interest coverage
- Strong quick ratio of 4.38 indicating liquidity
- Global sales across China, Taiwan, Korea, and Europe
- Growing revenue in DC to DC products segment
ASML Weaknesses
- High valuation multiples with P/E of 38.33 and P/B of 18.05
- WACC at 10.62% slightly unfavorable
- Quick ratio below 1 at 0.79 signals potential liquidity risk
- Dividend yield low at 0.69%
- Moderate asset turnover of 0.62 limits efficiency
MPWR Weaknesses
- Very high P/E of 70.69 and P/B of 11.7 imply stretched valuation
- Unfavorable current ratio of 5.91 may indicate inefficient asset use
- Dividend yield low at 0.65%
- Relatively lower ROE compared to ASML
- Less diversified product portfolio focused on two main product lines
ASML demonstrates robust profitability and global diversification but faces valuation and liquidity challenges. MPWR shows strong liquidity and low leverage but has valuation and efficiency concerns. Both must balance growth ambitions with financial prudence to sustain their competitive edges.
The Moat Duel: Analyzing Competitive Defensibility
A structural moat is the only reliable barrier protecting long-term profits from relentless competitive erosion in dynamic markets:
ASML Holding N.V.: Dominant Technology & Intangible Asset Moat
ASML’s moat stems from proprietary lithography technology and deep intangible assets, driving a very favorable 23.5% ROIC above WACC. Its margin stability and growing profitability signal strong capital efficiency. Expansion into extreme ultraviolet lithography in 2026 should deepen this lead.
Monolithic Power Systems, Inc.: Niche Cost and Integration Advantage
MPWR leverages cost-efficient power IC designs and integration expertise, yielding a positive but modest 4.3% ROIC premium over WACC. Unlike ASML, its profitability trends down, signaling margin pressure. Future growth depends on penetrating automotive and industrial markets amid rising competition.
Verdict: Proprietary Technology vs. Cost Efficiency in Semiconductors
ASML’s wider and deeper moat, anchored in high ROIC growth and unique technology, outmatches MPWR’s narrowing cost advantage. ASML is better equipped to defend market share against intensifying global competition.
Which stock offers better returns?
Over the past year, ASML Holding N.V. and Monolithic Power Systems, Inc. both posted strong price gains, with distinct acceleration patterns and sustained buyer dominance influencing trading dynamics.
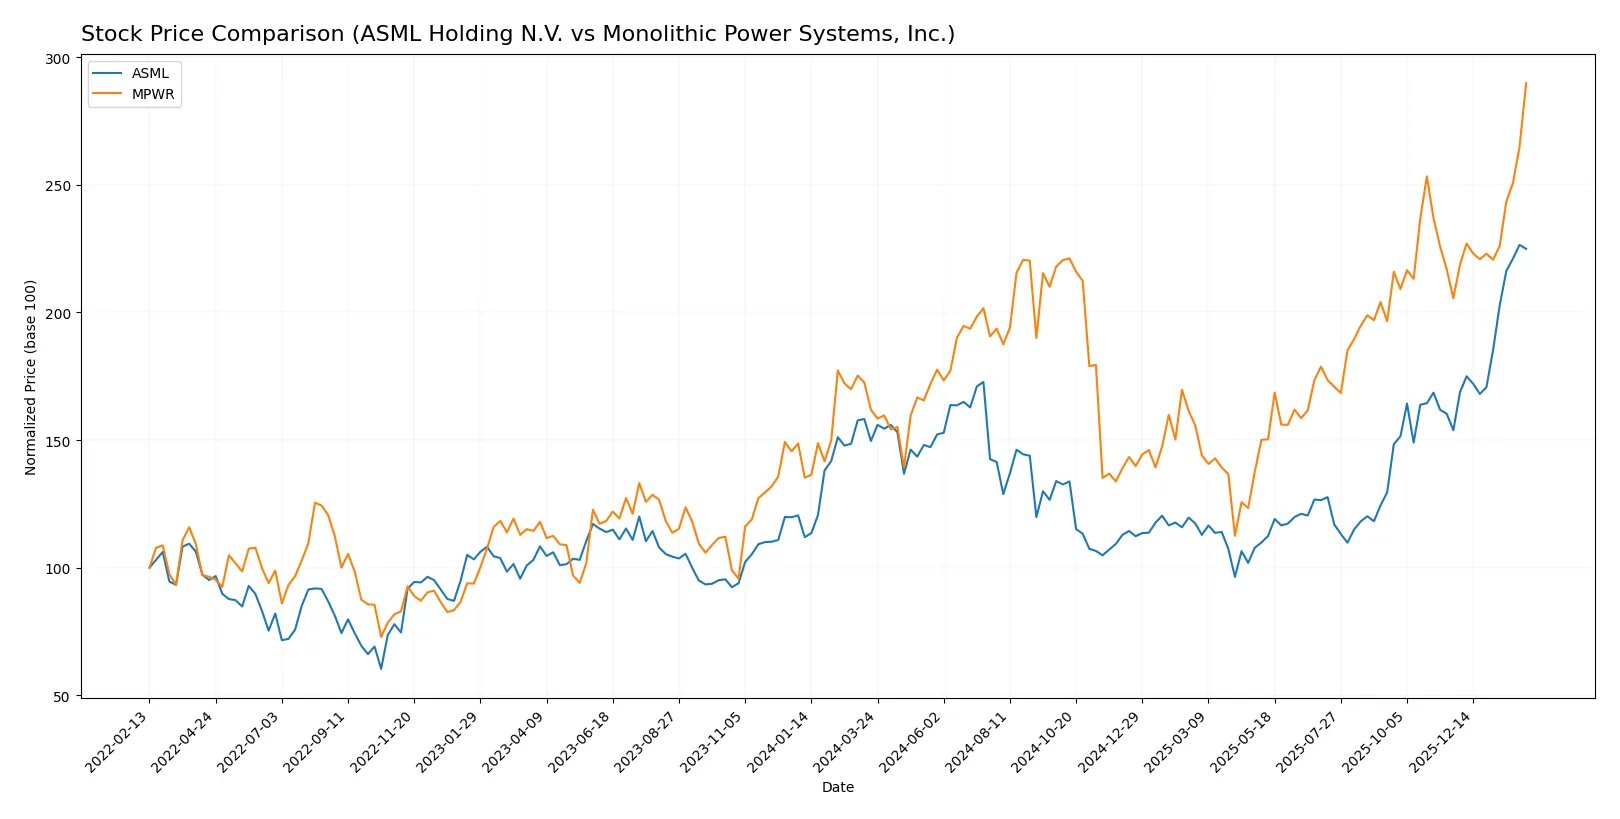
Trend Comparison
ASML Holding N.V.’s stock rose 50.29% over the last 12 months, showing a bullish trend with accelerating momentum and a high volatility level indicated by a 178.25 standard deviation.
Monolithic Power Systems, Inc. gained 79.02% over the same period, also bullish with acceleration, but slightly lower volatility at 150.74 standard deviation, reflecting strong upward movement.
MPWR outperformed ASML with a 79.02% gain versus 50.29%. Both show bullish acceleration, but MPWR delivered the highest market returns over the past year.
Target Prices
Analysts present a moderately bullish consensus for ASML Holding N.V. and Monolithic Power Systems, Inc.
| Company | Target Low | Target High | Consensus |
|---|---|---|---|
| ASML Holding N.V. | 1,150 | 1,911 | 1,458.5 |
| Monolithic Power Systems, Inc. | 1,200 | 1,500 | 1,313.71 |
The consensus targets for ASML and MPWR sit above their current prices, indicating analyst expectations of price appreciation. ASML’s target consensus exceeds its $1,413 price by 3%, while MPWR’s target shows roughly 7% upside from $1,230.

Don’t Let Luck Decide Your Entry Point
Optimize your entry points with our advanced ProRealTime indicators. You’ll get efficient buy signals with precise price targets for maximum performance. Start outperforming now!
How do institutions grade them?
ASML Holding N.V. Grades
The following table summarizes ASML Holding N.V.’s recent institutional grades and actions:
| Grading Company | Action | New Grade | Date |
|---|---|---|---|
| Barclays | Upgrade | Overweight | 2026-01-29 |
| Wells Fargo | Maintain | Overweight | 2026-01-29 |
| RBC Capital | Maintain | Outperform | 2026-01-29 |
| Bernstein | Maintain | Outperform | 2026-01-22 |
| Wells Fargo | Maintain | Overweight | 2026-01-15 |
| KGI Securities | Upgrade | Outperform | 2026-01-15 |
| JP Morgan | Maintain | Overweight | 2026-01-14 |
| Bernstein | Upgrade | Outperform | 2026-01-05 |
| B of A Securities | Maintain | Buy | 2025-12-03 |
| JP Morgan | Maintain | Overweight | 2025-12-01 |
Monolithic Power Systems, Inc. Grades
The following table summarizes Monolithic Power Systems, Inc.’s recent institutional grades and actions:
| Grading Company | Action | New Grade | Date |
|---|---|---|---|
| Truist Securities | Maintain | Buy | 2026-02-06 |
| Keybanc | Maintain | Overweight | 2026-02-06 |
| Rosenblatt | Maintain | Neutral | 2026-02-06 |
| Needham | Maintain | Buy | 2026-02-06 |
| Wells Fargo | Maintain | Overweight | 2026-02-06 |
| Stifel | Maintain | Buy | 2026-02-04 |
| Wells Fargo | Maintain | Overweight | 2026-01-26 |
| Wells Fargo | Upgrade | Overweight | 2026-01-15 |
| Truist Securities | Maintain | Buy | 2025-12-19 |
| Citigroup | Maintain | Buy | 2025-11-03 |
Which company has the best grades?
ASML Holding N.V. consistently receives higher-tier grades such as Outperform and Overweight, with multiple upgrades. Monolithic Power Systems, Inc. holds mostly Buy and Overweight ratings with fewer upgrades. Investors might view ASML’s stronger consensus grades as a sign of higher confidence from institutions.
Risks specific to each company
The following categories identify critical pressure points and systemic threats facing ASML Holding N.V. and Monolithic Power Systems, Inc. in the 2026 market environment:
1. Market & Competition
ASML Holding N.V.
- Dominates advanced lithography with strong moat but faces intense competition in semiconductor equipment.
Monolithic Power Systems, Inc.
- Niche in power ICs with diverse end markets but competes against larger semiconductor players.
2. Capital Structure & Debt
ASML Holding N.V.
- Low debt-to-equity (0.14), manageable leverage supports financial stability.
Monolithic Power Systems, Inc.
- Zero debt, excellent balance sheet but may underutilize leverage for growth.
3. Stock Volatility
ASML Holding N.V.
- Beta 1.46 indicates high sensitivity to market swings typical in tech sector.
Monolithic Power Systems, Inc.
- Beta 1.46 also shows high volatility, amplified by smaller market cap.
4. Regulatory & Legal
ASML Holding N.V.
- Exposure to export restrictions on EUV tech could hamper growth.
Monolithic Power Systems, Inc.
- Faces regulatory scrutiny in automotive and industrial standards globally.
5. Supply Chain & Operations
ASML Holding N.V.
- Complex global supply chain with exposure to geopolitical risks in Asia.
Monolithic Power Systems, Inc.
- Relies on third-party distributors, vulnerable to supply disruptions.
6. ESG & Climate Transition
ASML Holding N.V.
- Faces pressure on energy-intensive manufacturing processes to reduce carbon footprint.
Monolithic Power Systems, Inc.
- Opportunity to lead in energy-efficient power solutions but ESG reporting still evolving.
7. Geopolitical Exposure
ASML Holding N.V.
- High exposure to Asia-Pacific tensions affecting semiconductor supply chains.
Monolithic Power Systems, Inc.
- US-based with global sales; geopolitical tensions impact cross-border sales and sourcing.
Which company shows a better risk-adjusted profile?
ASML’s most impactful risk is geopolitical exposure, especially export controls limiting EUV technology sales to China. Monolithic Power Systems’ key risk lies in regulatory complexity and supply chain vulnerability amid global market shifts. Despite higher volatility, ASML’s robust moat and conservative leverage yield a better risk-adjusted profile. Notably, ASML’s strong Altman Z-score and Piotroski score reinforce its financial resilience amid external pressures.
Final Verdict: Which stock to choose?
ASML’s superpower lies in its commanding economic moat, delivering top-tier returns on invested capital well above its cost of capital. It excels as a value creator with disciplined capital allocation and robust profitability. A point of vigilance remains its premium valuation multiples, suggesting cautious timing. It fits well in portfolios seeking steady growth with strong competitive advantages.
Monolithic Power Systems boasts a strategic moat through its nimble innovation in power solutions and solid recurring revenue streams. Its balance sheet strength and liquidity profile offer a cushion against volatility, making it relatively safer than ASML. This stock aligns with investors focused on growth at a reasonable price and who prefer exposure to emerging tech niches.
If you prioritize sustainable value creation and a proven moat, ASML outshines with superior returns and market leadership. However, if you seek a growth-driven name with stronger liquidity and a less stretched valuation, Monolithic Power Systems offers better stability with promising innovation. Each scenario demands a clear understanding of your risk tolerance and investment horizon.
Disclaimer: Investment carries a risk of loss of initial capital. The past performance is not a reliable indicator of future results. Be sure to understand risks before making an investment decision.
Go Further
I encourage you to read the complete analyses of ASML Holding N.V. and Monolithic Power Systems, Inc. to enhance your investment decisions: