Home > Comparison > Technology > ASML vs MCHP
The strategic rivalry between ASML Holding N.V. and Microchip Technology Incorporated shapes the semiconductor sector’s future. ASML commands the capital-intensive lithography equipment niche, while Microchip excels as a diversified embedded control solutions provider. This contrast highlights a battle between specialized innovation and broad-market microcontroller dominance. This analysis will identify which company’s trajectory delivers the superior risk-adjusted return for a diversified portfolio in the evolving technology landscape.
Table of contents
Companies Overview
ASML Holding N.V. and Microchip Technology Incorporated hold pivotal roles in the semiconductor industry, shaping chipmaking and embedded control technologies globally.
ASML Holding N.V.: Semiconductor Equipment Pioneer
ASML dominates the semiconductor equipment market with its advanced lithography systems, crucial for manufacturing cutting-edge chips. Its revenue stems from selling and servicing extreme ultraviolet lithography and metrology systems. In 2026, ASML’s strategy centers on refining its computational lithography solutions and expanding system upgrades, reinforcing its technological edge in semiconductor node production.
Microchip Technology Incorporated: Embedded Solutions Leader
Microchip leads in embedded control solutions, generating revenue by providing microcontrollers, microprocessors, and analog products across automotive and industrial sectors. The company focuses on integrated, secure embedded systems and FPGA products in 2026, catering to diverse applications from communications to power management. Its strategic emphasis lies in broadening its product portfolio and enhancing design tools for developers.
Strategic Collision: Similarities & Divergences
Both firms operate within semiconductors but pursue contrasting models: ASML offers high-tech capital equipment, while Microchip delivers integrated embedded solutions. Their primary battleground is technological innovation—ASML shapes chip fabrication, Microchip powers device intelligence. Their investment profiles differ sharply: ASML’s scale and technological moat contrast with Microchip’s diversified product base and embedded systems focus.
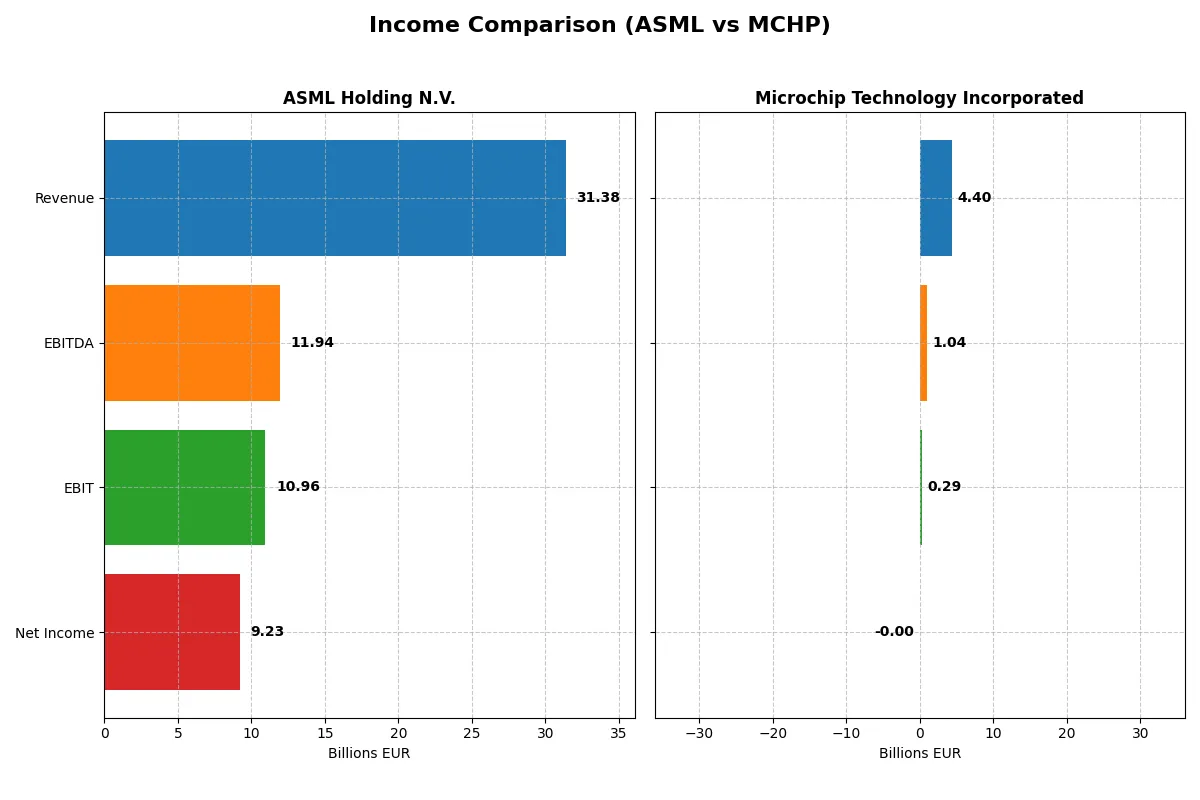
Income Statement Comparison
This data dissects the core profitability and scalability of both corporate engines to reveal who dominates the bottom line:
| Metric | ASML Holding N.V. (ASML) | Microchip Technology Incorporated (MCHP) |
|---|---|---|
| Revenue | 31.4B EUR | 4.40B USD |
| Cost of Revenue | 14.8B EUR | 1.93B USD |
| Operating Expenses | 5.72B EUR | 2.17B USD |
| Gross Profit | 16.6B EUR | 2.47B USD |
| EBITDA | 11.9B EUR | 1.04B USD |
| EBIT | 11.0B EUR | 290M USD |
| Interest Expense | 0 | 251M USD |
| Net Income | 9.23B EUR | -0.5M USD |
| EPS | 23.76 EUR | -0.005 USD |
| Fiscal Year | 2025 | 2025 |
Income Statement Analysis: The Bottom-Line Duel
This income statement comparison exposes the true operational efficiency and profitability strength of two leading semiconductor firms.
ASML Holding N.V. Analysis
ASML’s revenue surged from 18.6B EUR in 2021 to 31.4B EUR in 2025, showing robust growth. Net income followed, rising from 5.9B EUR to 9.2B EUR, reflecting strong earnings momentum. Its gross margin stands at a healthy 52.8%, with a net margin of 29.4%, underscoring solid cost control and premium pricing power in 2025.
Microchip Technology Incorporated Analysis
Microchip posted revenue declines from 5.4B USD in 2021 to 4.4B USD in 2025, with net income turning negative in the latest year at -0.5M USD. Despite a favorable gross margin of 56.1%, net margins collapsed to near zero, reflecting significant margin compression and operational challenges. The 2025 results highlight deteriorating profitability and weakening operational momentum.
Verdict: Strong Growth and Margin Discipline vs. Declining Scale and Profitability
ASML clearly outperforms Microchip in both revenue growth and bottom-line profitability, with superior margins and positive EPS momentum. Microchip’s shrinking revenue and net losses contrast sharply with ASML’s sustained expansion and margin strength. For investors, ASML’s profile offers a more attractive combination of growth and efficiency.
Financial Ratios Comparison
These vital ratios act as a diagnostic tool to expose the underlying fiscal health, valuation premiums, and capital efficiency of the companies compared:
| Ratios | ASML Holding N.V. (ASML) | Microchip Technology Inc. (MCHP) |
|---|---|---|
| ROE | 47.1% | -0.0071% |
| ROIC | 34.1% | -0.03% |
| P/E | 38.3 | -52021 |
| P/B | 18.0 | 3.67 |
| Current Ratio | 1.26 | 2.59 |
| Quick Ratio | 0.79 | 1.47 |
| D/E (Debt-to-Equity) | 0.14 | 0.80 |
| Debt-to-Assets | 5.4% | 36.9% |
| Interest Coverage | N/A | 1.18 |
| Asset Turnover | 0.62 | 0.29 |
| Fixed Asset Turnover | 3.81 | 3.72 |
| Payout Ratio | 26.5% | -1951% |
| Dividend Yield | 0.69% | 3.75% |
| Fiscal Year | 2025 | 2025 |
Efficiency & Valuation Duel: The Vital Signs
Ratios act as a company’s DNA, revealing hidden risks and operational excellence that guide investors through complex financial landscapes.
ASML Holding N.V.
ASML demonstrates strong profitability with a 47.08% ROE and a 29.42% net margin, signaling superior operational efficiency. However, its valuation is stretched, with a P/E of 38.33 and high P/B of 18.05. Shareholder returns include a low 0.69% dividend yield, reflecting a growth-focused reinvestment strategy, especially in R&D.
Microchip Technology Incorporated
Microchip shows weak profitability, with negative ROE and net margin, indicating operational challenges. Its valuation appears undervalued with a negative P/E and a moderate P/B of 3.67. The company offers a healthy 3.75% dividend yield but faces risks from high net debt and weak asset turnover, limiting margin expansion potential.
Premium Valuation vs. Operational Safety
ASML commands a premium valuation justified by robust profitability and growth reinvestment, while Microchip struggles with profitability but pays a solid dividend. Investors seeking growth and operational excellence may prefer ASML; those prioritizing yield and current income might lean toward Microchip despite its risks.
Which one offers the Superior Shareholder Reward?
I observe ASML Holding N.V. pays a consistent dividend with a yield near 0.97% and a sustainable payout ratio around 27-34%. Its free cash flow comfortably covers dividends and buybacks, supporting steady shareholder returns. Microchip Technology offers a higher dividend yield near 3.75% but reports negative net income in 2025, raising sustainability concerns. Microchip’s payout ratio swings wildly, signaling risk. Both execute buybacks, but ASML’s disciplined capital allocation amid strong margins and cash flow positions it as the superior total return choice for 2026 investors.
Comparative Score Analysis: The Strategic Profile
The radar chart reveals the fundamental DNA and trade-offs of ASML Holding N.V. and Microchip Technology Incorporated:
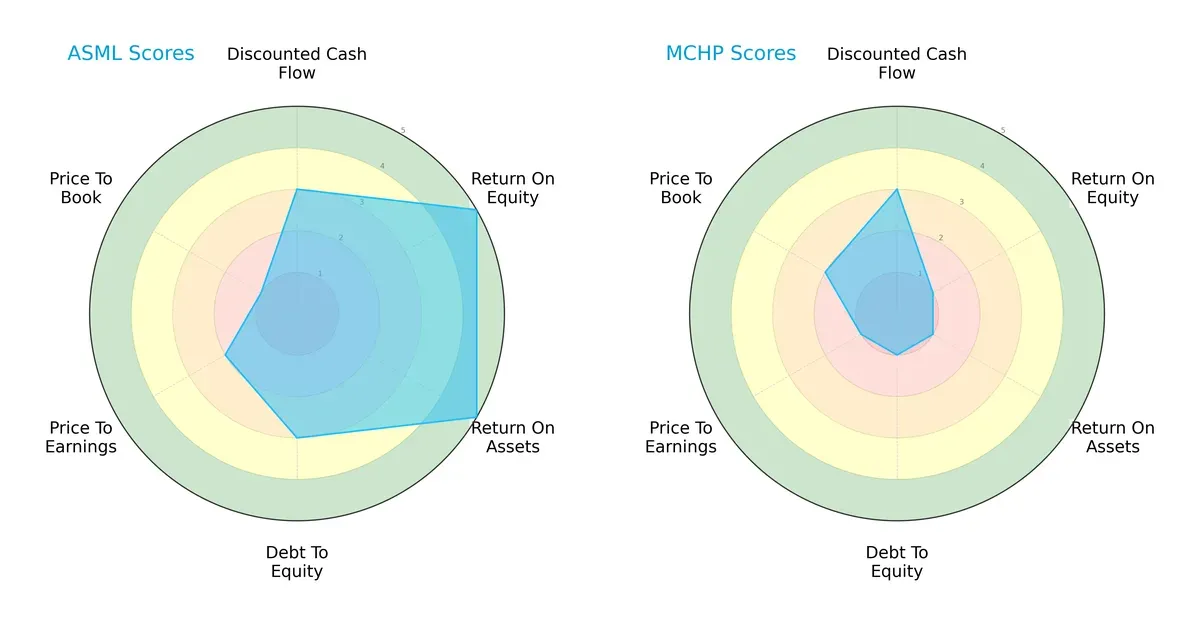
ASML exhibits a more balanced profile with very favorable ROE and ROA scores of 5, reflecting superior profitability and asset efficiency. Its moderate DCF and debt-to-equity scores of 3 indicate reasonable valuation and manageable leverage. In contrast, Microchip relies heavily on a moderate DCF score of 3 but suffers very unfavorable scores in ROE, ROA, debt-to-equity, and valuation metrics, signaling weaker operational efficiency and higher financial risk.
—
Bankruptcy Risk: Solvency Showdown
ASML’s Altman Z-Score of 12.42 versus Microchip’s 4.05 signals a stark difference in long-term survival prospects in this cycle:
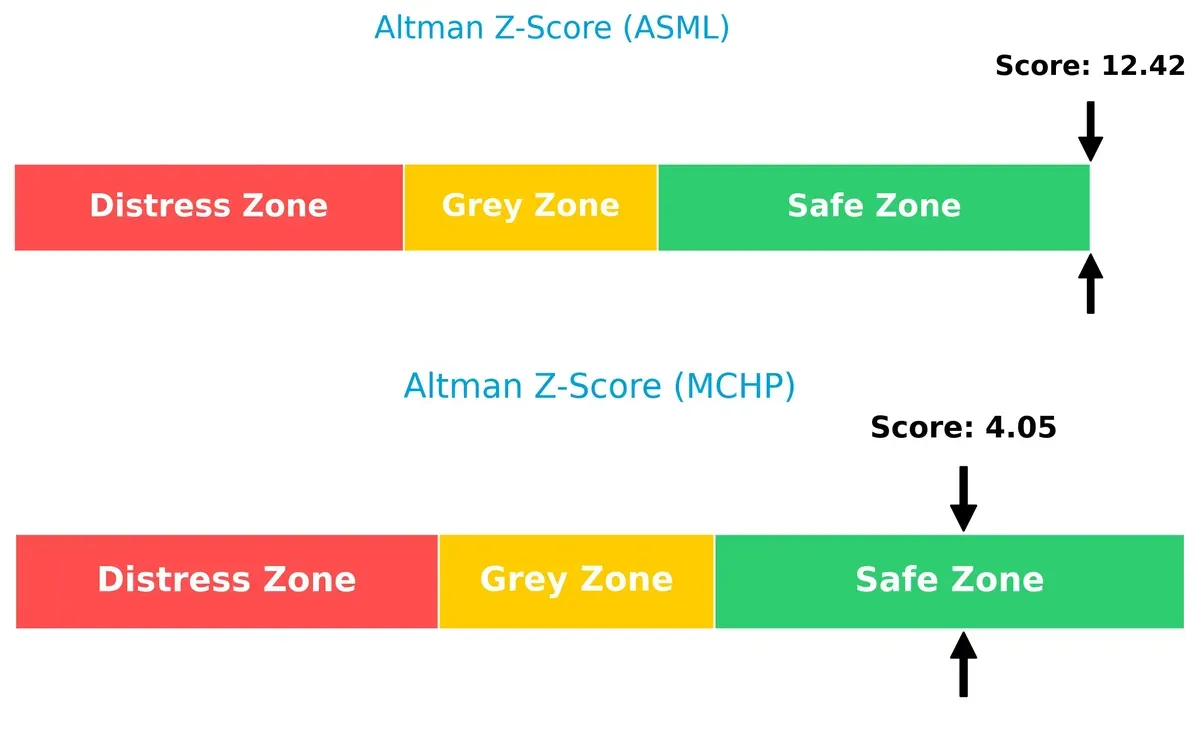
Both companies fall in the safe zone, but ASML’s substantially higher score confirms its far stronger solvency and lower bankruptcy risk. Microchip, while safe, shows less cushion against financial distress.
—
Financial Health: Quality of Operations
ASML’s Piotroski F-Score of 8 versus Microchip’s 3 highlights a significant gap in financial strength and operational quality:
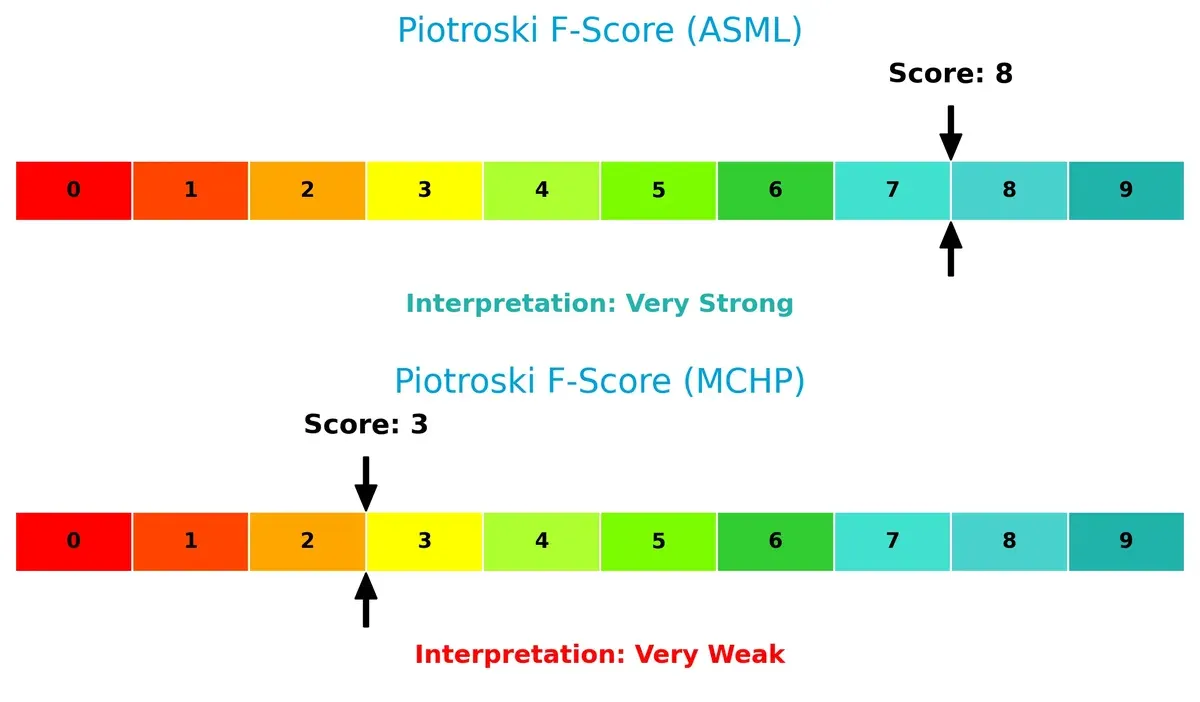
ASML demonstrates peak financial health with robust internal metrics. Microchip’s low score raises red flags about its earnings quality, leverage, and liquidity, suggesting operational challenges compared to ASML.
How are the two companies positioned?
This section dissects the operational DNA of ASML and MCHP by comparing their revenue distribution and internal strengths and weaknesses. We confront their economic moats to identify which model offers the most resilient competitive advantage today.
Revenue Segmentation: The Strategic Mix
This visual comparison dissects how ASML Holding N.V. and Microchip Technology Incorporated diversify their income streams and reveals their primary sector bets:
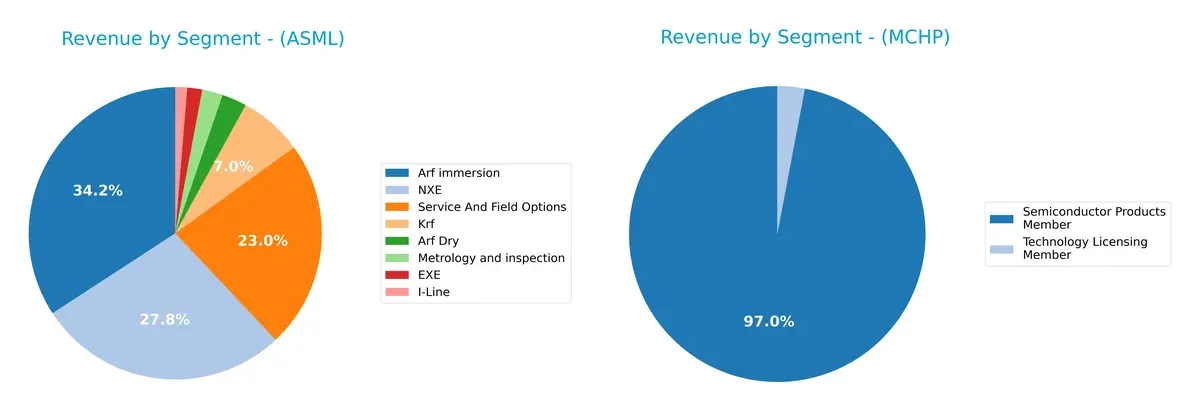
ASML shows a diversified revenue base, with “Arf immersion” at 9.7B and “NXE” at 7.9B anchoring its portfolio, alongside substantial Service revenues of 6.5B. In contrast, Microchip leans heavily on “Semiconductor Products Member” at 4.3B, with minimal contribution from licensing at 131M. ASML’s spread suggests strong ecosystem lock-in and infrastructure dominance, while Microchip faces concentration risk from reliance on a single segment.
Strengths and Weaknesses Comparison
This table compares the Strengths and Weaknesses of ASML Holding N.V. and Microchip Technology Incorporated:
ASML Strengths
- High profitability with net margin 29.42% ROE 47.08% and ROIC 34.14%
- Low debt to equity 0.14 and debt to assets 5.36%
- Strong global presence especially in China and Taiwan
- Diverse product portfolio including EUV and service segments
- Favorable fixed asset turnover 3.81
MCHP Strengths
- Strong liquidity with current ratio 2.59 and quick ratio 1.47
- Favorable dividend yield 3.75%
- Favorable P/E ratio despite net losses
- Favorable fixed asset turnover 3.72
- Technology licensing adds diversification
ASML Weaknesses
- High valuation multiples P/E 38.33 and P/B 18.05
- Unfavorable quick ratio 0.79 indicates liquidity risk
- WACC 10.08% above ROIC is a cost concern
- Low dividend yield 0.69%
- Moderate current ratio 1.26 limits short-term flexibility
MCHP Weaknesses
- Negative profitability metrics with net margin, ROE and ROIC below zero
- Unfavorable interest coverage 1.15 signals debt service risk
- Low asset turnover 0.29 suggests inefficiency
- Unfavorable P/B ratio 3.67
- High debt to equity 0.8 and debt to assets 36.85%
ASML exhibits strong profitability and global reach with some liquidity and valuation risks. MCHP shows solid liquidity and dividend appeal but faces profitability and efficiency challenges. These factors shape each company’s strategic priorities around growth, cost control, and capital allocation.
The Moat Duel: Analyzing Competitive Defensibility
A structural moat is the only barrier protecting long-term profits from relentless competition erosion:
ASML Holding N.V.: Technological Monopoly with Scale Economies
ASML’s moat stems from its exclusive extreme ultraviolet lithography technology. This drives high ROIC above WACC, sustaining margin stability near 35%. New EUV systems and expanded Asian markets deepen its moat in 2026.
Microchip Technology Incorporated: Product Diversification Amid Margin Pressure
Microchip relies on broad product range and embedded solutions for niche markets. However, declining ROIC and negative margins reveal weakening competitive positioning versus ASML. Future growth depends on innovation and cost control to avoid disruption.
Verdict: Technological Monopoly vs. Product Breadth Under Pressure
ASML’s moat is wider and deeper, demonstrated by robust ROIC and profitable growth. Microchip’s shrinking returns and margin erosion signal vulnerability. ASML is clearly better positioned to defend and expand its market share.
Which stock offers better returns?
Over the past year, ASML Holding N.V. surged 43.11%, showing strong acceleration, while Microchip Technology Incorporated declined 14.54% despite recent recovery momentum.
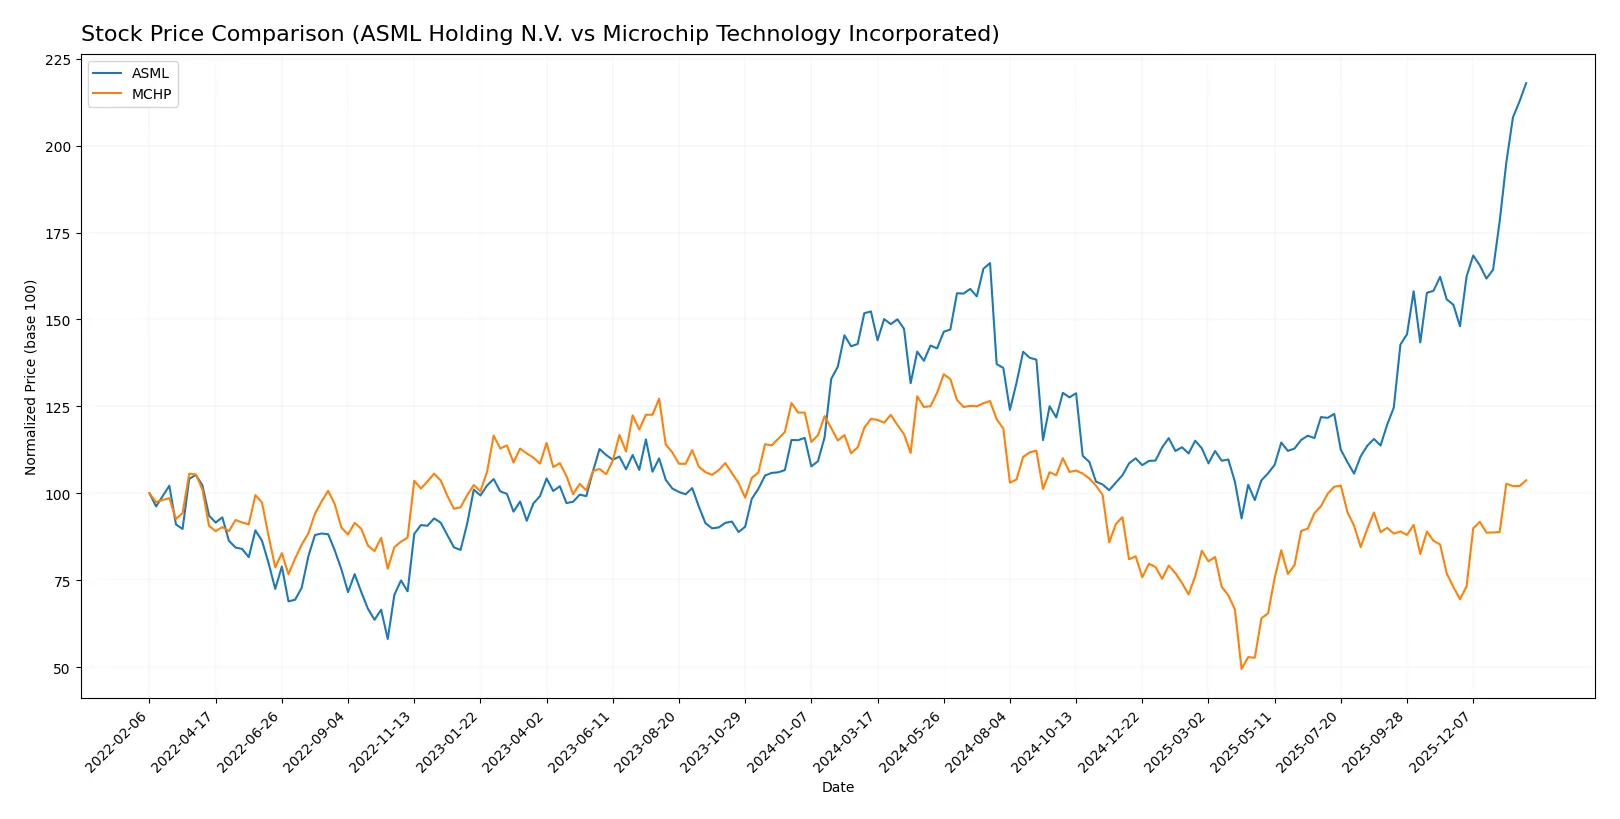
Trend Comparison
ASML’s stock rose 43.11% over 12 months, marking a bullish trend with accelerating gains and a high volatility reflected by a 170.09 std deviation. The price peaked at 1423.0 and bottomed at 605.55.
Microchip’s stock fell 14.54% over the same period, indicating a bearish trend despite acceleration. Recent months show a 41.96% rebound with lower volatility (8.54 std deviation) and mild positive slope.
ASML outperformed Microchip with a strong positive return versus Microchip’s overall decline, delivering the highest market performance over the past year.
Target Prices
The current analyst consensus reflects moderate upside potential for both ASML Holding N.V. and Microchip Technology Incorporated.
| Company | Target Low | Target High | Consensus |
|---|---|---|---|
| ASML Holding N.V. | 1,150 | 1,911 | 1,458.5 |
| Microchip Technology Incorporated | 60 | 95 | 81 |
Analysts expect ASML’s shares to appreciate slightly above the current 1,423 price, signaling confidence in its semiconductor equipment leadership. Microchip’s consensus target exceeds the 75.92 price, indicating upside potential despite recent volatility.

Don’t Let Luck Decide Your Entry Point
Optimize your entry points with our advanced ProRealTime indicators. You’ll get efficient buy signals with precise price targets for maximum performance. Start outperforming now!
How do institutions grade them?
ASML Holding N.V. Grades
The table below lists recent institutional grades for ASML Holding N.V.:
| Grading Company | Action | New Grade | Date |
|---|---|---|---|
| Barclays | Upgrade | Overweight | 2026-01-29 |
| Wells Fargo | Maintain | Overweight | 2026-01-29 |
| RBC Capital | Maintain | Outperform | 2026-01-29 |
| Bernstein | Maintain | Outperform | 2026-01-22 |
| KGI Securities | Upgrade | Outperform | 2026-01-15 |
| Wells Fargo | Maintain | Overweight | 2026-01-15 |
| JP Morgan | Maintain | Overweight | 2026-01-14 |
| Bernstein | Upgrade | Outperform | 2026-01-05 |
| B of A Securities | Maintain | Buy | 2025-12-03 |
| JP Morgan | Maintain | Overweight | 2025-12-01 |
Microchip Technology Incorporated Grades
The table below lists recent institutional grades for Microchip Technology Incorporated:
| Grading Company | Action | New Grade | Date |
|---|---|---|---|
| UBS | Maintain | Buy | 2026-01-26 |
| Susquehanna | Maintain | Positive | 2026-01-22 |
| B of A Securities | Maintain | Neutral | 2026-01-21 |
| Citigroup | Maintain | Buy | 2026-01-15 |
| Piper Sandler | Maintain | Overweight | 2026-01-15 |
| B. Riley Securities | Maintain | Buy | 2026-01-12 |
| Mizuho | Maintain | Outperform | 2026-01-09 |
| Wells Fargo | Maintain | Equal Weight | 2026-01-07 |
| JP Morgan | Maintain | Overweight | 2026-01-06 |
| Rosenblatt | Maintain | Buy | 2026-01-06 |
Which company has the best grades?
ASML Holding N.V. generally receives higher and more consistent grades such as Outperform and Overweight. Microchip’s grades are positive but include more Neutral and Equal Weight ratings. This difference could influence investors seeking stronger institutional conviction.
Risks specific to each company
The following categories identify critical pressure points and systemic threats facing both firms in the 2026 market environment:
1. Market & Competition
ASML Holding N.V.
- Dominates advanced lithography with high barriers to entry but faces cyclical semiconductor demand risks.
Microchip Technology Incorporated
- Competes in diverse microcontroller markets with intense pricing pressure and commoditization risks.
2. Capital Structure & Debt
ASML Holding N.V.
- Low debt-to-equity (0.14) ensures financial flexibility and low leverage risk.
Microchip Technology Incorporated
- Higher leverage (D/E 0.8) raises financial risk; interest coverage of 1.15 signals tight debt servicing capacity.
3. Stock Volatility
ASML Holding N.V.
- Beta at 1.34 indicates moderate sensitivity to market swings, typical for semiconductor equipment firms.
Microchip Technology Incorporated
- Beta at 1.45 signals higher volatility, reflecting cyclicality and investor uncertainty.
4. Regulatory & Legal
ASML Holding N.V.
- Subject to export controls on advanced lithography tech, posing geopolitical and compliance risks.
Microchip Technology Incorporated
- Faces regulatory scrutiny on product safety and trade policies, especially in automotive and industrial sectors.
5. Supply Chain & Operations
ASML Holding N.V.
- Complex global supply chains vulnerable to semiconductor industry bottlenecks and geopolitical tensions.
Microchip Technology Incorporated
- Relies on foundry partners and component suppliers, exposed to supply disruptions and rising costs.
6. ESG & Climate Transition
ASML Holding N.V.
- High energy use in manufacturing demands robust climate transition strategies to mitigate regulatory and reputational risks.
Microchip Technology Incorporated
- Increasing pressure to improve sustainability metrics in embedded systems and manufacturing processes.
7. Geopolitical Exposure
ASML Holding N.V.
- Significant exposure to Asia-Pacific markets, vulnerable to US-China tech tensions.
Microchip Technology Incorporated
- US-based but with global operations, faces risks from trade disputes and supply chain realignments.
Which company shows a better risk-adjusted profile?
ASML’s low leverage and strong profitability shield it from financial stress, despite valuation concerns. Microchip’s weak profitability, high debt, and tight interest coverage elevate risk. ASML’s Altman Z-score (12.4) and Piotroski score (8) confirm robust financial health. Microchip’s scores reveal vulnerability despite moderate Altman safety. The biggest risk for ASML is geopolitical export restrictions; for Microchip, it is financial leverage and weak operational returns. Overall, ASML presents a superior risk-adjusted profile supported by strong fundamentals and lower financial risk.
Final Verdict: Which stock to choose?
ASML’s superpower lies in its durable competitive advantage, demonstrated by an expanding moat and exceptional capital efficiency. It consistently generates strong returns well above its cost of capital. The main point of vigilance is its premium valuation multiples, which may pressure future gains. ASML suits portfolios targeting long-term, aggressive growth with tolerance for valuation risk.
Microchip Technology’s strategic moat centers on its embedded systems niche and steady dividend yield, providing a safety cushion. However, deteriorating profitability and mounting debt raise red flags. Compared to ASML, it offers more stability in cash liquidity but less growth momentum. Microchip fits GARP portfolios seeking moderate growth with income focus and risk mitigation.
If you prioritize robust growth powered by technological leadership and high capital returns, ASML is the compelling choice due to its expanding economic moat and strong financial health. However, if you seek income stability with a value tilt, Microchip offers better defensive qualities despite its weaker profitability and financial stress. Each reflects distinct investor profiles and risk appetites.
Disclaimer: Investment carries a risk of loss of initial capital. The past performance is not a reliable indicator of future results. Be sure to understand risks before making an investment decision.
Go Further
I encourage you to read the complete analyses of ASML Holding N.V. and Microchip Technology Incorporated to enhance your investment decisions: