Home > Comparison > Technology > ASML vs MXL
The strategic rivalry between ASML Holding N.V. and MaxLinear, Inc. shapes the semiconductor industry’s competitive landscape. ASML operates as a capital-intensive leader in advanced lithography equipment, while MaxLinear focuses on integrated communications system-on-chip solutions. This contrast highlights a battle between high-capital manufacturing and agile technology integration. This analysis will determine which trajectory offers superior risk-adjusted returns for diversified portfolios navigating the evolving semiconductor sector.
Table of contents
Companies Overview
ASML Holding N.V. and MaxLinear, Inc. represent two influential players shaping the semiconductor industry landscape.
ASML Holding N.V.: Advanced Lithography Innovator
ASML dominates the semiconductor equipment market with cutting-edge lithography and inspection systems. Its core revenue driver is supplying extreme and deep ultraviolet lithography tools crucial for chip manufacturing. In 2026, ASML prioritizes expanding its technological leadership in extreme ultraviolet (EUV) lithography, sustaining its competitive edge in precision and scale.
MaxLinear, Inc.: Communications SoC Specialist
MaxLinear specializes in high-performance analog and mixed-signal systems-on-chip for broadband, wireless infrastructure, and industrial applications. Its revenue stems from integrated RF and digital communication solutions embedded in routers, modems, and 4G/5G base stations. The company focuses on broadening its presence in next-generation connectivity platforms, optimizing SoC integration to support evolving network demands.
Strategic Collision: Similarities & Divergences
Both companies operate in semiconductors but contrast sharply in scope and philosophy. ASML pursues a capital-intensive, high-moat strategy focused on manufacturing precision tools, whereas MaxLinear emphasizes scalable, integrated communication chips. Their primary battleground is the semiconductor value chain—ASML in equipment, MaxLinear in system integration. This divergence creates distinct investment profiles: ASML offers scale and technological dominance; MaxLinear provides nimble exposure to communication infrastructure growth.
Income Statement Comparison
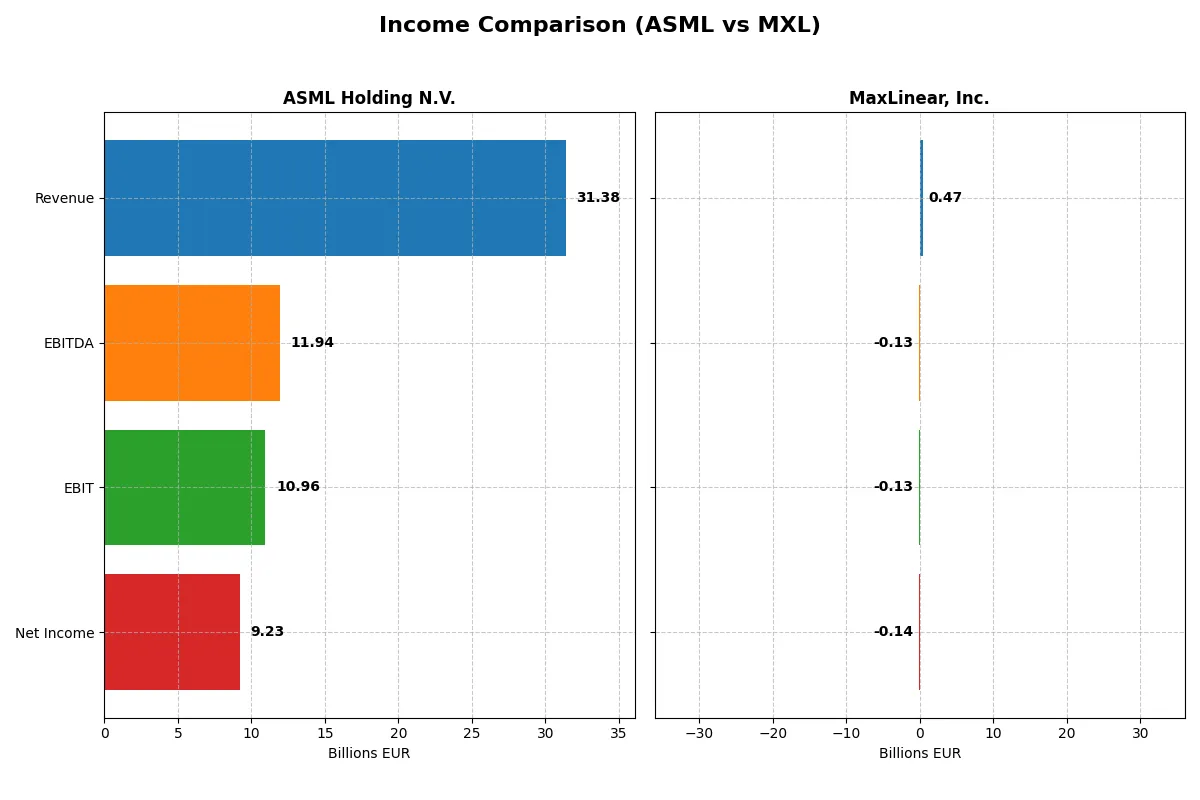
The following data dissects the core profitability and scalability of both corporate engines to reveal who dominates the bottom line:
| Metric | ASML Holding N.V. (ASML) | MaxLinear, Inc. (MXL) |
|---|---|---|
| Revenue | 31.4B EUR | 468M USD |
| Cost of Revenue | 14.8B EUR | 202M USD |
| Operating Expenses | 5.7B EUR | 393M USD |
| Gross Profit | 16.6B EUR | 266M USD |
| EBITDA | 11.9B EUR | -131M USD |
| EBIT | 11.0B EUR | -131M USD |
| Interest Expense | 0 EUR | 10.1M USD |
| Net Income | 9.2B EUR | -137M USD |
| EPS | 23.76 EUR | -1.58 USD |
| Fiscal Year | 2025 | 2025 |
Income Statement Analysis: The Bottom-Line Duel
The upcoming income statement comparison reveals the true efficiency and profitability of each company’s core operations and growth trajectory.
ASML Holding N.V. Analysis
ASML’s revenue surged to €31.4B in 2025, up 11% from the prior year, while net income climbed 22% to €9.2B. The company sustains robust gross margins above 52% and a net margin near 29%, reflecting strong pricing power and operational leverage. Its latest year shows accelerating EBIT growth of 19%, confirming efficient cost control alongside expanding top-line momentum.
MaxLinear, Inc. Analysis
MaxLinear’s revenue improved 30% to $468M in 2025, rebounding from prior declines, yet it remains well below its 2021 peak of $892M. Despite a healthy gross margin near 57%, the company records a negative EBIT margin of -28% and net losses of $137M, signaling ongoing profitability struggles. Recent margin improvements hint at operational recovery, but losses persist.
Steady Profitability vs. Recovery Challenge
ASML dominates with consistent top-line growth, superior margins, and expanding net income, underscoring durable competitive advantages. MaxLinear shows encouraging revenue momentum but remains burdened by losses and weak profitability metrics. For investors, ASML’s strong earnings profile offers reliability, while MaxLinear presents a higher-risk turnaround story requiring cautious scrutiny.
Financial Ratios Comparison
These vital ratios act as a diagnostic tool to expose the underlying fiscal health, valuation premiums, and capital efficiency of the companies compared below:
| Ratios | ASML Holding N.V. (ASML) | MaxLinear, Inc. (MXL) |
|---|---|---|
| ROE | 47.1% | -47.5% |
| ROIC | 34.1% | -24.3% |
| P/E | 38.3 | -6.7 |
| P/B | 18.0 | 3.20 |
| Current Ratio | 1.26 | 1.77 |
| Quick Ratio | 0.79 | 1.28 |
| D/E (Debt/Equity) | 0.14 | 0.29 |
| Debt-to-Assets | 5.4% | 17.2% |
| Interest Coverage | N/A | N/A |
| Asset Turnover | 0.62 | 0.42 |
| Fixed Asset Turnover | 3.81 | 4.65 |
| Payout Ratio | 26.5% | 0% |
| Dividend Yield | 0.69% | 0% |
| Fiscal Year | 2025 | 2024 |
Efficiency & Valuation Duel: The Vital Signs
Financial ratios serve as a company’s DNA, uncovering hidden risks and exposing operational strengths crucial for informed investment decisions.
ASML Holding N.V.
ASML boasts a commanding ROE of 47.08% and a strong net margin near 30%, signaling operational excellence. Its P/E ratio at 38.33 suggests the stock is expensive relative to earnings. Shareholders see modest returns from a 0.69% dividend yield, while substantial R&D spending underpins growth, reflecting a reinvestment strategy.
MaxLinear, Inc.
MaxLinear struggles with a negative ROE of -47.49% and a steep -68% net margin, revealing profitability challenges. Its P/E is favorable but reflects losses, not earnings. The company returns no dividends, instead channeling 62% of revenue into R&D, aiming to fuel a turnaround. Liquidity ratios remain healthy, supporting operational stability.
Premium Valuation vs. Operational Safety
ASML balances high profitability with a premium valuation, while MaxLinear faces significant operational losses despite a lower valuation. ASML suits investors prioritizing growth and operational strength. MaxLinear appeals to risk-tolerant investors betting on innovation-driven recovery.
Which one offers the Superior Shareholder Reward?
I see ASML Holding N.V. delivers steady dividends with a 0.97% yield and a sustainable 34% payout ratio in 2025. It pairs this with robust buyback programs, supported by strong free cash flow of 27.4B EUR. MaxLinear, Inc. pays no dividends and posts negative margins, relying on reinvestment amid losses. Its buybacks are negligible due to cash flow deficits. Historically, ASML’s balanced strategy of dividends and buybacks, backed by high operating margins and low debt, offers a far more attractive and durable total return profile for 2026 investors than MaxLinear’s riskier growth approach.
Comparative Score Analysis: The Strategic Profile
The radar chart reveals the fundamental DNA and trade-offs of both ASML Holding N.V. and MaxLinear, Inc.:
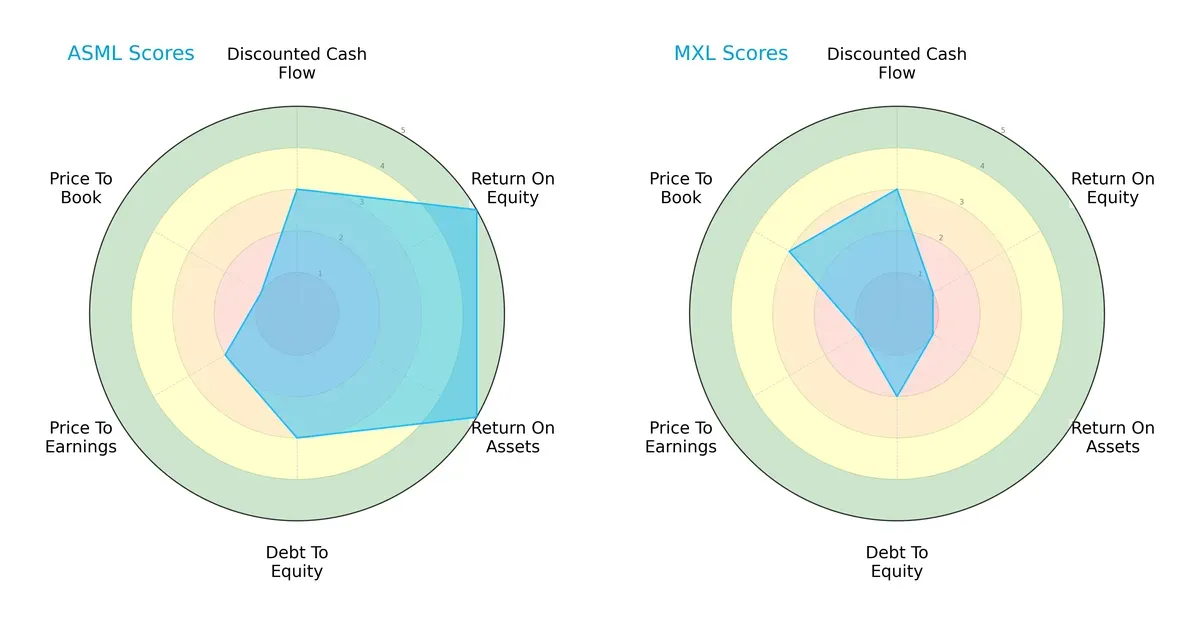
ASML demonstrates a balanced profile with strong returns on equity (5) and assets (5), paired with moderate debt management (3) and cash flow (3). MaxLinear relies on a specific valuation edge in price-to-book (3) but struggles with profitability scores (ROE and ROA both at 1) and weaker overall scores (2). ASML’s diversified strengths suggest a resilient competitive moat, while MaxLinear’s profile signals higher risk and concentrated advantages.
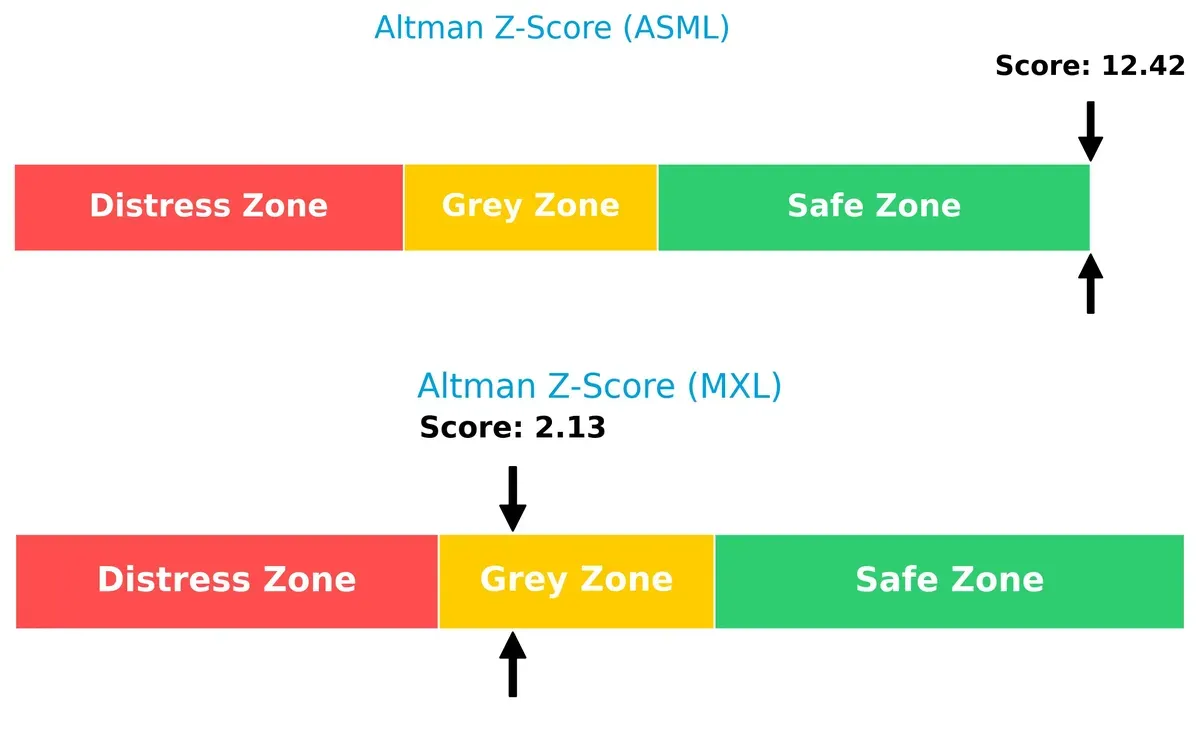
Bankruptcy Risk: Solvency Showdown
ASML’s Altman Z-Score of 12.4 places it firmly in the safe zone, indicating robust long-term solvency. MaxLinear’s 2.1 score lands in the grey zone, signaling moderate financial distress risks in volatile cycles:
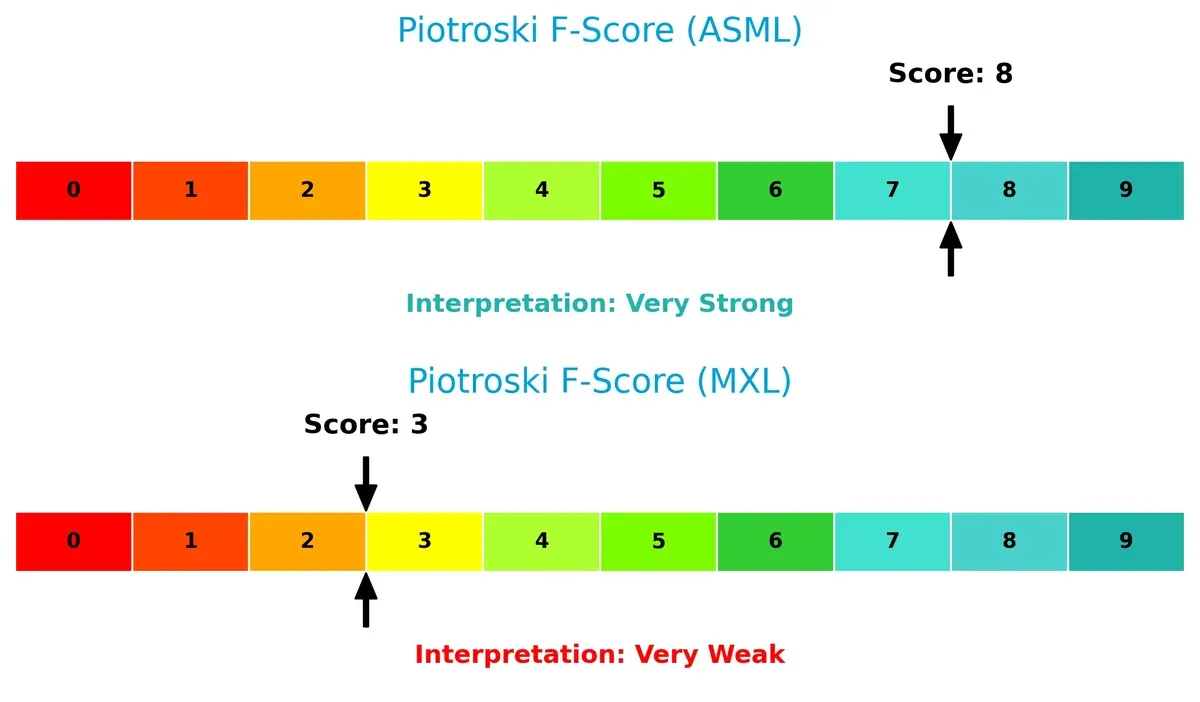
Financial Health: Quality of Operations
ASML’s Piotroski F-Score of 8 reflects very strong financial health and operational quality. MaxLinear’s score of 3 raises red flags, showing weak internal metrics and potential distress compared to ASML’s solid fundamentals:
How are the two companies positioned?
This section dissects ASML and MXL’s operational DNA by comparing revenue distribution and internal dynamics. The goal is to confront their economic moats and identify which model offers the most resilient competitive advantage today.
Revenue Segmentation: The Strategic Mix
This visual comparison dissects how ASML Holding N.V. and MaxLinear, Inc. diversify income streams and highlights their primary sector bets:
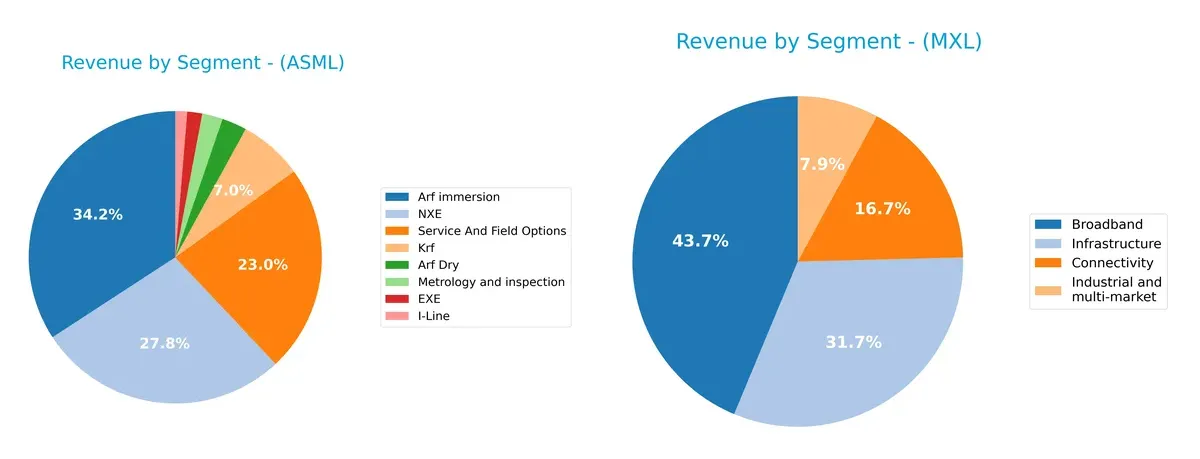
ASML anchors its revenue in Arf immersion (9.67B) and NXE (7.86B), creating a dominant semiconductor equipment focus. MaxLinear shows a more balanced mix with Broadband (204M) and Infrastructure (148M) revenues close in scale, reflecting diversified exposure. ASML’s concentration signals ecosystem lock-in risk but strong product moats, while MaxLinear’s spread pivots toward multi-market resilience amid competitive infrastructure dynamics.
Strengths and Weaknesses Comparison
This table compares the Strengths and Weaknesses of ASML Holding N.V. and MaxLinear, Inc.:
ASML Strengths
- High profitability with 29.42% net margin
- ROE of 47.08% and ROIC of 34.14% indicate strong capital efficiency
- Low debt-to-assets at 5.36% reduces financial risk
- Global presence with significant revenue from China, Korea, Taiwan, and US
MXL Strengths
- Strong liquidity with 1.77 current ratio and 1.28 quick ratio
- Favorable debt-to-equity and debt-to-assets ratios support balance sheet stability
- Diverse product segments including Broadband and Infrastructure
- Favorable P/E ratio despite overall negative profitability
ASML Weaknesses
- Unfavorable valuation multiples with P/E 38.33 and P/B 18.05 signal high market expectations
- Quick ratio below 1 at 0.79 suggests liquidity concerns
- WACC exceeds 10%, increasing capital costs
- Dividend yield low at 0.69% limits income appeal
MXL Weaknesses
- Negative profitability with -68.01% net margin and negative ROE/ROIC indicate operational losses
- Negative interest coverage implies financial distress risk
- Asset turnover low at 0.42 limits revenue generation efficiency
- No dividend yield weakens shareholder returns
ASML demonstrates robust profitability and global market reach but faces valuation and liquidity challenges. MXL shows balance sheet resilience and product diversity but struggles with profitability and operational efficiency. Both companies must address these issues to align strategy with market expectations.
The Moat Duel: Analyzing Competitive Defensibility
A structural moat shields long-term profits from relentless competition and market pressures. Here’s a deep dive into ASML Holding and MaxLinear’s moats:
ASML Holding N.V.: Technological Dominance Through Intangible Assets
ASML’s moat stems from its proprietary lithography technology and intellectual property. This drives a high ROIC well above WACC, backing margin stability and strong profitability. Ongoing advances in EUV systems signal deepening moats and fortified market leadership in 2026.
MaxLinear, Inc.: Cost and Integration Challenge Amid Financial Struggles
MaxLinear’s moat relies on cost advantages and integrated SoC solutions, but it suffers a negative ROIC trend, shedding value. Its weaker financial position contrasts sharply with ASML’s dominance. Growth in 5G and data infrastructure offers a possible turnaround path but remains uncertain.
Verdict: Proprietary Tech vs. Cost Efficiency in a High-Stakes Semiconductor Market
ASML boasts a wider, more durable moat, evidenced by growing ROIC and robust profit margins. MaxLinear’s declining ROIC and losses signal vulnerability. ASML is far better equipped to defend its market share and sustain value creation.
Which stock offers better returns?
The past year shows ASML Holding N.V. surging with strong price gains and buyer dominance, while MaxLinear, Inc. faced overall declines despite recent upward momentum.
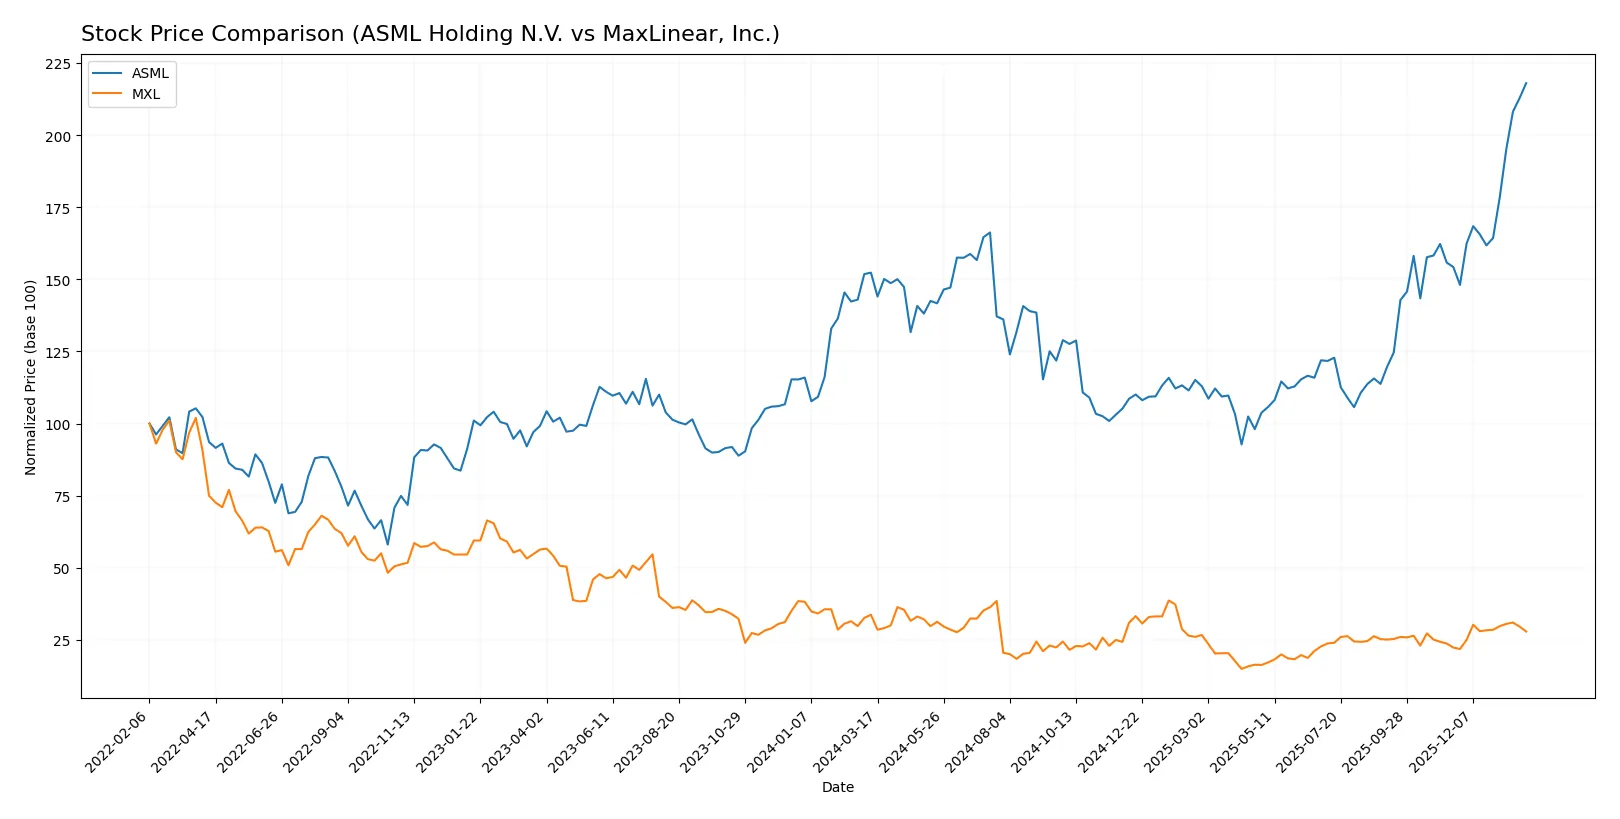
Trend Comparison
ASML Holding N.V. posted a 43.11% price increase over 12 months, signaling a bullish trend with accelerating gains and a high of 1423.0.
MaxLinear, Inc. experienced a 17.26% decline over the same period, marking a bearish trend despite recent acceleration and a 24.82% rebound since November 2025.
ASML’s sustained bullish trend outperformed MaxLinear’s bearish trajectory, delivering the highest market returns over the past year.
Target Prices
Analysts present a mixed but generally optimistic target consensus for ASML Holding N.V. and MaxLinear, Inc.
| Company | Target Low | Target High | Consensus |
|---|---|---|---|
| ASML Holding N.V. | 1150 | 1911 | 1458.5 |
| MaxLinear, Inc. | 15 | 25 | 21 |
ASML’s target consensus at 1458.5 slightly exceeds its current price of 1423, signaling modest upside potential. MaxLinear’s consensus target of 21 stands notably above its current 17.35, suggesting room for recovery amid recent stock weakness.

Don’t Let Luck Decide Your Entry Point
Optimize your entry points with our advanced ProRealTime indicators. You’ll get efficient buy signals with precise price targets for maximum performance. Start outperforming now!
How do institutions grade them?
ASML Holding N.V. Grades
The latest ASML grades from major institutions are summarized below:
| Grading Company | Action | New Grade | Date |
|---|---|---|---|
| Barclays | Upgrade | Overweight | 2026-01-29 |
| Wells Fargo | Maintain | Overweight | 2026-01-29 |
| RBC Capital | Maintain | Outperform | 2026-01-29 |
| Bernstein | Maintain | Outperform | 2026-01-22 |
| KGI Securities | Upgrade | Outperform | 2026-01-15 |
| Wells Fargo | Maintain | Overweight | 2026-01-15 |
| JP Morgan | Maintain | Overweight | 2026-01-14 |
| Bernstein | Upgrade | Outperform | 2026-01-05 |
| B of A Securities | Maintain | Buy | 2025-12-03 |
| JP Morgan | Maintain | Overweight | 2025-12-01 |
MaxLinear, Inc. Grades
Below is a summary of recent MaxLinear grades from recognized firms:
| Grading Company | Action | New Grade | Date |
|---|---|---|---|
| Wells Fargo | Maintain | Equal Weight | 2026-01-30 |
| Benchmark | Maintain | Buy | 2026-01-16 |
| Benchmark | Maintain | Buy | 2025-10-24 |
| Benchmark | Maintain | Buy | 2025-10-17 |
| Benchmark | Maintain | Buy | 2025-09-02 |
| Loop Capital | Maintain | Hold | 2025-08-04 |
| Wells Fargo | Maintain | Equal Weight | 2025-07-24 |
| Benchmark | Maintain | Buy | 2025-07-24 |
| Susquehanna | Maintain | Neutral | 2025-07-24 |
| Susquehanna | Maintain | Neutral | 2025-07-22 |
Which company has the best grades?
ASML Holding N.V. consistently receives higher grades such as Outperform and Overweight. MaxLinear, Inc. mostly earns Buy or Equal Weight ratings. ASML’s stronger grades suggest greater institutional confidence, potentially attracting more investor interest.
Risks specific to each company
The following categories identify the critical pressure points and systemic threats facing both firms in the 2026 market environment:
1. Market & Competition
ASML Holding N.V.
- Dominates advanced lithography with high barriers to entry but faces cyclical semiconductor demand risks.
MaxLinear, Inc.
- Operates in a highly fragmented RF and mixed-signal SoC market with intense price competition and rapid technology shifts.
2. Capital Structure & Debt
ASML Holding N.V.
- Low debt-to-equity (0.14) and strong interest coverage indicate robust financial stability.
MaxLinear, Inc.
- Moderate leverage (D/E 0.29) but negative interest coverage signals strain servicing debt.
3. Stock Volatility
ASML Holding N.V.
- Beta 1.34 suggests moderate sensitivity to market swings, typical for large tech firms.
MaxLinear, Inc.
- Beta 1.77 indicates higher volatility and risk relative to the broader market.
4. Regulatory & Legal
ASML Holding N.V.
- Faces export controls and IP risks due to global semiconductor tensions.
MaxLinear, Inc.
- Subject to telecommunications regulations and evolving standards impacting product certifications.
5. Supply Chain & Operations
ASML Holding N.V.
- Complex global supply chain with risks from geopolitical tensions and component shortages.
MaxLinear, Inc.
- Smaller scale supply chain more vulnerable to disruptions and less diversified.
6. ESG & Climate Transition
ASML Holding N.V.
- Strong emphasis on sustainable manufacturing but exposed to energy-intensive production challenges.
MaxLinear, Inc.
- ESG initiatives less mature; faces pressure to improve energy efficiency and governance.
7. Geopolitical Exposure
ASML Holding N.V.
- High exposure to Asia-Pacific chipmakers amid US-China tech tensions.
MaxLinear, Inc.
- Primarily US-based but reliant on global customers, vulnerable to trade policy shifts.
Which company shows a better risk-adjusted profile?
ASML’s dominant market position, strong balance sheet, and safe-zone Altman Z-Score (12.4) signal a superior risk-adjusted profile. MaxLinear struggles with negative profitability, weaker bankruptcy scores, and higher stock volatility. ASML’s biggest risk is geopolitical supply chain disruption; MaxLinear’s is financial distress from poor earnings and negative interest coverage. The stark contrast in Altman Z-Scores highlights MaxLinear’s elevated risk, confirming ASML as the safer investment amid 2026’s complex semiconductor landscape.
Final Verdict: Which stock to choose?
ASML Holding N.V. impresses with its robust efficiency and durable economic moat. Its ability to generate returns well above its cost of capital highlights superior capital allocation. The main point of vigilance remains its high valuation multiples, which might temper near-term upside. ASML suits portfolios seeking long-term, aggressive growth underpinned by technological leadership.
MaxLinear, Inc. offers an intriguing turnaround narrative with a strategic focus on R&D investment, aiming to build future competitive advantages. Its stronger liquidity ratios provide a safety cushion compared to ASML. However, persistent negative profitability and value destruction mark significant risks. MXL fits investors inclined toward growth at a reasonable price, accepting volatility for potential recovery.
If you prioritize stability and proven value creation, ASML outshines with its consistent profitability and strong financial health. However, if you seek speculative growth with a higher risk tolerance, MXL offers a chance to capitalize on operational restructuring and evolving market opportunities. Each choice reflects distinct investor profiles balancing risk and growth expectations.
Disclaimer: Investment carries a risk of loss of initial capital. The past performance is not a reliable indicator of future results. Be sure to understand risks before making an investment decision.
Go Further
I encourage you to read the complete analyses of ASML Holding N.V. and MaxLinear, Inc. to enhance your investment decisions: