Home > Comparison > Technology > ASML vs MRVL
The strategic rivalry between ASML Holding N.V. and Marvell Technology, Inc. shapes the semiconductor industry’s future. ASML operates as a capital-intensive equipment manufacturer specializing in lithography systems, while Marvell focuses on designing and selling integrated circuits with a high-margin product mix. This contest pits industry-leading scale against agile innovation. This analysis will determine which company’s trajectory offers superior risk-adjusted returns for a diversified technology portfolio.
Table of contents
Companies Overview
ASML Holding N.V. and Marvell Technology, Inc. represent two heavyweight players shaping the semiconductor landscape with distinct market footprints and innovation strategies.
ASML Holding N.V.: Global Lithography Equipment Leader
ASML dominates the semiconductor equipment sector by developing advanced lithography systems essential for chip manufacturing. Its revenue stems from selling and servicing extreme ultraviolet and deep ultraviolet lithography machines worldwide. In 2026, ASML sharpens its competitive edge by advancing computational lithography and upgrading existing systems, reinforcing its technological moat in semiconductor fabrication.
Marvell Technology, Inc.: Integrated Circuit Innovator
Marvell excels in designing and marketing mixed-signal and digital integrated circuits focusing on Ethernet solutions and storage controllers. Its core revenue comes from a broad portfolio of processors, ASICs, and networking products. The company’s 2026 strategy emphasizes expanding connectivity and storage technologies to meet evolving data infrastructure demands globally.
Strategic Collision: Similarities & Divergences
ASML and Marvell both drive semiconductor innovation but diverge in their business models: ASML operates a capital-intensive, equipment-focused model, while Marvell pursues a product-diverse, chip-design approach. They clash primarily in enabling next-generation chip performance—ASML through manufacturing precision, Marvell through integrated circuit functionality. These differences define their unique investment profiles: ASML as a hardware equipment stalwart, Marvell as a versatile chip designer.
Income Statement Comparison
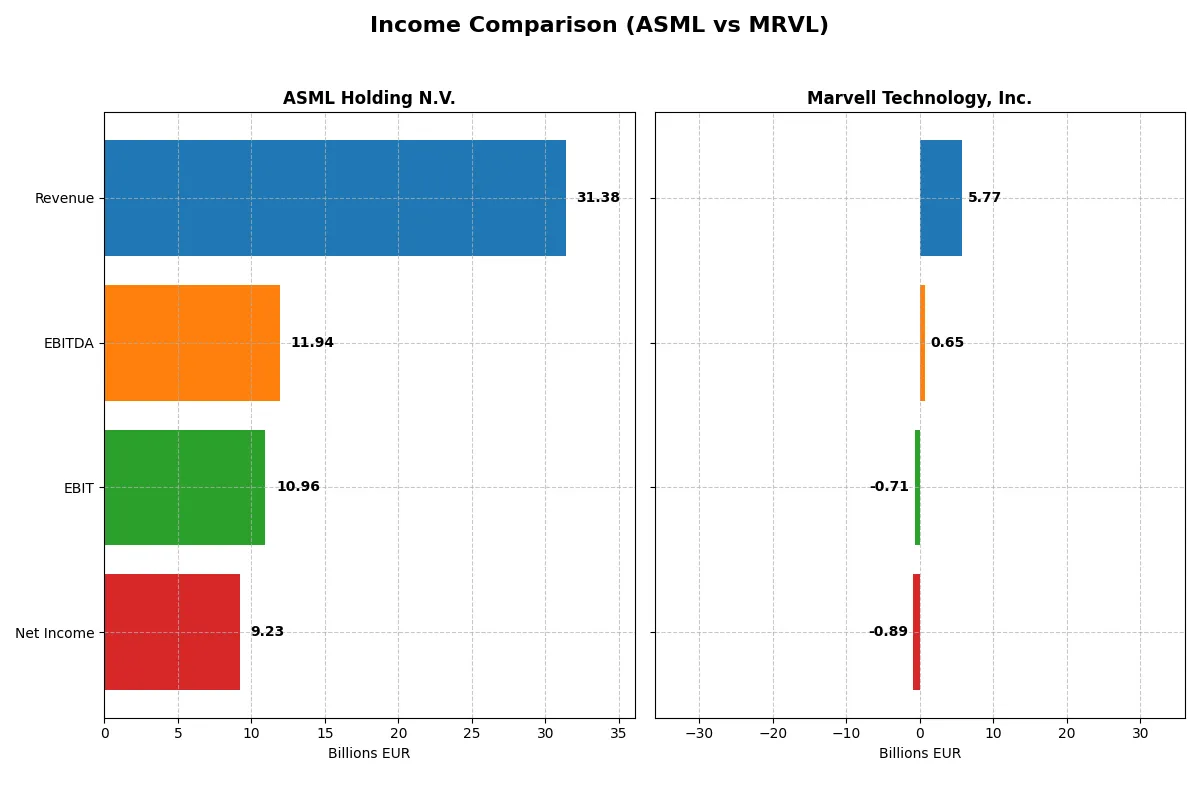
This data dissects the core profitability and scalability of both corporate engines to reveal who dominates the bottom line:
| Metric | ASML Holding N.V. (ASML) | Marvell Technology, Inc. (MRVL) |
|---|---|---|
| Revenue | 31.4B EUR | 5.77B USD |
| Cost of Revenue | 14.8B EUR | 3.39B USD |
| Operating Expenses | 5.72B EUR | 3.10B USD |
| Gross Profit | 16.6B EUR | 2.38B USD |
| EBITDA | 11.9B EUR | 652M USD |
| EBIT | 11.0B EUR | -705M USD |
| Interest Expense | 0 | 189M USD |
| Net Income | 9.23B EUR | -885M USD |
| EPS | 23.76 EUR | -1.02 USD |
| Fiscal Year | 2025 | 2025 |
Income Statement Analysis: The Bottom-Line Duel
This income statement comparison will reveal which company operates with greater efficiency and financial strength through recent market cycles.
ASML Holding N.V. Analysis
ASML demonstrates a robust upward trajectory, with 2025 revenues reaching €31.4B, up 11% from 2024, and net income soaring to €9.2B. The company sustains strong margins, with a 52.8% gross margin and a 29.4% net margin, reflecting stellar cost control and operational efficiency. Its EBIT margin climbs to 34.9%, underlining accelerating profitability momentum.
Marvell Technology, Inc. Analysis
Marvell’s revenues grew modestly to $5.77B in 2025, a 4.7% increase over 2024, yet it remains unprofitable with a net loss of $885M. The gross margin holds at a reasonable 41.3%, but the negative EBIT margin of -12.2% reveals persistent operational challenges. Despite slight EPS improvement, the company struggles to convert revenue growth into earnings.
Verdict: Profit Leadership vs. Growth Struggles
ASML clearly outperforms Marvell in both scale and profitability, boasting favorable margin expansion and consistent net income growth. Marvell’s revenue growth is overshadowed by ongoing losses and margin pressure. For investors prioritizing financial strength and operational efficiency, ASML’s profile offers a more compelling and resilient earnings engine.
Financial Ratios Comparison
These vital ratios act as a diagnostic tool to expose the underlying fiscal health, valuation premiums, and capital efficiency of the companies analyzed:
| Ratios | ASML Holding N.V. (ASML) | Marvell Technology, Inc. (MRVL) |
|---|---|---|
| ROE | 47.08% | -6.59% |
| ROIC | 34.14% | -3.88% |
| P/E | 38.33 | -110.37 |
| P/B | 18.05 | 7.27 |
| Current Ratio | 1.26 | 1.54 |
| Quick Ratio | 0.79 | 1.03 |
| D/E | 0.14 | 0.32 |
| Debt-to-Assets | 5.36% | 21.50% |
| Interest Coverage | N/A | -3.80 |
| Asset Turnover | 0.62 | 0.29 |
| Fixed Asset Turnover | 3.81 | 5.56 |
| Payout ratio | 26.54% | -23.45% |
| Dividend yield | 0.69% | 0.21% |
| Fiscal Year | 2025 | 2025 |
Efficiency & Valuation Duel: The Vital Signs
Financial ratios act as a company’s DNA, uncovering hidden risks and operational strengths essential for investment decisions.
ASML Holding N.V.
ASML demonstrates strong profitability with a 47.08% ROE and a 29.42% net margin, signaling operational efficiency. However, its valuation appears stretched, with a P/E of 38.33 and P/B at 18.05. Shareholders receive modest dividends (0.69% yield), while the company reinvests heavily in R&D, fueling innovation and growth.
Marvell Technology, Inc.
Marvell struggles with negative profitability metrics: -6.59% ROE and -15.35% net margin highlight operational challenges. Despite a favorable negative P/E, the stock is expensive relative to earnings quality. It pays minimal dividends (0.21% yield) and channels resources into R&D, aiming to reverse profitability issues over time.
Premium Valuation vs. Operational Safety
ASML balances high profitability and operational safety despite a stretched valuation. Marvell’s attractive P/E masks deeper profitability concerns and elevated risks. Investors prioritizing stable returns and operational strength may prefer ASML, while those seeking turnaround potential might consider Marvell’s growth profile.
Which one offers the Superior Shareholder Reward?
I see ASML Holding N.V. offers a more attractive shareholder reward than Marvell Technology, Inc. ASML delivers a stable dividend yield near 0.9%, with payout ratios around 26-34%, well-covered by strong free cash flow (24B–27B EUR). Its buyback program complements dividends, supporting total returns sustainably. Marvell pays a minimal dividend yield below 0.3%, with negative earnings and payout ratios, signaling reliance on reinvestment over distributions. Marvell’s modest buybacks cannot offset its volatile profitability. Historically, ASML’s balanced yield and buybacks align with capital allocation best practices, offering superior, sustainable total returns in 2026.
Comparative Score Analysis: The Strategic Profile
The radar chart reveals the fundamental DNA and trade-offs of ASML Holding N.V. and Marvell Technology, Inc., highlighting their financial strengths and valuation nuances:
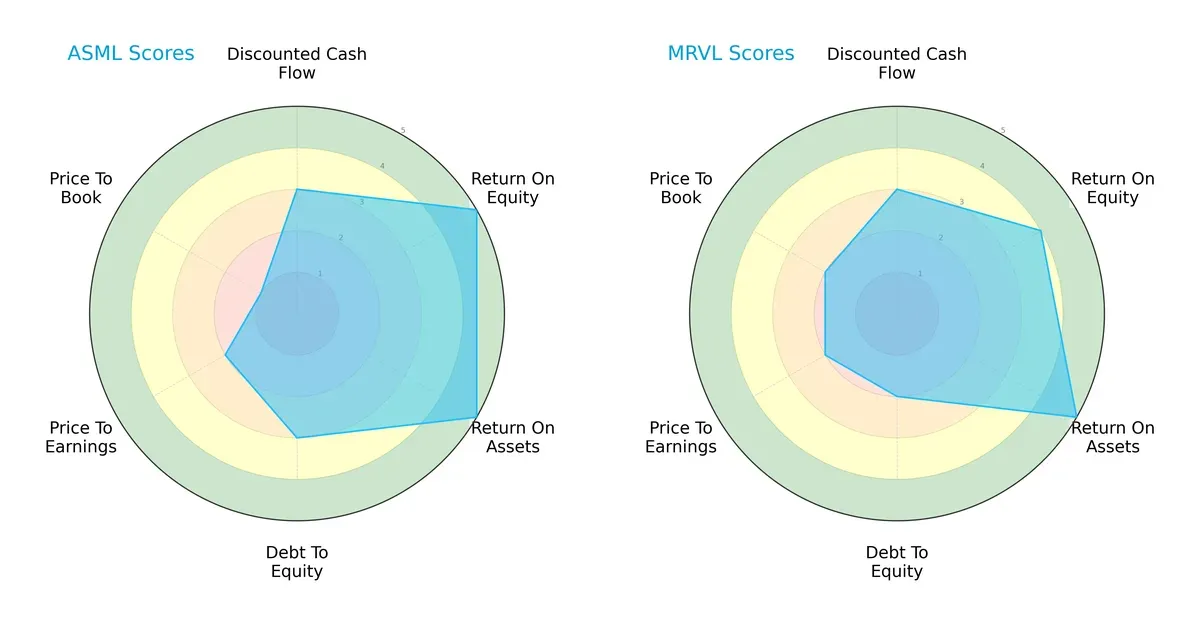
ASML excels in return on equity (5) and assets (5), showing operational efficiency. Marvell matches ASML’s return on assets (5) but trails on equity (4). ASML’s debt-to-equity score (3) indicates moderate leverage, stronger than Marvell’s (2). Valuation metrics favor Marvell slightly, with better price-to-book (2 vs. 1) but both share moderate P/E scores (2). ASML presents a more balanced profile, leveraging profitability, while Marvell relies more on valuation attractiveness.
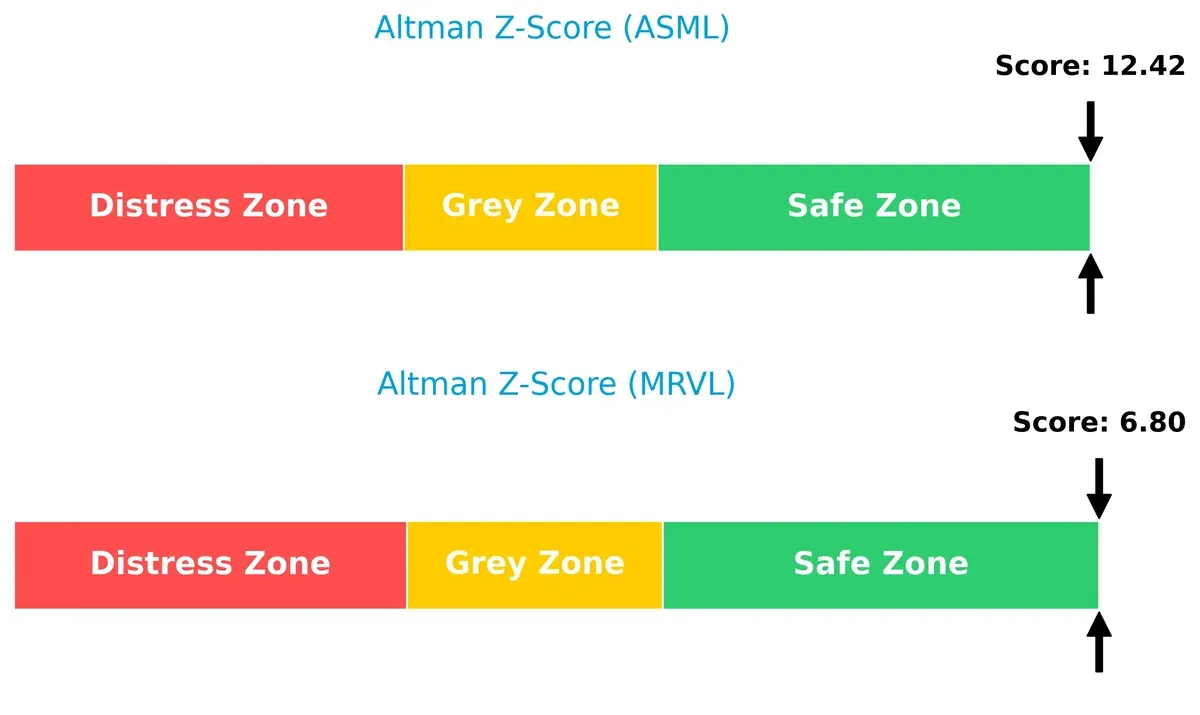
Bankruptcy Risk: Solvency Showdown
ASML’s Altman Z-Score of 12.4 far exceeds Marvell’s 6.8, both safely above distress thresholds, signaling robust solvency and low bankruptcy risk in this cycle:
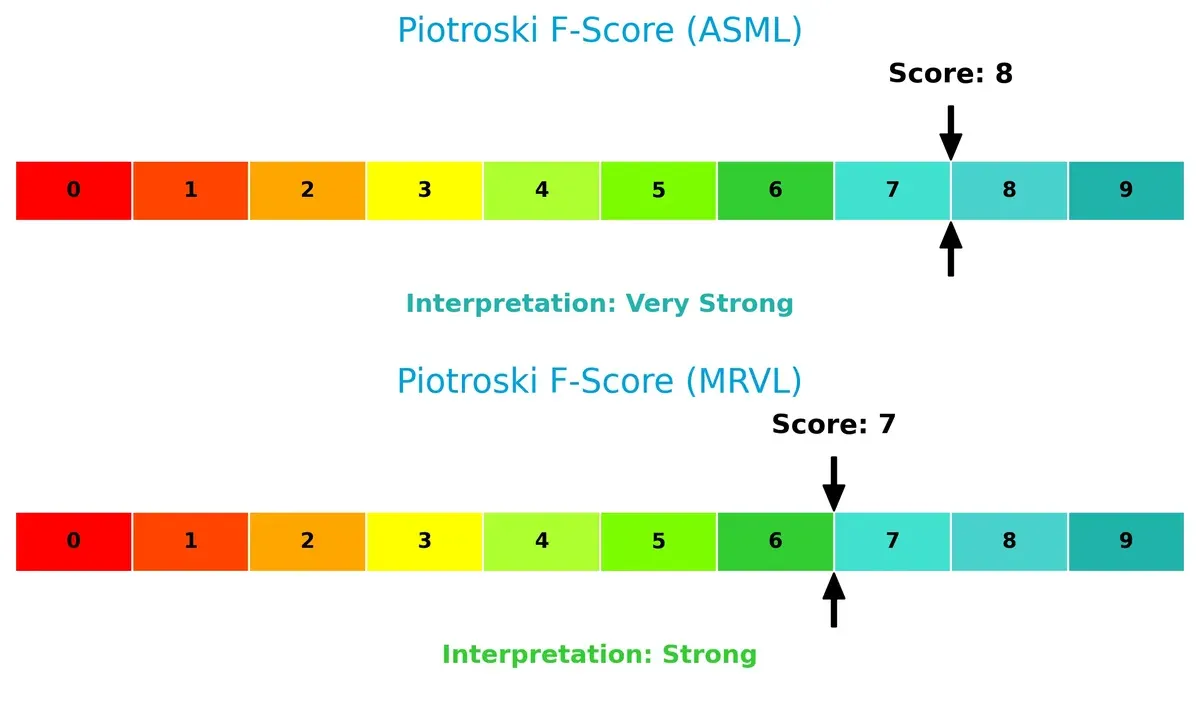
Financial Health: Quality of Operations
ASML scores 8 on the Piotroski F-Score, indicating very strong financial health. Marvell’s 7 reflects strong but slightly less robust internal metrics, with no immediate red flags:
How are the two companies positioned?
This section dissects ASML and Marvell’s operational DNA through revenue segmentation and their internal strengths and weaknesses. The goal is to confront their economic moats and reveal which model delivers the most resilient, sustainable competitive advantage today.
Revenue Segmentation: The Strategic Mix
This visual comparison dissects how ASML Holding N.V. and Marvell Technology, Inc. diversify their income streams and where their primary sector bets lie:
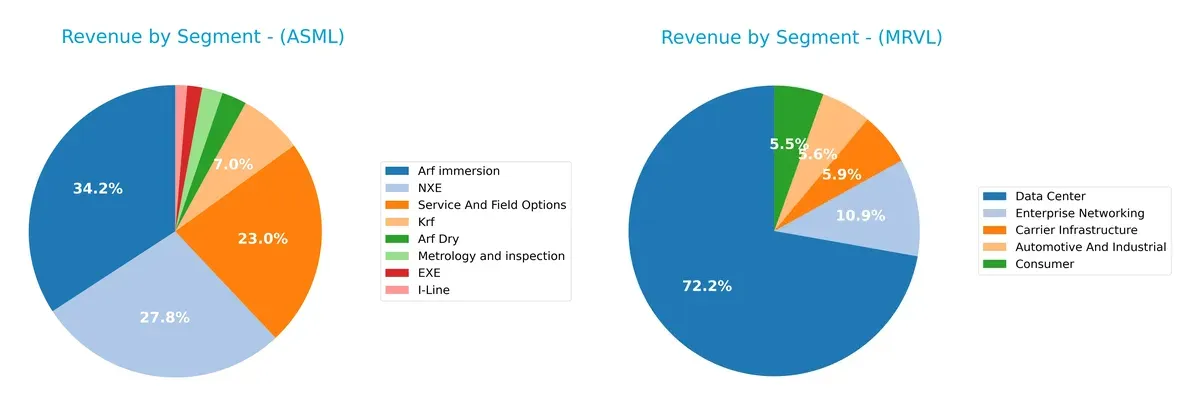
ASML relies heavily on its “Arf immersion” at 9.67B and “NXE” at 7.86B, anchoring revenue in advanced lithography systems. Marvell’s mix is more diversified, with “Data Center” revenue at 4.16B complemented by balanced contributions from “Enterprise Networking” at 626M and “Carrier Infrastructure” at 338M. ASML’s concentration signals infrastructure dominance but also concentration risk, while Marvell pivots on ecosystem breadth and sector diversification.
Strengths and Weaknesses Comparison
This table compares the Strengths and Weaknesses of ASML Holding N.V. and Marvell Technology, Inc.:
ASML Strengths
- High net margin (29.42%) and ROE (47.08%) indicating strong profitability
- Favorable ROIC (34.14%) well above cost of capital
- Low debt-to-assets (5.36%) and excellent interest coverage
- Diverse product segments, including high-value EUV lithography
- Strong global presence with significant revenues from China, Taiwan, and US
MRVL Strengths
- Favorable current and quick ratios indicating good liquidity
- Moderate debt-to-assets (21.5%) with manageable debt levels
- Good fixed asset turnover (5.56) suggesting efficient asset use
- Diverse revenue base across automotive, data center, and networking
- Global sales presence including China, US, and multiple Asian countries
ASML Weaknesses
- High valuation multiples (PE 38.33, PB 18.05) may indicate overpricing
- Quick ratio below 1 (0.79) signals weaker short-term liquidity
- WACC (10.08%) relatively high compared to ROIC advantage
- Moderate asset turnover (0.62) limits revenue generation efficiency
- Low dividend yield (0.69%) may deter income-focused investors
MRVL Weaknesses
- Negative profitability metrics: net margin (-15.35%), ROE (-6.59%), ROIC (-3.88%)
- Unfavorable interest coverage (-3.72) raises solvency concerns
- Low asset turnover (0.29) indicates inefficient use of assets
- High WACC (12.39%) raises capital costs
- Low dividend yield (0.21%) and negative earnings impact returns
ASML demonstrates robust profitability and financial health supported by a strong global footprint and diversified products. Marvell faces profitability and solvency challenges but maintains solid liquidity and asset efficiency in fixed assets. These factors highlight divergent strategies and financial positions in their respective markets.
The Moat Duel: Analyzing Competitive Defensibility
A structural moat stands as the sole barrier protecting long-term profits from relentless competitive erosion:
ASML Holding N.V.: Unrivaled Technological Dominance
ASML’s moat centers on cutting-edge lithography technology, yielding a soaring ROIC 24% above WACC and stable margins near 30%. Its expanding EUV systems deepen this edge in 2026.
Marvell Technology, Inc.: Cost and Integration Challenges
Marvell relies on diversified semiconductor solutions but suffers a negative ROIC trend, indicating value destruction. Its broad portfolio contrasts ASML’s focused moat, facing margin pressure and execution risks in 2026.
Verdict: Technological Leadership vs. Fragmented Execution
ASML wields a wider, more durable moat driven by proprietary tech and superior capital efficiency. Marvell’s declining ROIC signals weaker defensibility. ASML remains better equipped to defend and grow market share.
Which stock offers better returns?
The past year shows ASML Holding N.V. surging with strong upward momentum, while Marvell Technology, Inc. posts modest gains followed by recent decline, reflecting contrasting trading dynamics.
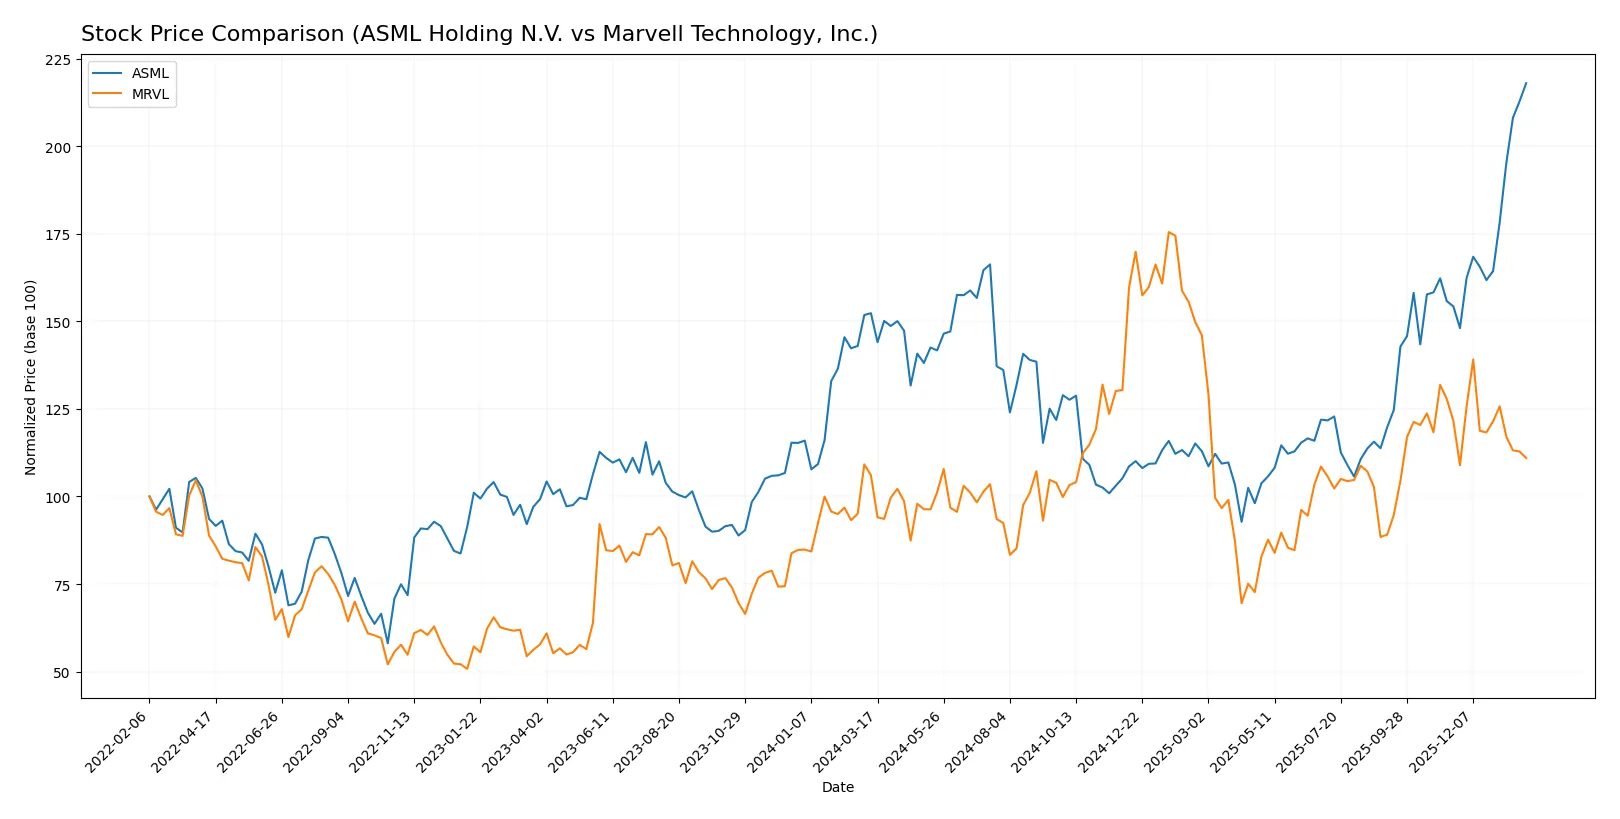
Trend Comparison
ASML Holding N.V. gained 43.11% over the past 12 months, marking a bullish trend with accelerating price growth and a high volatility level of 170.09. It reached a peak at 1423.0 and a low near 605.55.
Marvell Technology, Inc. rose 4.64% over the same period, also bullish but with deceleration and much lower volatility at 16.42. Its recent 2.5-month trend turned bearish, dropping 8.71%.
ASML clearly outperformed Marvell, delivering the highest market returns with sustained acceleration and dominant buyer activity compared to Marvell’s recent price weakness.
Target Prices
Analysts present a broad consensus on target prices for ASML Holding N.V. and Marvell Technology, Inc.
| Company | Target Low | Target High | Consensus |
|---|---|---|---|
| ASML Holding N.V. | 1,150 | 1,911 | 1,458.5 |
| Marvell Technology, Inc. | 80 | 156 | 117 |
ASML’s consensus target price sits slightly above its current 1,423 USD trading price, signaling moderate upside potential. Marvell’s consensus target exceeds its 78.92 USD price, implying significant expected growth.

Don’t Let Luck Decide Your Entry Point
Optimize your entry points with our advanced ProRealTime indicators. You’ll get efficient buy signals with precise price targets for maximum performance. Start outperforming now!
How do institutions grade them?
ASML Holding N.V. Grades
The table below summarizes recent institutional grades for ASML Holding N.V.:
| Grading Company | Action | New Grade | Date |
|---|---|---|---|
| Barclays | Upgrade | Overweight | 2026-01-29 |
| Wells Fargo | Maintain | Overweight | 2026-01-29 |
| RBC Capital | Maintain | Outperform | 2026-01-29 |
| Bernstein | Maintain | Outperform | 2026-01-22 |
| KGI Securities | Upgrade | Outperform | 2026-01-15 |
| Wells Fargo | Maintain | Overweight | 2026-01-15 |
| JP Morgan | Maintain | Overweight | 2026-01-14 |
| Bernstein | Upgrade | Outperform | 2026-01-05 |
| B of A Securities | Maintain | Buy | 2025-12-03 |
| JP Morgan | Maintain | Overweight | 2025-12-01 |
Marvell Technology, Inc. Grades
The following table shows recent institutional grades for Marvell Technology, Inc.:
| Grading Company | Action | New Grade | Date |
|---|---|---|---|
| Rosenblatt | Maintain | Buy | 2026-01-07 |
| Melius Research | Upgrade | Buy | 2026-01-05 |
| Benchmark | Downgrade | Hold | 2025-12-08 |
| Benchmark | Maintain | Buy | 2025-12-03 |
| JP Morgan | Maintain | Overweight | 2025-12-03 |
| Needham | Maintain | Buy | 2025-12-03 |
| Oppenheimer | Maintain | Outperform | 2025-12-03 |
| Rosenblatt | Maintain | Buy | 2025-12-03 |
| Evercore ISI Group | Maintain | Outperform | 2025-12-03 |
| Piper Sandler | Maintain | Overweight | 2025-12-03 |
Which company has the best grades?
ASML Holding N.V. consistently receives upgrades and maintains strong buy and outperform ratings from top-tier institutions. Marvell Technology, Inc. shows solid buy and outperform grades but has a notable recent downgrade to hold. ASML’s stronger consensus may indicate higher institutional confidence.
Risks specific to each company
The following categories identify critical pressure points and systemic threats facing ASML Holding N.V. and Marvell Technology, Inc. in the 2026 market environment:
1. Market & Competition
ASML Holding N.V.
- Dominates advanced lithography with strong moats but faces high valuation pressure.
Marvell Technology, Inc.
- Faces intense competition in diverse semiconductor segments with weaker profitability and margin pressures.
2. Capital Structure & Debt
ASML Holding N.V.
- Low debt-to-equity (0.14) and favorable interest coverage signal strong balance sheet discipline.
Marvell Technology, Inc.
- Higher leverage (0.32) and negative interest coverage indicate elevated financial risk and refinancing challenges.
3. Stock Volatility
ASML Holding N.V.
- Beta at 1.34 suggests moderate market sensitivity typical of large-cap tech leaders.
Marvell Technology, Inc.
- Higher beta of 1.95 shows greater stock price volatility and investor risk exposure.
4. Regulatory & Legal
ASML Holding N.V.
- Operates globally with exposure to export controls but benefits from strong industry positioning.
Marvell Technology, Inc.
- Faces regulatory scrutiny in multiple jurisdictions amid geopolitical tensions and supply chain risks.
5. Supply Chain & Operations
ASML Holding N.V.
- Complex supply chain reliant on advanced materials; high fixed asset turnover indicates operational efficiency.
Marvell Technology, Inc.
- Lower asset turnover and operational scale increase supply chain vulnerability and operational risk.
6. ESG & Climate Transition
ASML Holding N.V.
- Increasing ESG focus with investments in sustainable tech; industry pressure to reduce carbon footprint.
Marvell Technology, Inc.
- ESG initiatives improving but lag behind industry leaders, posing transition risk amid tightening standards.
7. Geopolitical Exposure
ASML Holding N.V.
- Significant exposure to Asia-Pacific and export restrictions risks due to advanced tech exports.
Marvell Technology, Inc.
- Broad geographic footprint with notable exposure to US-China tensions impacting supply and sales.
Which company shows a better risk-adjusted profile?
ASML’s strongest risk is valuation and regulatory pressures, while Marvell’s is financial instability and operational inefficiencies. I see ASML’s risk-adjusted profile as superior, supported by its very strong Altman Z-Score (12.4) and Piotroski score (8) versus Marvell’s weaker financial health. Marvell’s negative net margin (-15.35%) and interest coverage (-3.72) highlight acute financial stress.
Final Verdict: Which stock to choose?
ASML’s superpower lies in its durable competitive advantage, demonstrated by a growing ROIC well above its cost of capital. Its relentless innovation and scale create a formidable moat. A point of vigilance remains its valuation premium, which demands patience. It suits portfolios targeting long-term, aggressive growth through quality leadership.
Marvell Technology’s strategic moat centers on its niche in high-growth semiconductor segments, supported by strong R&D investment. It offers a relative safety cushion with healthier liquidity ratios compared to ASML. This profile fits investors seeking GARP (Growth at a Reasonable Price) opportunities, balancing growth potential with moderate risk.
If you prioritize long-term value creation and can tolerate a premium, ASML outshines with its proven efficiency and expanding profitability. However, if you seek growth with a more balanced risk profile and quicker liquidity, Marvell offers better stability despite its current challenges. Each appeals to distinct investor archetypes based on risk tolerance and growth horizon.
Disclaimer: Investment carries a risk of loss of initial capital. The past performance is not a reliable indicator of future results. Be sure to understand risks before making an investment decision.
Go Further
I encourage you to read the complete analyses of ASML Holding N.V. and Marvell Technology, Inc. to enhance your investment decisions: