Home > Comparison > Technology > ASML vs LSCC
The strategic rivalry between ASML Holding N.V. and Lattice Semiconductor Corporation defines the current trajectory of the semiconductor industry. ASML operates as a capital-intensive equipment systems leader, pioneering advanced lithography technology. In contrast, Lattice focuses on high-margin, flexible programmable logic devices for diversified markets. This analysis explores their contrasting growth and innovation strategies to determine which offers the superior risk-adjusted return for a diversified portfolio in 2026.

Table of contents
Companies Overview
ASML Holding N.V. and Lattice Semiconductor Corporation stand as pivotal players in the semiconductor industry, shaping technology innovation and supply chains worldwide.
ASML Holding N.V.: Advanced Lithography Pioneer
ASML dominates the semiconductor equipment sector with its extreme ultraviolet lithography systems, crucial for chip manufacturing at cutting-edge nodes. Its revenue stems from selling and servicing these high-tech lithography and metrology systems globally. In 2026, ASML emphasizes expanding its computational lithography solutions alongside upgrading existing platforms to sustain leadership in semiconductor production technology.
Lattice Semiconductor Corporation: FPGA Innovator
Lattice Semiconductor focuses on field programmable gate arrays (FPGAs) and specialized video connectivity products, catering to communications, computing, and automotive markets. It generates revenue through product sales and licensing its intellectual property portfolio. In 2026, the company prioritizes enhancing its Certus-NX FPGA family while growing its technology licensing to deepen market penetration and diversify income streams.
Strategic Collision: Similarities & Divergences
Both companies operate within the semiconductor ecosystem but diverge sharply in business models. ASML pursues a high-barrier, capital-intensive equipment approach, while Lattice leans on flexible, software-driven FPGA solutions. Their primary battleground lies in serving chipmakers and OEMs demanding advanced semiconductor functionality. This contrast frames ASML as a capital-heavy innovator and Lattice as a nimble IP-centric player with distinct risk and growth profiles.
Income Statement Comparison
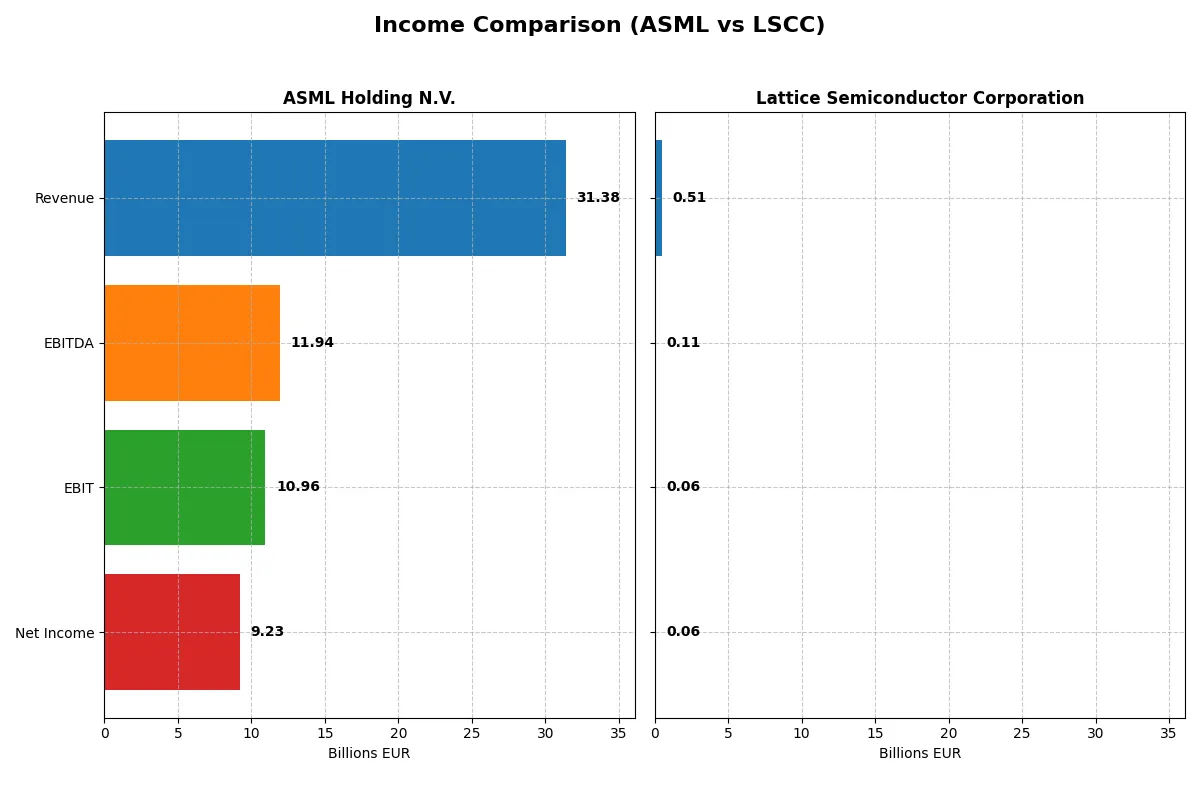
This data dissects the core profitability and scalability of both corporate engines to reveal who dominates the bottom line:
| Metric | ASML Holding N.V. (ASML) | Lattice Semiconductor Corp. (LSCC) |
|---|---|---|
| Revenue | 31.4B EUR | 509M USD |
| Cost of Revenue | 14.8B EUR | 169M USD |
| Operating Expenses | 5.7B EUR | 306M USD |
| Gross Profit | 16.6B EUR | 340M USD |
| EBITDA | 11.9B EUR | 107M USD |
| EBIT | 11.0B EUR | 61M USD |
| Interest Expense | 0 EUR | 0.3M USD |
| Net Income | 9.2B EUR | 61M USD |
| EPS | 23.76 EUR | 0.44 USD |
| Fiscal Year | 2025 | 2024 |
Income Statement Analysis: The Bottom-Line Duel
This income statement comparison reveals which company runs its corporate engine with superior efficiency and profitability over recent years.
ASML Holding N.V. Analysis
ASML’s revenue surged from 18.6B EUR in 2021 to 31.4B EUR in 2025, reflecting a robust 68.6% growth. Net income climbed by 56.9%, reaching 9.2B EUR in 2025. Gross and net margins remain strong at 52.8% and 29.4%, respectively. The latest year shows accelerating EBIT growth of 19%, underscoring operational momentum and disciplined cost control.
Lattice Semiconductor Corporation Analysis
Lattice’s revenue expanded 24.8% over 2020–2024 but dropped sharply by 30.9% in 2024 to 509M USD. Net income followed a similar pattern, peaking above 259M USD in 2023 before plunging to 61M USD in 2024. Despite a high gross margin of 66.8%, net margin contracted to 12%. The latest year reflects a significant loss of momentum with EBIT down 71.7%, signaling operational challenges.
Margin Power vs. Revenue Scale
ASML outpaces Lattice with superior scale, margin consistency, and accelerating profit growth. Its 29.4% net margin dwarfs Lattice’s 12%, while revenue and net income expanded far more rapidly. For investors seeking a high-efficiency, growth-driven profile, ASML’s consistent profitability and operating leverage present a more compelling fundamental foundation.
Financial Ratios Comparison
These vital ratios act as a diagnostic tool to expose the underlying fiscal health, valuation premiums, and capital efficiency of the companies compared below:
| Ratios | ASML Holding N.V. (ASML) | Lattice Semiconductor Corp. (LSCC) |
|---|---|---|
| ROE | 47.1% | 8.6% |
| ROIC | 34.1% | 4.6% |
| P/E | 38.3 | 132.7 |
| P/B | 18.0 | 11.4 |
| Current Ratio | 1.26 | 3.66 |
| Quick Ratio | 0.79 | 2.62 |
| D/E | 0.14 | 0.02 |
| Debt-to-Assets | 5.4% | 1.8% |
| Interest Coverage | 0 (not available) | 130 |
| Asset Turnover | 0.62 | 0.60 |
| Fixed Asset Turnover | 3.81 | 7.62 |
| Payout ratio | 26.5% | 0% |
| Dividend yield | 0.69% | 0% |
| Fiscal Year | 2025 | 2024 |
Efficiency & Valuation Duel: The Vital Signs
Financial ratios serve as a company’s DNA, exposing hidden risks and operational strengths that shape investment outcomes.
ASML Holding N.V.
ASML commands a robust 47.1% ROE and a strong 29.4% net margin, signaling operational excellence. However, its valuation appears stretched with a P/E of 38.3 and P/B of 18.1. The firm returns modest dividends (0.69% yield) while reinvesting heavily in R&D, fueling sustained growth and innovation.
Lattice Semiconductor Corporation
Lattice Semiconductor posts a modest 8.6% ROE and 12.0% net margin, indicating limited profitability. Its valuation is highly stretched, with a P/E soaring at 132.7 and P/B of 11.4. The company pays no dividends, prioritizing R&D and growth investments to build future capabilities amid competitive pressures.
Premium Valuation vs. Operational Safety
ASML offers a superior balance of profitability and capital efficiency despite a high valuation. Lattice’s lofty multiples and weaker returns highlight greater risk. ASML fits investors seeking operational strength; Lattice suits those betting on growth potential with tolerance for valuation risk.
Which one offers the Superior Shareholder Reward?
I compare ASML Holding N.V. and Lattice Semiconductor Corporation by their shareholder return policies. ASML pays dividends with a 0.97% yield and a moderate 34% payout ratio, supported by strong free cash flow coverage (3.07x). It also runs steady buybacks, enhancing total returns sustainably. LSCC pays no dividends but aggressively reinvests in growth and R&D, with no payout ratio and a lean capex of $0.15/share. LSCC’s buyback activity is minimal, reflecting its focus on expansion over immediate shareholder distributions. Given ASML’s balanced dividend, reliable cash flow, and consistent buybacks, I judge ASML offers a more attractive and sustainable total return profile for 2026 investors.
Comparative Score Analysis: The Strategic Profile
The radar chart reveals the fundamental DNA and trade-offs of ASML Holding N.V. and Lattice Semiconductor Corporation:
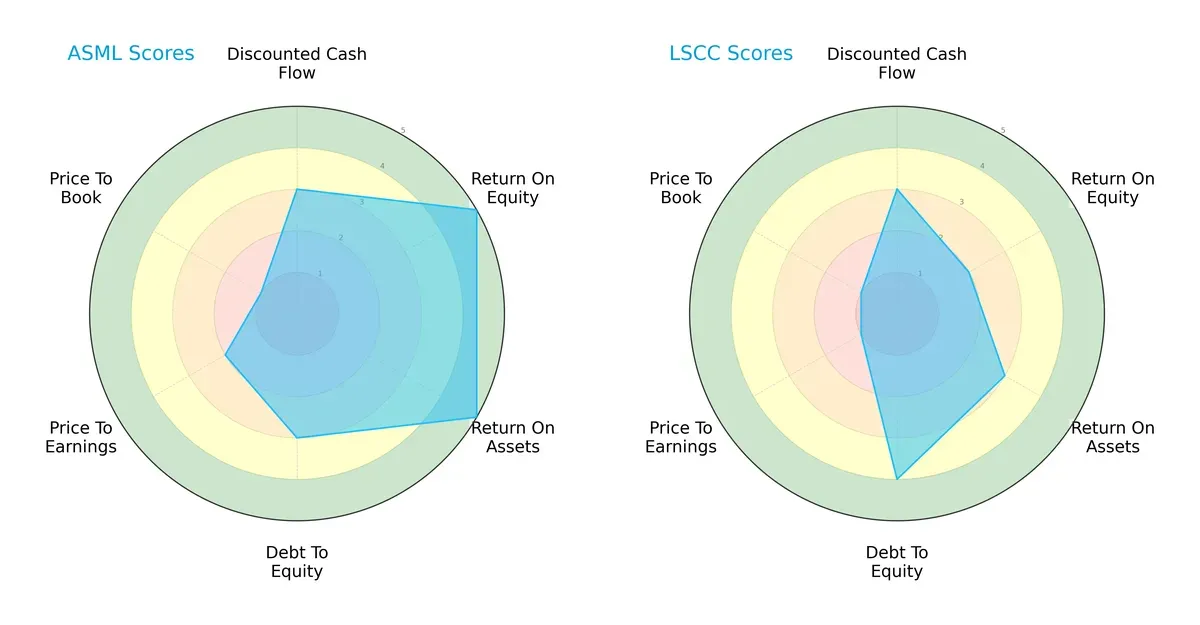
ASML shows a more balanced and robust profile with top-tier ROE and ROA scores (5 each), indicating excellent capital efficiency and asset utilization. LSCC, by contrast, leans on a stronger debt management score (4) but lags in profitability metrics (ROE 2, ROA 3). Both hold moderate DCF scores (3), but ASML is penalized by valuation concerns (P/E 2, P/B 1), signaling premium pricing. Overall, ASML’s strengths in profitability outweigh LSCC’s leverage advantage.
Bankruptcy Risk: Solvency Showdown
ASML’s Altman Z-Score of 12.4 versus LSCC’s extraordinary 51.8 signals both firms lie well within the safe zone:
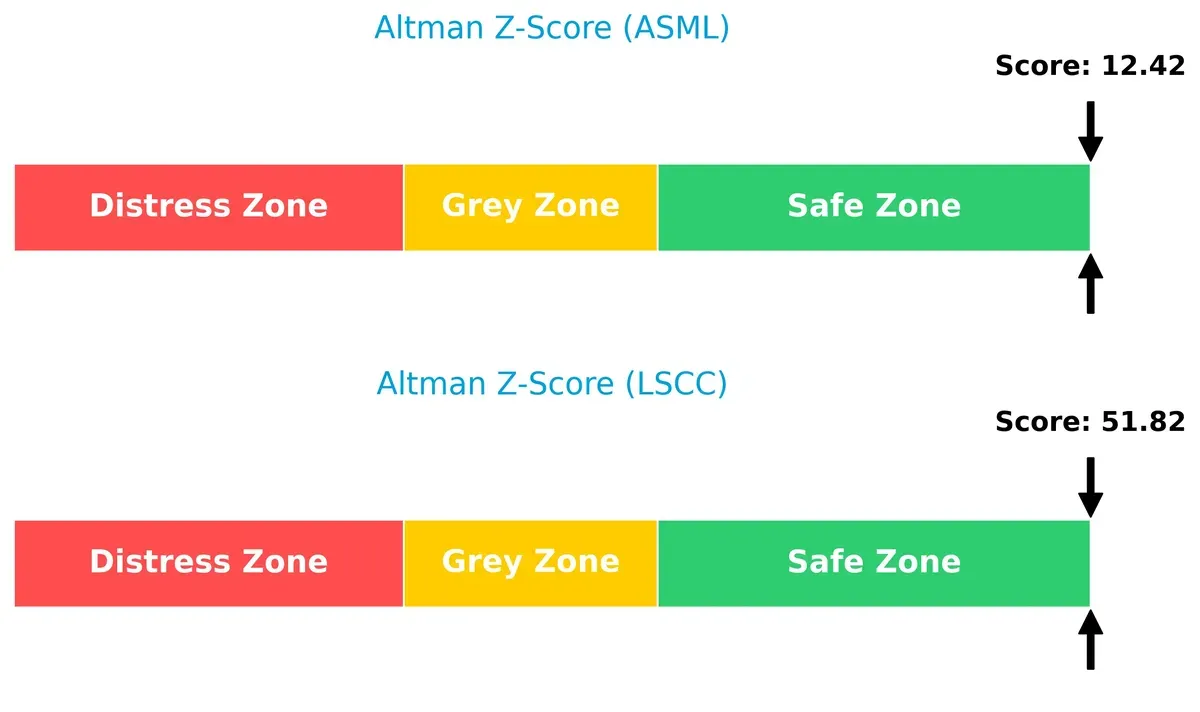
These high scores reflect exceptional financial resilience in this late-cycle environment. LSCC’s extremely elevated score suggests an unusually strong buffer against bankruptcy risk, while ASML remains solidly stable, supporting long-term survival.
Financial Health: Quality of Operations
ASML’s Piotroski F-Score of 8 versus LSCC’s 5 highlights a clear gap in operational quality:
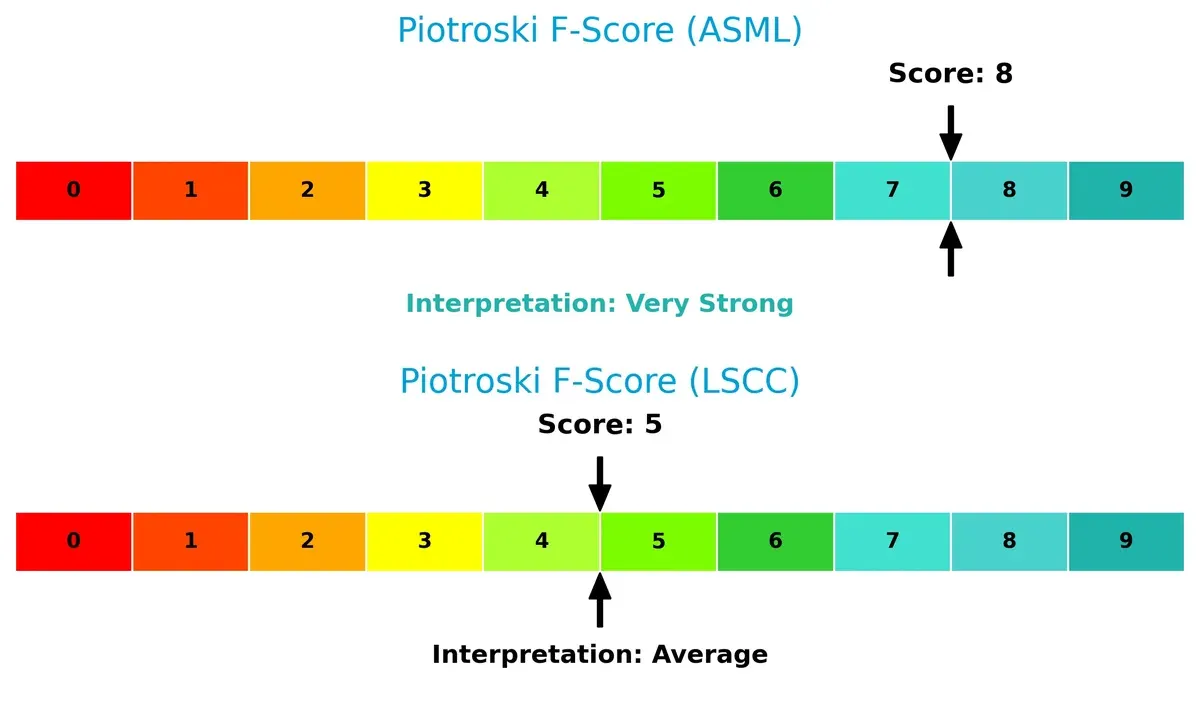
ASML exhibits very strong internal financial health, signaling robust profitability and efficient capital structuring. LSCC’s average score raises caution about weaker fundamentals and operational risks compared to ASML’s peak condition. Investors should weigh these differences carefully.
How are the two companies positioned?
This section dissects the operational DNA of ASML and LSCC by comparing their revenue distribution by segment and internal dynamics, including strengths and weaknesses. The final objective confronts their economic moats to identify which business model offers the most resilient and sustainable competitive advantage in today’s market landscape.
Revenue Segmentation: The Strategic Mix
The following visual comparison dissects how ASML Holding N.V. and Lattice Semiconductor Corporation diversify their income streams and where their primary sector bets lie:
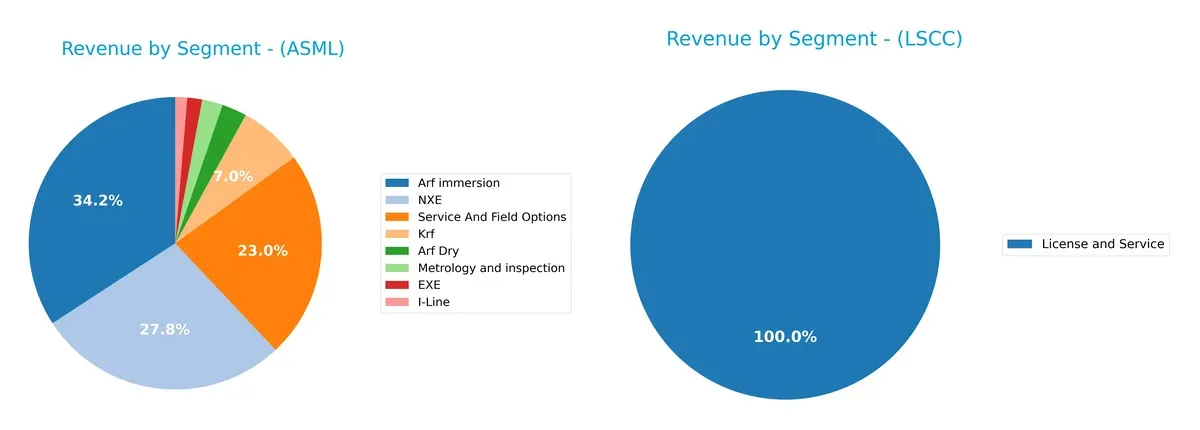
ASML shows a diversified revenue mix anchored by Arf immersion at $9.67B and NXE at $7.86B, while services contribute $6.49B. Lattice relies heavily on product revenue from distributors at $332M, dwarfing its license and service segment at $17M. ASML’s broad portfolio mitigates concentration risk and leverages ecosystem lock-in, whereas Lattice’s focus on distribution channels signals infrastructure reliance and potential vulnerability to market shifts.
Strengths and Weaknesses Comparison
This table compares the strengths and weaknesses of ASML Holding N.V. and Lattice Semiconductor Corporation:
ASML Strengths
- High profitability with 29.42% net margin and 47.08% ROE
- Favorable leverage with low debt-to-assets at 5.36%
- Strong global footprint, notably in China and Korea
- Innovation leadership with diverse product lines including EUV lithography
- Efficient capital use reflected in 34.14% ROIC
LSCC Strengths
- Favorable quick ratio of 2.62 indicating liquidity strength
- Very low debt-to-assets at 1.81% and strong interest coverage
- High fixed asset turnover at 7.62 supports operational efficiency
- Presence in Americas, Asia, and Europe diversifies revenue sources
ASML Weaknesses
- High valuation multiples with P/E at 38.33 and P/B at 18.05
- Quick ratio below 1 at 0.79 signals potential short-term liquidity issues
- WACC at 10.08% exceeds ROIC, raising capital cost concerns
- Dividend yield low at 0.69%, possibly limiting income investors
LSCC Weaknesses
- Low profitability with 8.6% ROE and 4.59% ROIC below WACC of 11.88%
- Elevated P/E of 132.74 and P/B of 11.41 indicate overvaluation risk
- Current ratio very high at 3.66, possibly reflecting inefficient asset use
- No dividend yield reduces appeal for income-focused investors
Both companies show clear competitive strengths but face distinct challenges. ASML’s high profitability and innovation offset liquidity and valuation concerns. LSCC benefits from strong liquidity and low leverage but struggles with profitability and valuation risks. These contrasts reflect differing strategic priorities and market positions in the semiconductor industry.
The Moat Duel: Analyzing Competitive Defensibility
A structural moat shields long-term profits from relentless competition erosion. The strength and durability of this moat determine market dominance:
ASML Holding N.V.: Technological Barrier & Scale Advantage
ASML’s moat stems from rare, advanced lithography systems with immense switching costs. Its 24% ROIC above WACC confirms value creation. New EUV tech and expanding semiconductor demand deepen this moat in 2026.
Lattice Semiconductor Corporation: Niche IP & Product Differentiation
Lattice relies on specialized field programmable gate arrays and IP licensing, but its ROIC is negative and shrinking, signaling value destruction. Market volatility and intensifying rivals threaten its competitive edge in 2026.
Verdict: High-Tech Scale vs. Niche Innovation Sustainability
ASML’s wider and growing moat outpaces Lattice’s eroding advantage. Its technological barriers and capital efficiency better defend market share against evolving competitive pressures.
Which stock offers better returns?
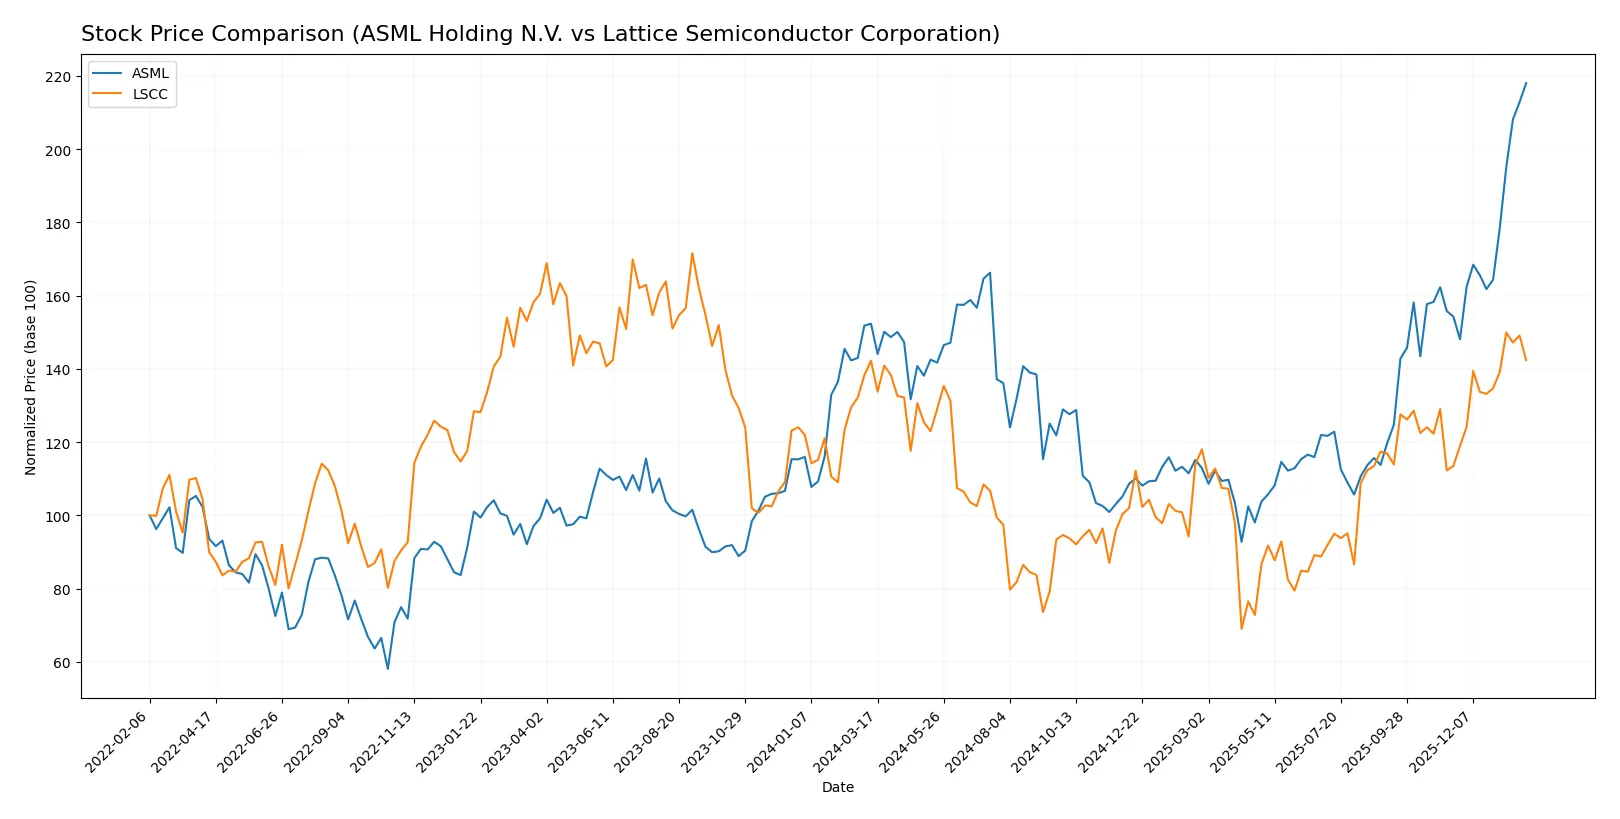
Over the past year, ASML Holding N.V. and Lattice Semiconductor Corporation displayed differing price dynamics, with ASML showing strong gains and higher volatility compared to LSCC’s flat overall movement.
Trend Comparison
ASML Holding N.V. recorded a 43.11% price increase over the past 12 months, indicating a bullish trend with accelerating momentum and high volatility, reaching a peak of 1423.
Lattice Semiconductor Corporation showed a marginal 0.09% price increase over the same period, technically bullish but essentially neutral, with very low volatility and modest acceleration.
Comparing both, ASML clearly delivered the highest market performance, outperforming LSCC significantly in price appreciation and trend strength.
Target Prices
Analysts present a clear consensus on target prices for ASML Holding N.V. and Lattice Semiconductor Corporation.
| Company | Target Low | Target High | Consensus |
|---|---|---|---|
| ASML Holding N.V. | 1,150 | 1,911 | 1,458.5 |
| Lattice Semiconductor Corporation | 65 | 105 | 84.67 |
ASML’s consensus target of 1,458.5 slightly exceeds its current price of 1,423, indicating moderate upside potential. Lattice’s target consensus at 84.67 is close to its current price of 80.52, reflecting cautious optimism among analysts.

Don’t Let Luck Decide Your Entry Point
Optimize your entry points with our advanced ProRealTime indicators. You’ll get efficient buy signals with precise price targets for maximum performance. Start outperforming now!
How do institutions grade them?
ASML Holding N.V. Grades
The table below shows recent institutional grades for ASML Holding N.V.:
| Grading Company | Action | New Grade | Date |
|---|---|---|---|
| Barclays | Upgrade | Overweight | 2026-01-29 |
| Wells Fargo | Maintain | Overweight | 2026-01-29 |
| RBC Capital | Maintain | Outperform | 2026-01-29 |
| Bernstein | Maintain | Outperform | 2026-01-22 |
| KGI Securities | Upgrade | Outperform | 2026-01-15 |
| Wells Fargo | Maintain | Overweight | 2026-01-15 |
| JP Morgan | Maintain | Overweight | 2026-01-14 |
| Bernstein | Upgrade | Outperform | 2026-01-05 |
| B of A Securities | Maintain | Buy | 2025-12-03 |
| JP Morgan | Maintain | Overweight | 2025-12-01 |
Lattice Semiconductor Corporation Grades
The table below shows recent institutional grades for Lattice Semiconductor Corporation:
| Grading Company | Action | New Grade | Date |
|---|---|---|---|
| Susquehanna | Maintain | Positive | 2026-01-22 |
| Keybanc | Maintain | Overweight | 2026-01-13 |
| Needham | Maintain | Buy | 2025-11-04 |
| Benchmark | Maintain | Buy | 2025-11-04 |
| Stifel | Maintain | Buy | 2025-11-04 |
| Baird | Maintain | Outperform | 2025-11-04 |
| Rosenblatt | Maintain | Buy | 2025-11-04 |
| Susquehanna | Maintain | Positive | 2025-10-22 |
| Keybanc | Maintain | Overweight | 2025-09-30 |
| Needham | Maintain | Buy | 2025-09-22 |
Which company has the best grades?
ASML Holding N.V. consistently receives top-tier grades such as Overweight and Outperform from major institutions. Lattice Semiconductor maintains strong Buy and Outperform ratings but with fewer upgrades. Investors may see ASML’s recent upgrades as a signal of growing confidence.
Risks specific to each company
The following categories identify critical pressure points and systemic threats facing ASML Holding N.V. and Lattice Semiconductor Corporation in the 2026 market environment:
1. Market & Competition
ASML Holding N.V.
- Dominates with advanced lithography tech but faces high R&D pressure and premium pricing risks.
Lattice Semiconductor Corporation
- Competes in niche FPGA markets with higher beta, facing stiff competition and less pricing power.
2. Capital Structure & Debt
ASML Holding N.V.
- Maintains low debt-to-equity (0.14) and strong interest coverage, signaling solid financial stability.
Lattice Semiconductor Corporation
- Extremely low leverage (0.02 D/E) and very high interest coverage, reflecting conservative capital structure.
3. Stock Volatility
ASML Holding N.V.
- Beta of 1.34 indicates moderate volatility, aligned with semiconductor industry norms.
Lattice Semiconductor Corporation
- Higher beta at 1.72, exposing investors to amplified market swings and greater equity risk.
4. Regulatory & Legal
ASML Holding N.V.
- Faces stringent international export controls, especially concerning EUV technology and China market.
Lattice Semiconductor Corporation
- Subject to US regulatory scrutiny but less exposed to complex global trade restrictions.
5. Supply Chain & Operations
ASML Holding N.V.
- Complex global supply chain with reliance on specialized equipment suppliers poses operational risks.
Lattice Semiconductor Corporation
- Leaner operations and smaller scale reduce complexity but increase vulnerability to supplier disruptions.
6. ESG & Climate Transition
ASML Holding N.V.
- Leading efforts on sustainable manufacturing; ESG compliance critical due to EU and global standards.
Lattice Semiconductor Corporation
- ESG efforts are emerging but less mature, potentially risking investor scrutiny and regulatory compliance.
7. Geopolitical Exposure
ASML Holding N.V.
- High exposure to Asia-Pacific tensions due to sales in China, South Korea, and Taiwan.
Lattice Semiconductor Corporation
- Primarily US-based with global sales, geopolitical risks exist but less concentrated in high-tension zones.
Which company shows a better risk-adjusted profile?
ASML’s dominant market position and strong capital structure afford it a more balanced risk profile despite geopolitical and supply chain threats. LSCC’s higher volatility, weaker profitability metrics, and emerging ESG stance increase its risk burden. ASML’s controlled leverage and strong Piotroski score contrast with LSCC’s wider volatility and moderate financial health, favoring ASML for risk-conscious investors. Notably, ASML’s Altman Z-score of 12.4 confirms its robust financial safety, whereas LSCC’s higher beta and lower ROIC highlight elevated operational risks.
Final Verdict: Which stock to choose?
ASML’s superpower lies in its durable competitive advantage fueled by a consistently high ROIC well above its WACC. It generates robust free cash flow with operational efficiency that few in the semiconductor equipment sector can match. A point of vigilance is its elevated valuations, which may pressure returns in volatile markets. It fits best in aggressive growth portfolios seeking long-term value creation.
Lattice Semiconductor boasts a strategic moat centered on niche semiconductor design with recurring R&D innovation. Compared to ASML, it offers greater balance sheet liquidity and lower leverage, appealing to investors valuing financial safety. However, its profitability and capital efficiency trail industry leaders, making it more suited for growth-at-a-reasonable-price (GARP) portfolios focused on turnaround potential.
If you prioritize durable value creation backed by a proven moat and operational excellence, ASML outshines with superior profitability and cash generation. However, if you seek a more conservative growth play with stronger liquidity and less reliance on market exuberance, Lattice Semiconductor offers better stability despite weaker returns. Each represents a distinct analytical scenario tailored to different investor risk appetites and strategic goals.
Disclaimer: Investment carries a risk of loss of initial capital. The past performance is not a reliable indicator of future results. Be sure to understand risks before making an investment decision.
Go Further
I encourage you to read the complete analyses of ASML Holding N.V. and Lattice Semiconductor Corporation to enhance your investment decisions: