Home > Comparison > Technology > ASML vs LRCX
The strategic rivalry between ASML Holding N.V. and Lam Research Corporation shapes the semiconductor equipment industry’s future. ASML operates as a capital-intensive leader in advanced lithography systems, while Lam Research excels as a specialized provider of wafer fabrication equipment. This head-to-head contrasts scale and technological innovation against focused operational expertise. This analysis aims to identify which company presents the superior risk-adjusted return potential for a diversified portfolio in the evolving technology sector.
Table of contents
Companies Overview
ASML Holding N.V. and Lam Research Corporation are pivotal players shaping the semiconductor equipment landscape worldwide.
ASML Holding N.V.: The Lithography Powerhouse
ASML commands the semiconductor equipment market with its advanced lithography systems, crucial for chipmakers pushing technology nodes forward. Its revenue stems primarily from selling extreme ultraviolet and deep ultraviolet lithography machines. In 2026, ASML continues to focus on enhancing computational lithography and system upgrades to maintain its technological edge and customer support excellence.
Lam Research Corporation: Semiconductor Process Innovator
Lam Research leads in semiconductor processing equipment, generating revenue by designing and servicing specialized systems for etch, deposition, and wafer cleaning. Its 2026 strategy emphasizes expanding product lines like ALTUS and VECTOR while refining precision in wafer fabrication to meet evolving chip complexity and yield demands.
Strategic Collision: Similarities & Divergences
Both firms underpin semiconductor fabrication but diverge sharply: ASML thrives on highly specialized lithography, while Lam Research excels in versatile wafer processing tools. They compete primarily on innovation enabling smaller, more efficient chips. ASML’s dominant market position contrasts Lam’s broader product diversity, defining distinct risk and growth profiles for investors.
Income Statement Comparison
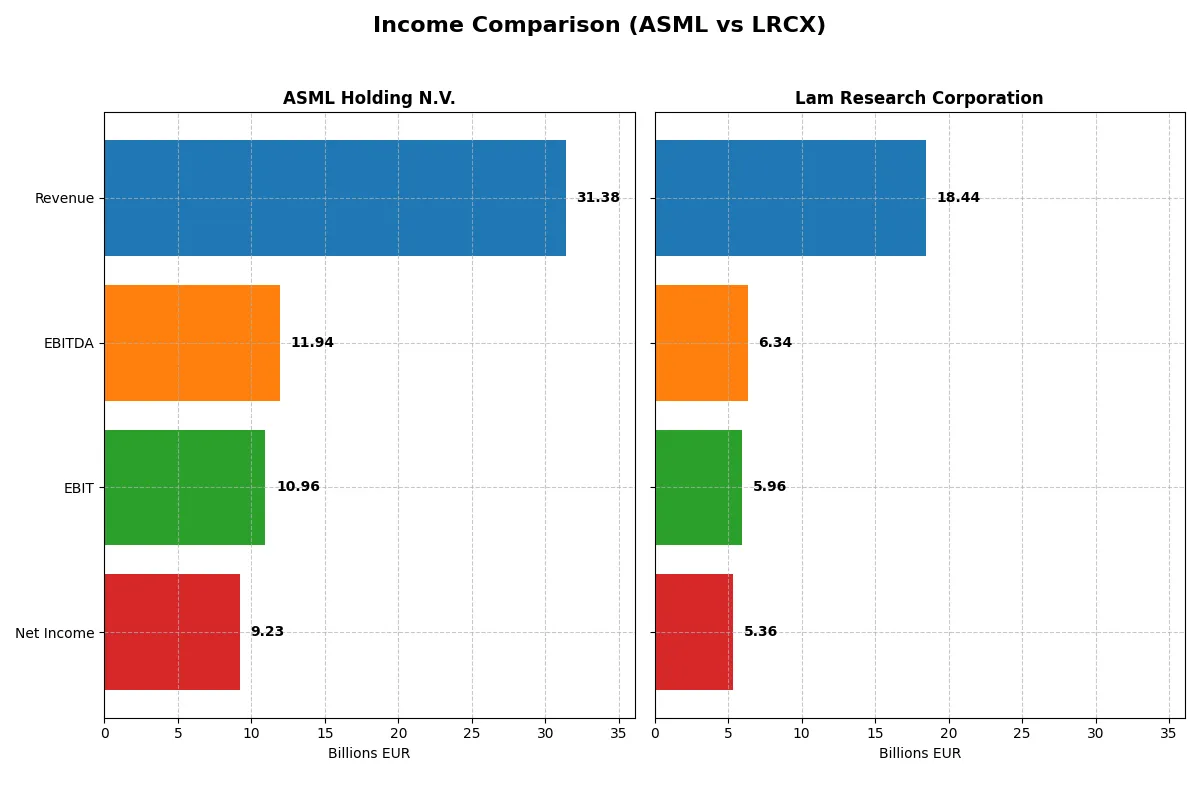
This data dissects the core profitability and scalability of both corporate engines to reveal who dominates the bottom line:
| Metric | ASML Holding N.V. (ASML) | Lam Research Corporation (LRCX) |
|---|---|---|
| Revenue | 31.4B EUR | 18.4B USD |
| Cost of Revenue | 14.8B EUR | 9.5B USD |
| Operating Expenses | 5.7B EUR | 3.1B USD |
| Gross Profit | 16.6B EUR | 9.0B USD |
| EBITDA | 11.9B EUR | 6.3B USD |
| EBIT | 11.0B EUR | 6.0B USD |
| Interest Expense | 0 | 178M USD |
| Net Income | 9.2B EUR | 5.4B USD |
| EPS | 23.76 EUR | 4.17 USD |
| Fiscal Year | 2025 | 2025 |
Income Statement Analysis: The Bottom-Line Duel
This income statement comparison reveals the true operational efficiency and profitability momentum of ASML Holding N.V. and Lam Research Corporation.
ASML Holding N.V. Analysis
ASML’s revenue climbed from €18.6B in 2021 to €31.4B in 2025, reflecting a robust 68.6% growth over five years. Net income surged from €5.9B to €9.2B, with net margins holding strong near 29.4%. The 2025 fiscal year showed favorable margin expansion and efficient cost control, underpinning a healthy 23.3% EPS growth.
Lam Research Corporation Analysis
Lam Research grew revenue by 26% from $14.6B in 2021 to $18.4B in 2025. Net income rose from $3.9B to $5.4B, maintaining a solid 29.1% net margin. The latest year posted aggressive top-line and bottom-line growth, with a 43.1% jump in EPS reflecting improved operational leverage and expanding profitability.
Margin Strength vs. Growth Trajectory
ASML dominates in scale and absolute profit, delivering nearly triple Lam’s net income with superior gross and EBIT margins. However, Lam’s faster recent revenue and earnings growth signal dynamic momentum. For investors, ASML offers a powerful profit engine with steady margin quality, while Lam presents a compelling growth profile benefiting from operational efficiency gains.
Financial Ratios Comparison
These vital ratios act as a diagnostic tool to expose the underlying fiscal health, valuation premiums, and capital efficiency of the companies:
| Ratios | ASML Holding N.V. (ASML) | Lam Research Corporation (LRCX) |
|---|---|---|
| ROE | 47.08% | 54.33% |
| ROIC | 34.14% | 34.00% |
| P/E | 38.33 | 23.36 |
| P/B | 18.05 | 12.69 |
| Current Ratio | 1.26 | 2.21 |
| Quick Ratio | 0.79 | 1.55 |
| D/E | 0.14 | 0.48 |
| Debt-to-Assets | 5.36% | 22.28% |
| Interest Coverage | N/A | 33.11 |
| Asset Turnover | 0.62 | 0.86 |
| Fixed Asset Turnover | 3.81 | 7.59 |
| Payout ratio | 26.54% | 21.45% |
| Dividend yield | 0.69% | 0.92% |
| Fiscal Year | 2025 | 2025 |
Efficiency & Valuation Duel: The Vital Signs
Ratios act as a company’s DNA, exposing hidden risks and showcasing operational excellence crucial for investment decisions.
ASML Holding N.V.
ASML delivers strong profitability with a 47.08% ROE and a net margin of 29.42%, reflecting operational efficiency. Despite a high P/E of 38.33 and P/B of 18.05, the stock appears stretched. Shareholder returns are modest, with a low dividend yield of 0.69%, signaling a reinvestment focus on R&D and long-term growth.
Lam Research Corporation
Lam Research posts a robust 54.33% ROE and a 29.06% net margin, indicating excellent profitability. Its valuation is more attractive, with a P/E of 23.36 and P/B of 12.69, suggesting fair pricing relative to peers. The company supports shareholders with a 0.92% dividend yield, balancing returns with sustained growth investments.
Premium Valuation vs. Operational Safety
Lam Research offers a better balance of risk and reward with strong profitability and fair valuation. ASML’s premium multiples reflect high growth expectations but introduce valuation risk. Investors seeking operational stability at a reasonable price may prefer Lam’s profile.
Which one offers the Superior Shareholder Reward?
I see ASML and Lam Research both pay dividends with solid yields around 0.7–1.0%. ASML’s payout ratio hovers near 27–34%, slightly higher than Lam’s 18–27%, signaling more generous cash returns. ASML’s buyback intensity appears stronger, reflecting in its premium valuation multiples. Lam Research maintains a conservative payout with robust free cash flow reinvestment into capex and R&D, supporting sustainable growth. I favor ASML for total shareholder return in 2026 due to its balanced dividend, aggressive buybacks, and robust free cash flow coverage, which historically support superior capital allocation in semiconductors. However, Lam offers a safer margin with lower financial leverage and higher current ratios, appealing to risk-averse investors.
Comparative Score Analysis: The Strategic Profile
The radar chart reveals the fundamental DNA and trade-offs of ASML Holding N.V. and Lam Research Corporation, highlighting their strategic strengths and weaknesses:
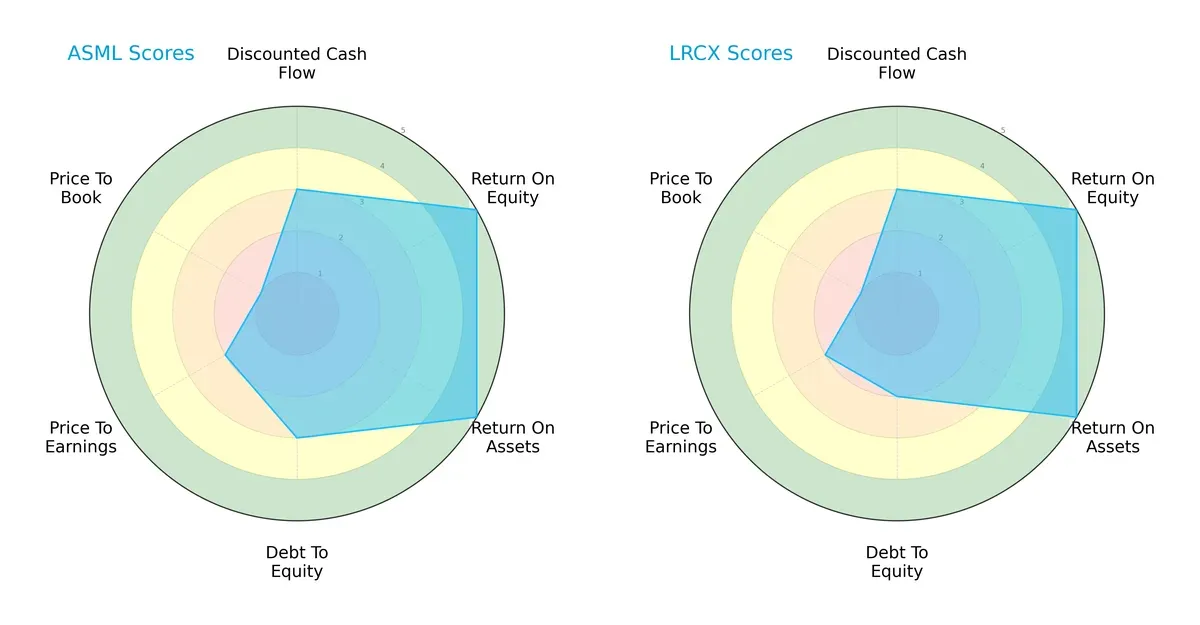
Both companies share very favorable returns on equity (ROE) and assets (ROA) at top scores of 5, demonstrating operational excellence. ASML carries a moderate debt-to-equity score of 3, indicating slightly higher leverage than Lam Research’s more conservative 2. Valuation scores (P/E and P/B) are weak for both, with neither offering clear undervaluation, but ASML’s price-to-book score is particularly unfavorable. Overall, ASML’s profile relies more on operational efficiency, while Lam Research exhibits a more balanced financial structure.
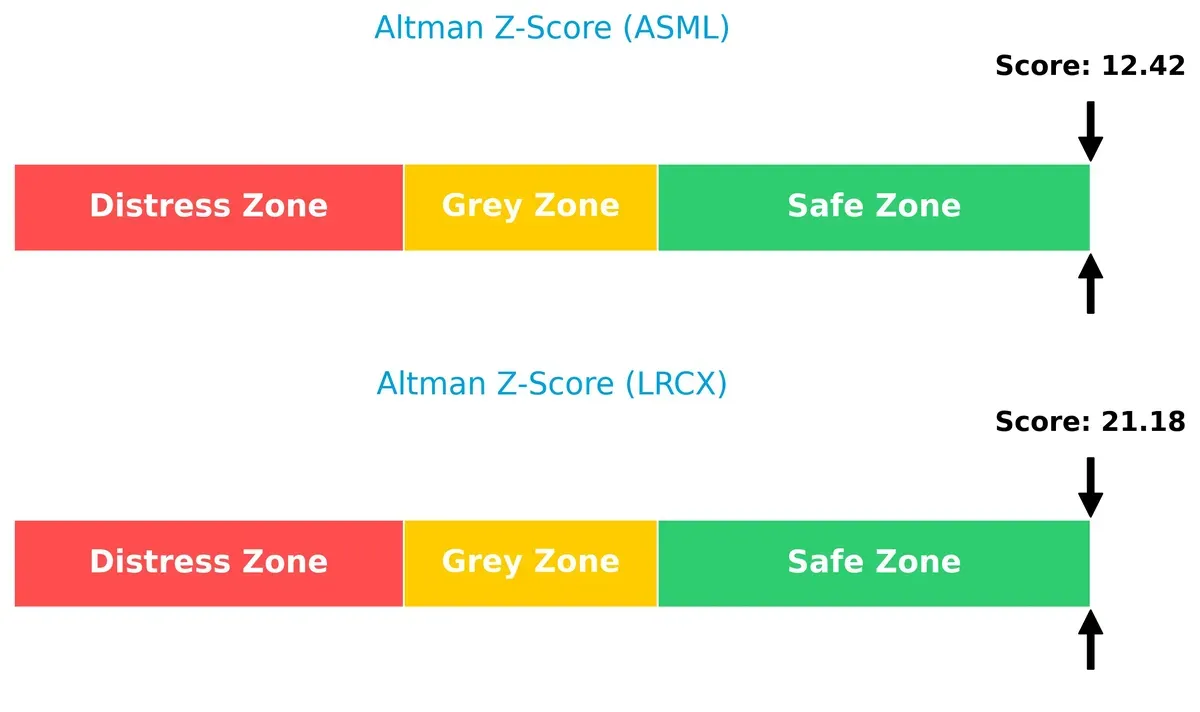
Bankruptcy Risk: Solvency Showdown
ASML’s Altman Z-Score stands at 12.4 versus Lam Research’s 21.2, both well within the safe zone, signaling robust solvency and very low bankruptcy risk in this cycle:
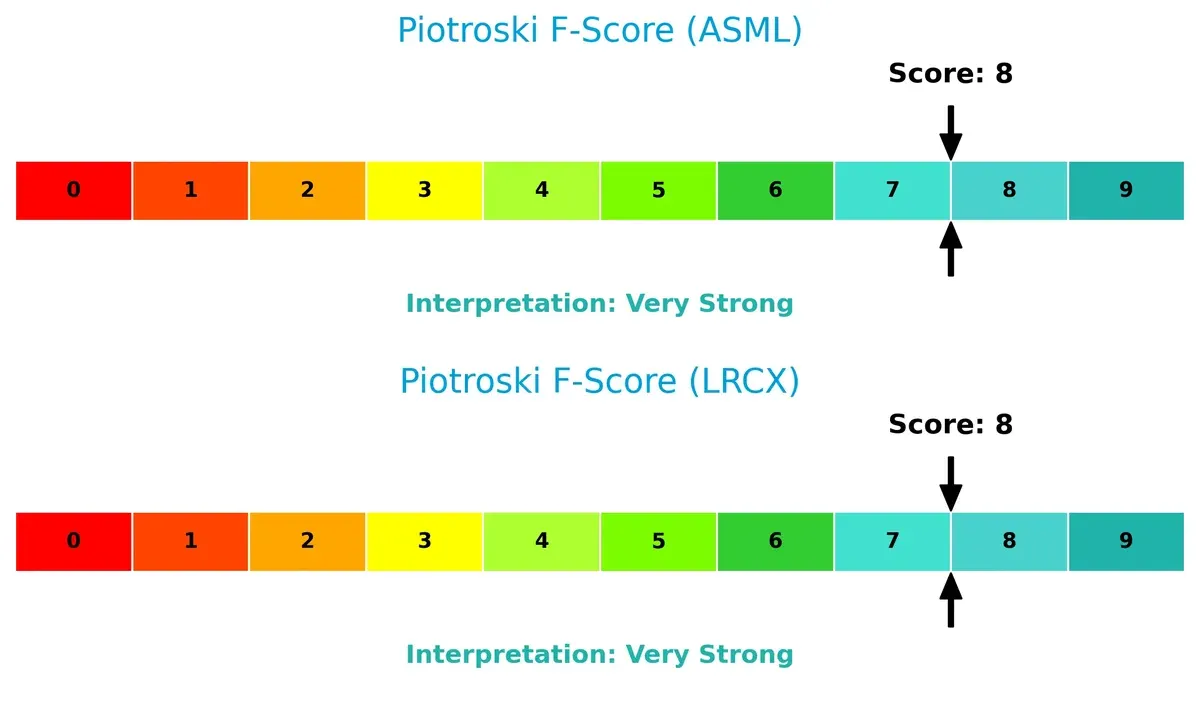
Financial Health: Quality of Operations
Both firms score an 8 on the Piotroski F-Score, reflecting very strong financial health. Neither shows red flags in profitability, leverage, or liquidity, confirming solid internal fundamentals:
How are the two companies positioned?
This section dissects the operational DNA of ASML and LRCX by comparing their revenue distribution and internal dynamics. The goal: to confront their economic moats and identify which model offers the most resilient competitive advantage today.
Revenue Segmentation: The Strategic Mix
This visual comparison dissects how ASML Holding N.V. and Lam Research Corporation diversify their income streams and where their primary sector bets lie:
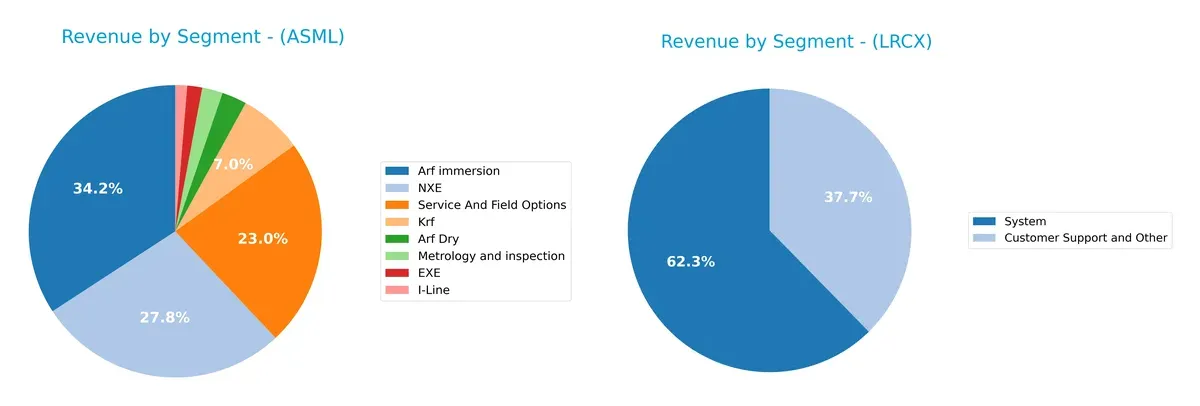
ASML anchors revenue in “Arf immersion” (9.67B) and “NXE” (7.86B), with strong “Service And Field Options” (6.49B), showing a diversified high-tech product and service mix. Lam Research pivots heavily on “System” sales (11.5B) but balances with substantial “Customer Support and Other” revenue (6.94B). ASML’s broad portfolio reduces concentration risk, while Lam’s reliance on core systems sales exposes it to cyclical semiconductor capex swings.
Strengths and Weaknesses Comparison
This table compares the Strengths and Weaknesses of ASML Holding N.V. and Lam Research Corporation:
ASML Strengths
- Strong profitability with 29.42% net margin and 47.08% ROE
- Low debt levels with 0.14 debt-to-equity and 5.36% debt-to-assets
- Favorable interest coverage showing strong solvency
- Diversified product portfolio including advanced EUV and services
- Significant global presence with major sales in China, Korea, and Taiwan
LRCX Strengths
- Robust profitability with 29.06% net margin and 54.33% ROE
- Strong liquidity ratios: 2.21 current ratio and 1.55 quick ratio
- High fixed asset turnover of 7.59 indicating efficient capital use
- Diversified revenue across systems and customer support
- Broad geographic reach with substantial sales in China, Korea, and Taiwan
ASML Weaknesses
- High valuation multiples with P/E at 38.33 and P/B at 18.05
- Quick ratio at 0.79 signals weaker short-term liquidity
- WACC of 10.08% above optimal levels
- Dividend yield low at 0.69%
- Moderate asset turnover at 0.62 suggests room for efficiency gains
LRCX Weaknesses
- Elevated WACC at 12.05% may increase capital costs
- P/B ratio at 12.69 remains high relative to sector norms
- Dividend yield low at 0.92%
- Asset turnover neutral at 0.86, indicating average asset utilization
Both companies exhibit strong profitability and global market penetration, though ASML shows slightly more conservative leverage and capital efficiency. Lam Research excels in liquidity and asset turnover but faces higher capital costs. Each must balance valuation and operational efficiency in their strategic execution.
The Moat Duel: Analyzing Competitive Defensibility
A structural moat is the only reliable barrier protecting long-term profits from relentless competitive erosion. Here’s how ASML and Lam Research defend their turf:
ASML Holding N.V.: Technological Intangibles and Network Effects
ASML’s moat lies in its proprietary extreme ultraviolet lithography technology and deep customer integration. Its 25% ROIC premium over WACC reflects exceptional capital efficiency and margin stability. Continued innovation in EUV and expansion in Asia could deepen this moat in 2026.
Lam Research Corporation: Operational Excellence and Cost Advantage
Lam’s moat stems from its broad process technology portfolio and scale-driven cost advantages, contrasting ASML’s tech focus. Its 22% ROIC premium over WACC confirms robust value creation. Growth in advanced wafer processing and emerging markets offers further moat expansion potential.
Technological Intangibles vs. Cost Leadership: The Competitive Moat Face-Off
Both companies hold very favorable moats with growing ROICs, but ASML’s unique EUV technology and network effects create a wider, more durable moat. I see ASML better positioned to defend and expand its market share under intensifying competition.
Which stock offers better returns?
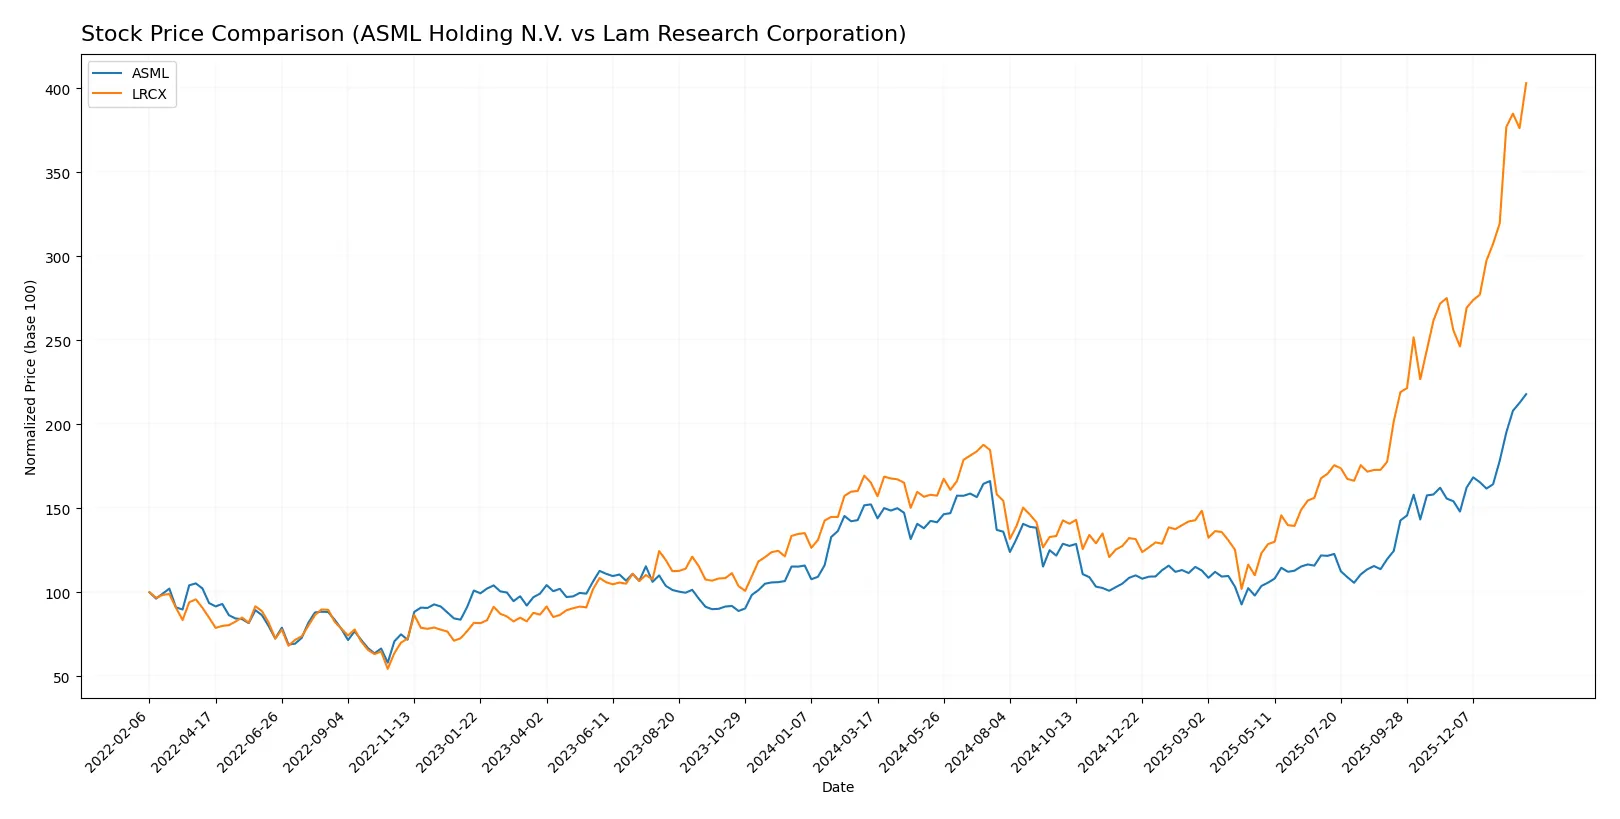
Over the past year, ASML Holding N.V. and Lam Research Corporation both posted significant price gains, with Lam Research showing a more pronounced upward trajectory and stronger buyer dominance.
Trend Comparison
ASML Holding N.V. gained 43.11% over the past 12 months, reflecting a bullish trend with accelerating momentum and a high price range between 605.55 and 1423.0. Buyer dominance increased recently to 68.72%.
Lam Research Corporation surged 144.03% over the same period, exhibiting a strong bullish trend with acceleration and lower volatility. Recent buyer dominance was even stronger at 75.38%, supporting sustained upward pressure.
Lam Research outperformed ASML by a wide margin in terms of price appreciation and buyer activity, delivering the highest market returns in this 12-month span.
Target Prices
The consensus target prices reflect a cautiously optimistic view from analysts for ASML Holding N.V. and Lam Research Corporation.
| Company | Target Low | Target High | Consensus |
|---|---|---|---|
| ASML Holding N.V. | 1150 | 1911 | 1458.5 |
| Lam Research Corporation | 127 | 325 | 266.76 |
Analysts expect ASML’s stock to modestly appreciate from its current 1423 USD, while Lam Research shows stronger upside potential relative to its current 233 USD price.

Don’t Let Luck Decide Your Entry Point
Optimize your entry points with our advanced ProRealTime indicators. You’ll get efficient buy signals with precise price targets for maximum performance. Start outperforming now!
How do institutions grade them?
ASML Holding N.V. Grades
The following table summarizes recent grades from reputable financial institutions for ASML Holding N.V.:
| Grading Company | Action | New Grade | Date |
|---|---|---|---|
| Barclays | Upgrade | Overweight | 2026-01-29 |
| Wells Fargo | Maintain | Overweight | 2026-01-29 |
| RBC Capital | Maintain | Outperform | 2026-01-29 |
| Bernstein | Maintain | Outperform | 2026-01-22 |
| KGI Securities | Upgrade | Outperform | 2026-01-15 |
| Wells Fargo | Maintain | Overweight | 2026-01-15 |
| JP Morgan | Maintain | Overweight | 2026-01-14 |
| Bernstein | Upgrade | Outperform | 2026-01-05 |
| B of A Securities | Maintain | Buy | 2025-12-03 |
| JP Morgan | Maintain | Overweight | 2025-12-01 |
Lam Research Corporation Grades
Below is a detailed summary of recent grades from established grading firms for Lam Research Corporation:
| Grading Company | Action | New Grade | Date |
|---|---|---|---|
| Susquehanna | Maintain | Positive | 2026-01-29 |
| Citigroup | Maintain | Buy | 2026-01-29 |
| RBC Capital | Maintain | Outperform | 2026-01-29 |
| Needham | Maintain | Buy | 2026-01-29 |
| UBS | Maintain | Buy | 2026-01-29 |
| Cantor Fitzgerald | Maintain | Overweight | 2026-01-29 |
| Goldman Sachs | Maintain | Buy | 2026-01-29 |
| Morgan Stanley | Maintain | Equal Weight | 2026-01-29 |
| Wells Fargo | Maintain | Overweight | 2026-01-29 |
| Stifel | Maintain | Buy | 2026-01-29 |
Which company has the best grades?
ASML Holding N.V. consistently receives strong grades with multiple “Outperform” and “Overweight” ratings, including recent upgrades. Lam Research Corporation also earns predominantly “Buy” and “Outperform” ratings but fewer upgrades. Investors may interpret ASML’s steady upgrades as a signal of growing institutional confidence.
Risks specific to each company
The following categories identify the critical pressure points and systemic threats facing both firms in the 2026 market environment:
1. Market & Competition
ASML Holding N.V.
- Dominates advanced lithography but faces pricing pressure amid cyclical semiconductor demand.
Lam Research Corporation
- Strong in etching and deposition with higher beta, indicating greater sensitivity to market swings.
2. Capital Structure & Debt
ASML Holding N.V.
- Low debt-to-equity ratio (0.14) signals conservative leverage and strong balance sheet.
Lam Research Corporation
- Higher leverage (D/E 0.48) but manageable with robust interest coverage (33.43x).
3. Stock Volatility
ASML Holding N.V.
- Beta 1.34 shows moderate volatility, slightly lower than LRCX.
Lam Research Corporation
- Beta 1.78 reflects elevated stock volatility, increasing investment risk.
4. Regulatory & Legal
ASML Holding N.V.
- Exposed to export controls on critical EUV technology, risking supply chain and sales disruptions.
Lam Research Corporation
- Faces regulatory scrutiny in U.S. and China markets, impacting operational flexibility.
5. Supply Chain & Operations
ASML Holding N.V.
- Highly dependent on global semiconductor manufacturing hubs; any disruption affects production timelines.
Lam Research Corporation
- More diversified supplier base but vulnerable to raw material price volatility.
6. ESG & Climate Transition
ASML Holding N.V.
- Strong ESG initiatives but must accelerate climate risk mitigation to meet industry benchmarks.
Lam Research Corporation
- Active in sustainability but exposed to energy-intensive manufacturing processes.
7. Geopolitical Exposure
ASML Holding N.V.
- Significant exposure to Asia, particularly China and Taiwan tensions.
Lam Research Corporation
- Substantial U.S.-China trade tensions risk operational continuity.
Which company shows a better risk-adjusted profile?
ASML’s single most impactful risk is regulatory constraints on its lithography exports, threatening its competitive moat. Lam Research’s greatest risk lies in its higher stock volatility and geopolitical exposure. Despite this, Lam Research’s stronger liquidity ratios and higher Altman Z-score indicate a more resilient financial position. The recent surge in Lam’s trading volume amid market sell-offs confirms elevated investor caution. Overall, Lam Research offers a marginally better risk-adjusted profile given its balance of operational risks and financial strength.
Final Verdict: Which stock to choose?
ASML’s superpower lies in its durable competitive advantage and relentless value creation. Its exceptional ROIC well above WACC signals a cash-generating machine with strong pricing power. The main point of vigilance is its premium valuation multiples, which could test patience. It suits portfolios targeting long-term aggressive growth with tolerance for valuation risk.
Lam Research boasts a strategic moat rooted in operational efficiency and solid recurring cash flows. Its more favorable liquidity ratios and moderate valuation provide a comparatively safer profile than ASML. This stock fits well in GARP (Growth at a Reasonable Price) portfolios aiming for steady growth with a cushion against volatility.
If you prioritize capturing outsized growth from a market leader with a formidable moat, ASML is the compelling choice due to its superior profitability and innovation edge. However, if you seek balanced growth with better financial stability and valuation comfort, Lam Research offers better stability and a more moderate risk-reward profile.
Disclaimer: Investment carries a risk of loss of initial capital. The past performance is not a reliable indicator of future results. Be sure to understand risks before making an investment decision.
Go Further
I encourage you to read the complete analyses of ASML Holding N.V. and Lam Research Corporation to enhance your investment decisions: