Home > Comparison > Technology > ASML vs KLAC
The strategic rivalry between ASML Holding N.V. and KLA Corporation defines the current trajectory of the semiconductor technology sector. ASML stands as a capital-intensive leader in advanced lithography systems, while KLA excels as a high-margin specialist in process control and yield management. This head-to-head battle highlights growth versus precision dominance. This analysis aims to identify which corporate path offers superior risk-adjusted returns for a diversified portfolio in the evolving semiconductor landscape.
Table of contents
Companies Overview
ASML Holding N.V. and KLA Corporation shape the semiconductor equipment landscape with distinct yet complementary market roles.
ASML Holding N.V.: Semiconductor Lithography Pioneer
ASML dominates advanced lithography systems, essential for chip manufacturing. Its revenue stems from selling and servicing extreme and deep ultraviolet lithography machines globally. In 2026, ASML’s strategic focus remains on pushing the boundaries of semiconductor node technology through innovation in computational lithography and system upgrades.
KLA Corporation: Yield and Process Control Specialist
KLA leads in semiconductor process control and yield management solutions. It generates revenue by providing inspection, metrology, and process-enabling equipment across semiconductor and electronics industries. In 2026, KLA emphasizes expanding its integrated software and hardware solutions to enhance manufacturing efficiency and defect detection in advanced chip production.
Strategic Collision: Similarities & Divergences
Both companies serve semiconductor manufacturing but differ fundamentally: ASML offers a closed ecosystem of lithography tools, while KLA provides an open infrastructure for process control and inspection. Their primary battleground centers on wafer-level technology precision and yield enhancement. ASML appeals through capital-intensive innovation; KLA attracts with diversified process expertise, reflecting distinct risk and growth profiles.
Income Statement Comparison
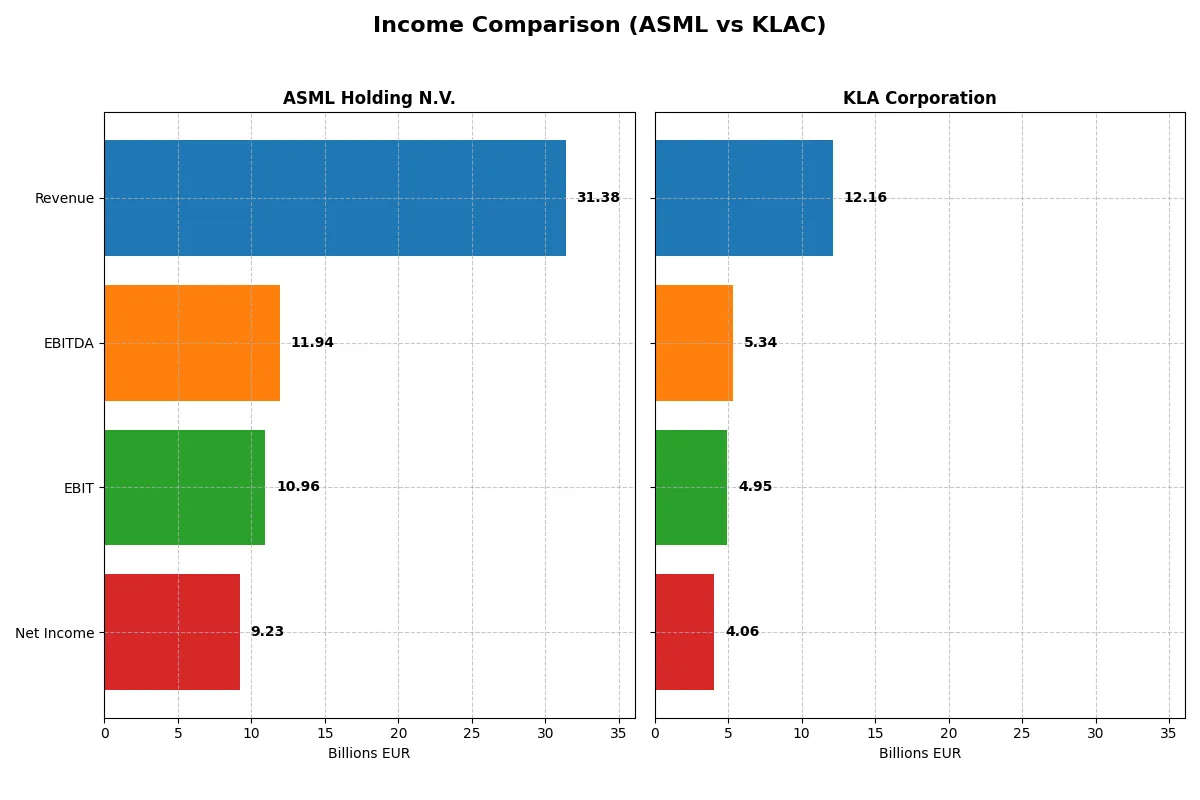
This data dissects the core profitability and scalability of both corporate engines to reveal who dominates the bottom line:
| Metric | ASML Holding N.V. (ASML) | KLA Corporation (KLAC) |
|---|---|---|
| Revenue | 31.4B EUR | 12.2B USD |
| Cost of Revenue | 14.8B EUR | 4.6B USD |
| Operating Expenses | 5.7B EUR | 2.3B USD |
| Gross Profit | 16.6B EUR | 7.6B USD |
| EBITDA | 11.9B EUR | 5.3B USD |
| EBIT | 11.0B EUR | 4.9B USD |
| Interest Expense | 0 | 0.3B USD |
| Net Income | 9.2B EUR | 4.1B USD |
| EPS | 23.76 EUR | 30.53 USD |
| Fiscal Year | 2025 | 2025 |
Income Statement Analysis: The Bottom-Line Duel
This income statement comparison reveals each company’s operational efficiency and profit-generation prowess over recent years.
ASML Holding N.V. Analysis
ASML’s revenue climbed steadily from €18.6B in 2021 to €31.4B in 2025, showing solid growth momentum. Net income rose from €5.9B to €9.2B in the same period, underpinning robust profitability. Gross margin holds firm above 52%, and net margin nears 30%, reflecting strong cost control and efficiency gains in 2025.
KLA Corporation Analysis
KLA’s revenue surged from $6.9B in 2021 to $12.2B in 2025, outpacing ASML’s growth rate. Net income nearly doubled from $2.1B to $4.1B, with margins impressively high—gross margin above 62% and net margin over 33% in 2025. This reflects superior operational leverage and expanding profitability driven by strong revenue acceleration.
Margin Strength vs. Growth Velocity
Both companies display favorable income statements, yet KLA edges ahead with higher margins and sharper growth rates. ASML posts impressive scale and steady margin improvement, while KLA’s margin expansion and nearly 95% net income growth highlight stronger fundamental momentum. Investors seeking rapid earnings growth may find KLA’s profile more attractive, whereas ASML offers reliability with solid profitability.
Financial Ratios Comparison
These vital ratios act as a diagnostic tool to expose the underlying fiscal health, valuation premiums, and capital efficiency of the companies compared below:
| Ratios | ASML Holding N.V. (ASML) | KLA Corporation (KLAC) |
|---|---|---|
| ROE | 47.1% | 86.6% |
| ROIC | 34.1% | 38.0% |
| P/E | 38.3 | 29.3 |
| P/B | 18.0 | 25.4 |
| Current Ratio | 1.26 | 2.62 |
| Quick Ratio | 0.79 | 1.83 |
| D/E (Debt/Equity) | 0.14 | 1.30 |
| Debt-to-Assets | 5.4% | 37.9% |
| Interest Coverage | 0 (not reported) | 17.3 |
| Asset Turnover | 0.62 | 0.76 |
| Fixed Asset Turnover | 3.81 | 9.70 |
| Payout ratio | 26.5% | 22.3% |
| Dividend yield | 0.69% | 0.76% |
| Fiscal Year | 2025 | 2025 |
Efficiency & Valuation Duel: The Vital Signs
Financial ratios act as a company’s DNA, exposing hidden risks and highlighting operational excellence that shapes investor returns.
ASML Holding N.V.
ASML delivers strong profitability with a 47.08% ROE and a 29.42% net margin, signaling exceptional efficiency. However, its P/E of 38.33 and P/B of 18.05 render the stock expensive and stretched. Shareholder returns lean on modest 0.69% dividends, suggesting reinvestment into R&D fuels future growth.
KLA Corporation
KLA posts an outstanding 86.56% ROE and a 33.41% net margin, reflecting top-tier profitability and operational strength. Its valuation is lower than ASML’s, with a P/E of 29.34, but a higher P/B of 25.39. KLA supports shareholders via a 0.76% dividend while maintaining strong liquidity, indicating balanced capital allocation.
Premium Valuation vs. Operational Safety
Both companies exhibit slightly favorable ratios, but ASML’s elevated valuation contrasts with KLA’s superior liquidity and leverage metrics. KLA offers a better risk-reward balance for investors prioritizing operational safety and returns, while ASML suits those betting on sustained innovation and growth.
Which one offers the Superior Shareholder Reward?
I compare ASML Holding N.V. and KLA Corporation’s shareholder rewards by analyzing dividend yields, payout ratios, and buyback intensity. ASML yields ~0.97% with a 27% payout ratio, while KLAC yields ~0.76% with a 22% payout ratio. Both show strong free cash flow coverage. KLAC’s buyback activity is more aggressive, supported by higher operating margins (43% vs. ASML’s 35%). ASML balances dividends with reinvestment in capex, maintaining sustainability. KLAC’s leverage is higher (debt/equity 1.3x vs. 0.14x), posing risk. I find KLAC’s total shareholder return profile more attractive today, driven by robust buybacks and margin expansion, but ASML offers steadier dividend growth and capital discipline. For 2026, KLAC edges ASML for yield plus buyback returns, but investors must weigh KLAC’s higher leverage risk.
Comparative Score Analysis: The Strategic Profile
The radar chart reveals the fundamental DNA and trade-offs of ASML Holding N.V. and KLA Corporation, highlighting their financial strengths and vulnerabilities:
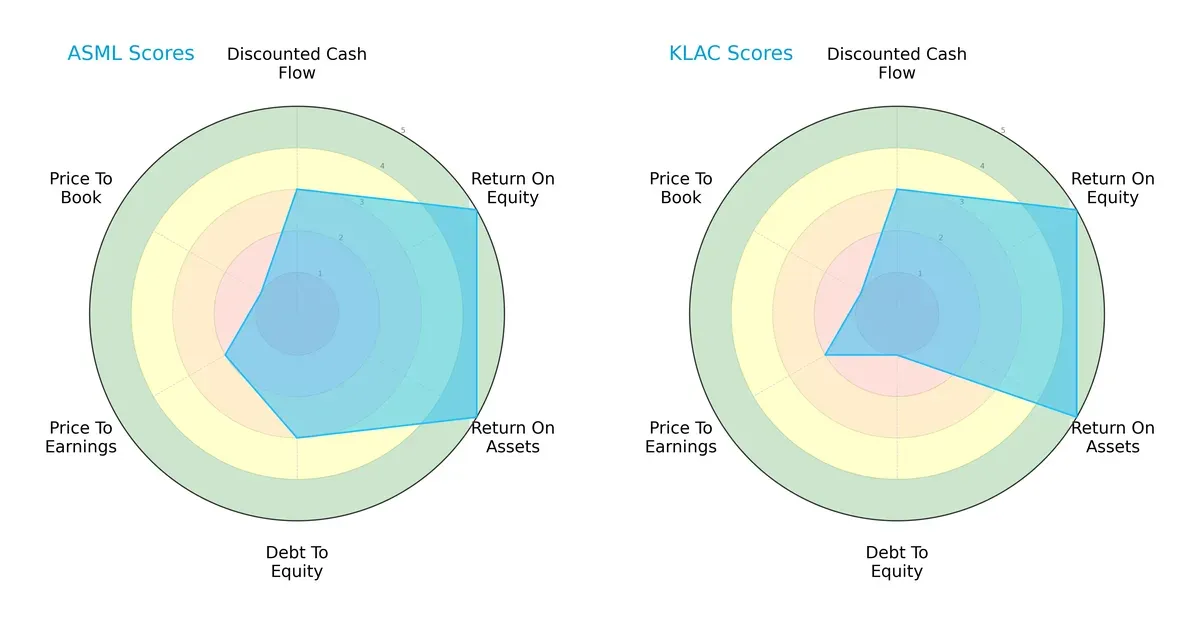
Both firms deliver exceptional returns on equity (5) and assets (5), reflecting operational efficiency and strong capital use. ASML maintains a moderate debt-to-equity score (3), signaling balanced leverage, while KLA’s score (1) indicates heavier reliance on debt, raising risk. Valuation scores show both companies moderately priced on P/E (2) but very unfavorable on P/B (1). ASML’s profile is more balanced, whereas KLA leans on its operational excellence but carries higher financial risk.
Bankruptcy Risk: Solvency Showdown
ASML and KLA both score well above 12 on the Altman Z-Score, placing them firmly in the safe zone:
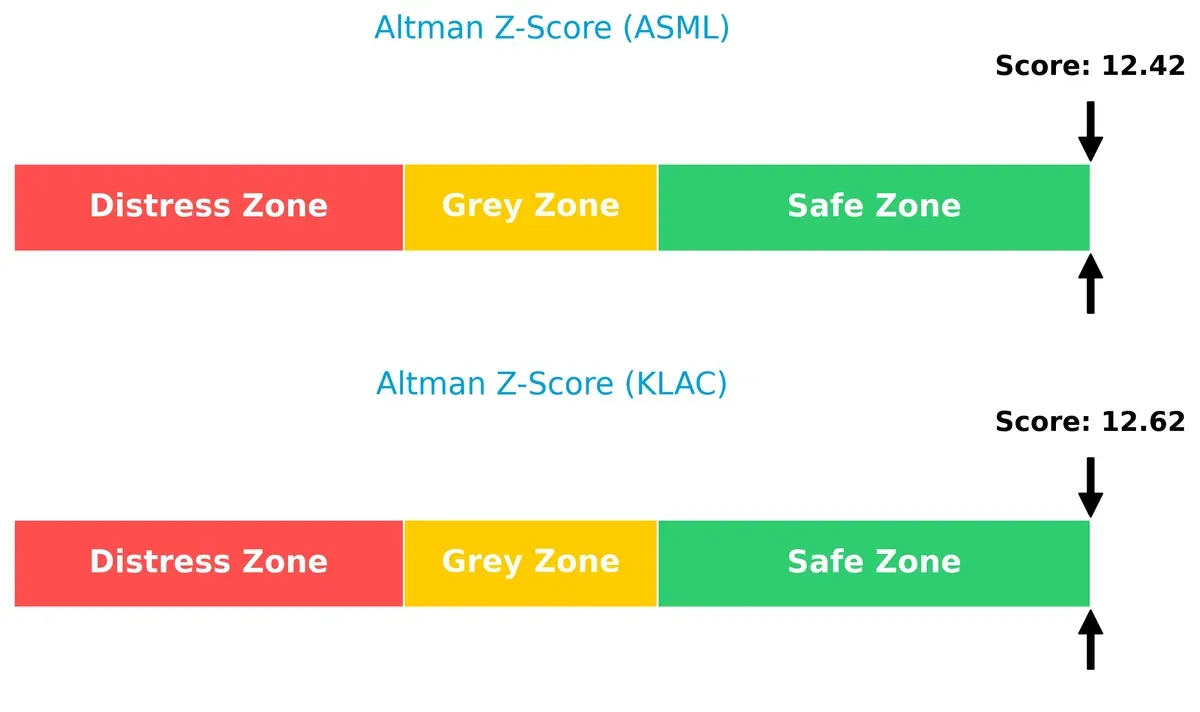
Such high scores indicate robust financial stability and very low bankruptcy risk, a crucial advantage in a volatile semiconductor cycle.
Financial Health: Quality of Operations
Both ASML and KLA achieve a Piotroski F-Score of 8, indicating very strong financial health and operational quality:
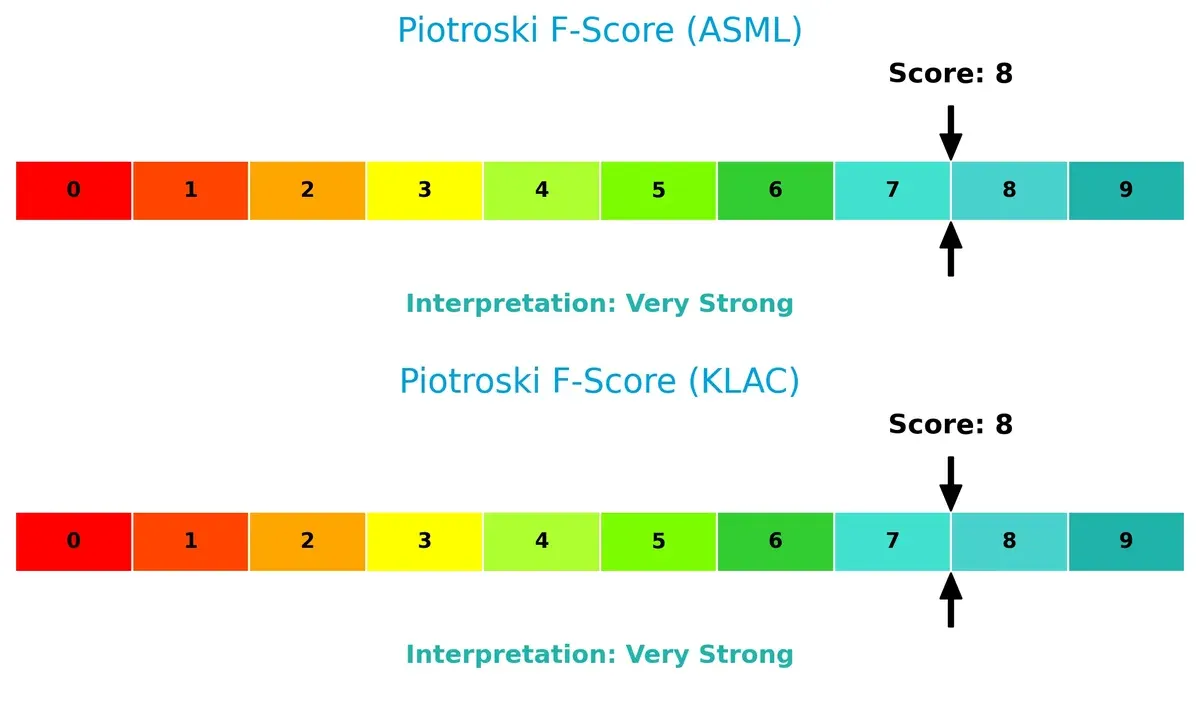
This score reflects solid profitability, liquidity, and efficiency metrics, with no immediate red flags in internal financial controls or performance. Both companies demonstrate disciplined management and resilient fundamentals.
How are the two companies positioned?
This section dissects ASML and KLAC’s operational DNA by comparing revenue distribution and internal dynamics—strengths and weaknesses. The goal is to confront their economic moats and identify which model offers the most resilient, sustainable advantage today.
Revenue Segmentation: The Strategic Mix
This visual comparison dissects how ASML Holding N.V. and KLA Corporation diversify their income streams and where their primary sector bets lie:
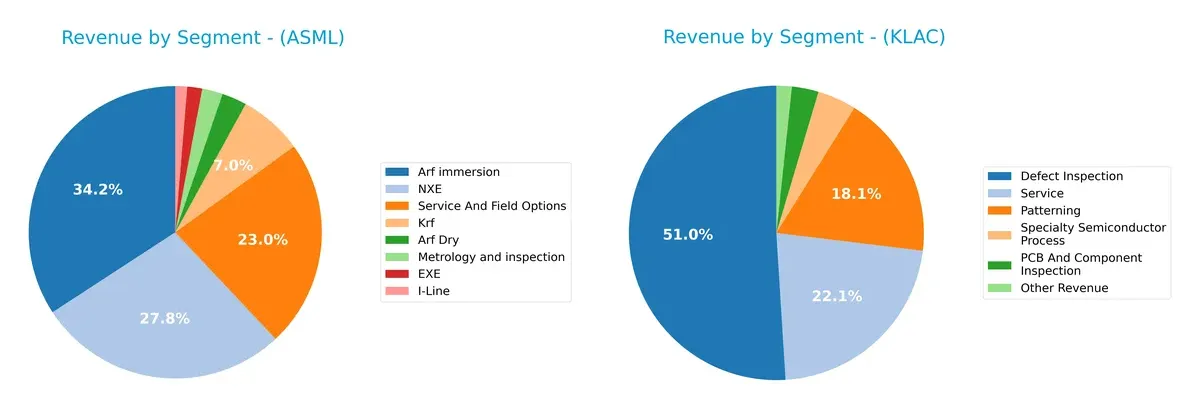
ASML’s revenue pivots primarily on Arf immersion at 9.7B and NXE at 7.9B, anchored by Service And Field Options at 6.5B. KLA leans heavily on Defect Inspection with 6.2B, supported by Patterning at 2.2B and Service at 2.7B. ASML shows a broader tech product range, reducing concentration risk, while KLA’s focus on inspection signals infrastructure dominance but greater segment dependency.
Strengths and Weaknesses Comparison
This table compares the Strengths and Weaknesses of ASML Holding N.V. and KLA Corporation:
ASML Strengths
- Diverse product lines including EUV, NXE, Metrology, and Service segments
- Strong profitability with 29.42% net margin and 47.08% ROE
- Low debt levels with 0.14 D/E and 5.36% debt-to-assets
- High fixed asset turnover at 3.81 indicating efficient asset use
KLAC Strengths
- Broad revenue streams covering Defect Inspection, Patterning, Specialty Semiconductor, and Service
- Superior profitability metrics: 33.41% net margin, 86.56% ROE, and 37.97% ROIC
- Strong liquidity ratios with 2.62 current and 1.83 quick ratios
- High fixed asset turnover of 9.7 showing excellent asset efficiency
ASML Weaknesses
- Elevated valuation multiples: PE of 38.33 and PB of 18.05
- Unfavorable quick ratio at 0.79 signals liquidity risk
- Higher WACC at 10.08% compared to ROIC
- Low dividend yield at 0.69%
- Moderate geographic concentration with heavy China and Korea exposure
KLAC Weaknesses
- High debt-to-equity at 1.3 indicates leverage risk
- Unfavorable valuation multiples: PE of 29.34 and PB of 25.39
- WACC at 10.42% slightly above ROIC
- Dividend yield low at 0.76%
- Geographic revenue concentration in China and Taiwan
Both companies show strong profitability and asset efficiency, with KLAC demonstrating superior liquidity and lower valuation multiples. ASML maintains lower leverage but faces liquidity concerns. Geographic concentration in Asia presents risks for both. These factors should influence their strategic focus on risk management and market diversification.
The Moat Duel: Analyzing Competitive Defensibility
A structural moat is the only reliable shield protecting long-term profits from relentless competition erosion:
ASML Holding N.V.: Technological Leadership with High Entry Barriers
ASML’s moat stems from its proprietary extreme ultraviolet lithography technology. This yields high ROIC above WACC by 24%, reflecting superior capital efficiency. Continued innovation in lithography deepens its competitive edge into 2026.
KLA Corporation: Process Control Dominance with Expanding Market Reach
KLA’s moat relies on integrated process control solutions, boasting an even higher ROIC premium over WACC of 27.5%. Its accelerating ROIC growth signals efficient capital use and expanding market penetration beyond ASML’s niche.
Moat Strength Showdown: Innovation vs. Process Mastery
KLA edges ASML with stronger ROIC growth and a slightly wider moat. However, ASML’s cutting-edge lithography tech creates a deep barrier. KLA appears better poised to defend and expand its market share amid industry shifts.
Which stock offers better returns?
Over the past 12 months, ASML Holding N.V. and KLA Corporation both showed strong upward price momentum, with notable acceleration in their gains and shifts in trading dynamics.

Trend Comparison
ASML Holding N.V. posted a 43.11% price increase over the past year, reflecting a bullish trend with accelerating momentum and a high of 1423.0. Volatility remains elevated with a standard deviation of 170.09.
KLA Corporation delivered a 104.22% gain in the same period, also bullish and accelerating, reaching a peak of 1567.82. Its volatility, measured by a 213.25 standard deviation, is higher than ASML’s.
KLA’s trend significantly outperformed ASML’s, doubling its price increase and showing stronger market performance over the analyzed 12-month span.
Target Prices
Analysts present a moderately bullish consensus for ASML Holding N.V. and KLA Corporation, with target prices implying upside potential.
| Company | Target Low | Target High | Consensus |
|---|---|---|---|
| ASML Holding N.V. | 1150 | 1911 | 1458.5 |
| KLA Corporation | 1400 | 1900 | 1672.25 |
The target consensus for ASML slightly exceeds its current price of 1423, signaling modest upside. KLA’s consensus target at 1672 implies a more significant gain from its current 1428 level.

Don’t Let Luck Decide Your Entry Point
Optimize your entry points with our advanced ProRealTime indicators. You’ll get efficient buy signals with precise price targets for maximum performance. Start outperforming now!
How do institutions grade them?
ASML Holding N.V. Grades
The following table summarizes recent grades and actions from major grading companies for ASML Holding N.V.:
| Grading Company | Action | New Grade | Date |
|---|---|---|---|
| Barclays | Upgrade | Overweight | 2026-01-29 |
| Wells Fargo | Maintain | Overweight | 2026-01-29 |
| RBC Capital | Maintain | Outperform | 2026-01-29 |
| Bernstein | Maintain | Outperform | 2026-01-22 |
| KGI Securities | Upgrade | Outperform | 2026-01-15 |
| Wells Fargo | Maintain | Overweight | 2026-01-15 |
| JP Morgan | Maintain | Overweight | 2026-01-14 |
| Bernstein | Upgrade | Outperform | 2026-01-05 |
| B of A Securities | Maintain | Buy | 2025-12-03 |
| JP Morgan | Maintain | Overweight | 2025-12-01 |
KLA Corporation Grades
The following table summarizes recent grades and actions from major grading companies for KLA Corporation:
| Grading Company | Action | New Grade | Date |
|---|---|---|---|
| RBC Capital | Maintain | Sector Perform | 2026-01-30 |
| Jefferies | Maintain | Buy | 2026-01-30 |
| Oppenheimer | Maintain | Outperform | 2026-01-30 |
| Needham | Maintain | Buy | 2026-01-30 |
| Barclays | Maintain | Overweight | 2026-01-30 |
| Stifel | Maintain | Buy | 2026-01-30 |
| Cantor Fitzgerald | Maintain | Overweight | 2026-01-30 |
| Wells Fargo | Maintain | Overweight | 2026-01-30 |
| Deutsche Bank | Maintain | Hold | 2026-01-21 |
| Needham | Maintain | Buy | 2026-01-20 |
Which company has the best grades?
ASML Holding N.V. has consistently received upgrades and maintains mostly “Overweight” and “Outperform” ratings. KLA Corporation holds a variety of “Buy,” “Overweight,” and “Outperform” grades but also includes a “Sector Perform” and “Hold.” ASML’s stronger upgrade momentum and higher-grade consistency suggest greater institutional confidence, potentially influencing investor sentiment positively.
Risks specific to each company
The following categories identify critical pressure points and systemic threats facing ASML Holding N.V. and KLA Corporation in the 2026 market environment:
1. Market & Competition
ASML Holding N.V.
- Dominates advanced lithography with high barriers to entry, but faces intense innovation pressure.
KLA Corporation
- Strong in process control and inspection, with diversified segments but faces fierce competition.
2. Capital Structure & Debt
ASML Holding N.V.
- Low debt-to-equity (0.14) with strong interest coverage signals financial stability.
KLA Corporation
- Higher debt-to-equity (1.3) raises financial risk despite good interest coverage.
3. Stock Volatility
ASML Holding N.V.
- Beta 1.34 indicates moderately higher volatility than market average.
KLA Corporation
- Beta 1.44 reflects elevated volatility; riskier stock price swings for investors.
4. Regulatory & Legal
ASML Holding N.V.
- Faces export restrictions due to advanced tech sensitive to geopolitical controls.
KLA Corporation
- Regulatory scrutiny in US tech sector could impact operations and compliance costs.
5. Supply Chain & Operations
ASML Holding N.V.
- Complex global supply chain vulnerable to disruptions in Asia and Europe.
KLA Corporation
- Relies on specialized suppliers; operational risks from chip industry cyclicality.
6. ESG & Climate Transition
ASML Holding N.V.
- Increasing pressure to reduce carbon footprint amid energy-intensive manufacturing.
KLA Corporation
- Committed to sustainability but challenged by energy use and material sourcing.
7. Geopolitical Exposure
ASML Holding N.V.
- Significant exposure to Asia-Pacific tensions affecting sales and exports.
KLA Corporation
- US-centric operations face risks from trade policies and international relations.
Which company shows a better risk-adjusted profile?
ASML’s low leverage and safer balance sheet provide a more resilient foundation against market shocks. KLA’s higher debt and volatility increase its financial risk. ASML’s dominant technological moat also buffers competitive threats better. However, geopolitical and supply chain risks remain material for both. The sharp recent stock price drop of KLA (-15%) compared to ASML’s milder decline (-2.2%) highlights elevated market concerns over KLA’s risk profile. In sum, ASML shows a superior risk-adjusted profile in 2026’s uncertain semiconductor landscape.
Final Verdict: Which stock to choose?
ASML Holding N.V. stands out as a cash machine with a durable competitive advantage, driven by its unmatched efficiency in capital allocation and innovation. Its main point of vigilance is the relatively high valuation multiples, which could temper near-term upside. It fits well in aggressive growth portfolios aiming for long-term value creation.
KLA Corporation boasts a strategic moat rooted in its strong recurring revenue and robust balance sheet liquidity. Compared to ASML, it offers better current liquidity but carries higher debt, posing moderate leverage risk. KLA suits GARP investors who seek growth while preserving a margin of safety.
If you prioritize aggressive growth fueled by superior capital returns and technological leadership, ASML is the compelling choice due to its consistent value creation and operational excellence. However, if you seek growth combined with greater liquidity and a slightly more conservative risk profile, KLA offers better stability and recurring revenue strength, despite its higher leverage.
Disclaimer: Investment carries a risk of loss of initial capital. The past performance is not a reliable indicator of future results. Be sure to understand risks before making an investment decision.
Go Further
I encourage you to read the complete analyses of ASML Holding N.V. and KLA Corporation to enhance your investment decisions: