Home > Comparison > Technology > ASML vs IPGP
The strategic rivalry between ASML Holding N.V. and IPG Photonics Corporation shapes the semiconductor industry’s innovation landscape. ASML operates as a capital-intensive leader in advanced lithography systems, while IPG focuses on high-performance fiber lasers and amplifiers. This contrast reflects a broader battle between equipment manufacturing and specialized components. This analysis aims to identify which business model offers superior risk-adjusted returns for a diversified technology portfolio in 2026.
Table of contents
Companies Overview
ASML Holding N.V. and IPG Photonics Corporation both hold pivotal roles in the semiconductor technology space, shaping critical components in chip manufacturing and laser applications.
ASML Holding N.V.: Semiconductor Lithography Leader
ASML dominates the advanced semiconductor equipment market by producing cutting-edge lithography systems, including extreme ultraviolet solutions. Its revenue stems from selling and servicing these complex systems globally. In 2026, ASML’s strategic focus remains on refining lithography technology to enable smaller, more powerful semiconductor nodes, reinforcing its technological moat.
IPG Photonics Corporation: Fiber Laser Innovator
IPG Photonics specializes in high-performance fiber lasers and amplifiers used in materials processing and communications. It generates revenue by selling diverse laser systems and integrated solutions to OEMs and end users worldwide. In 2026, IPG advances its product portfolio with an emphasis on expanding laser applications across industrial and medical fields.
Strategic Collision: Similarities & Divergences
Both companies emphasize innovation in semiconductor-related technologies but diverge in approach. ASML pursues a closed, high-barrier ecosystem around lithography systems, while IPG offers versatile laser solutions in an open market. Their primary battleground lies in supplying essential components for semiconductor manufacturing and materials processing. Investors face distinct profiles: ASML’s scale and technological moat contrast with IPG’s niche laser specialization and market agility.
Income Statement Comparison
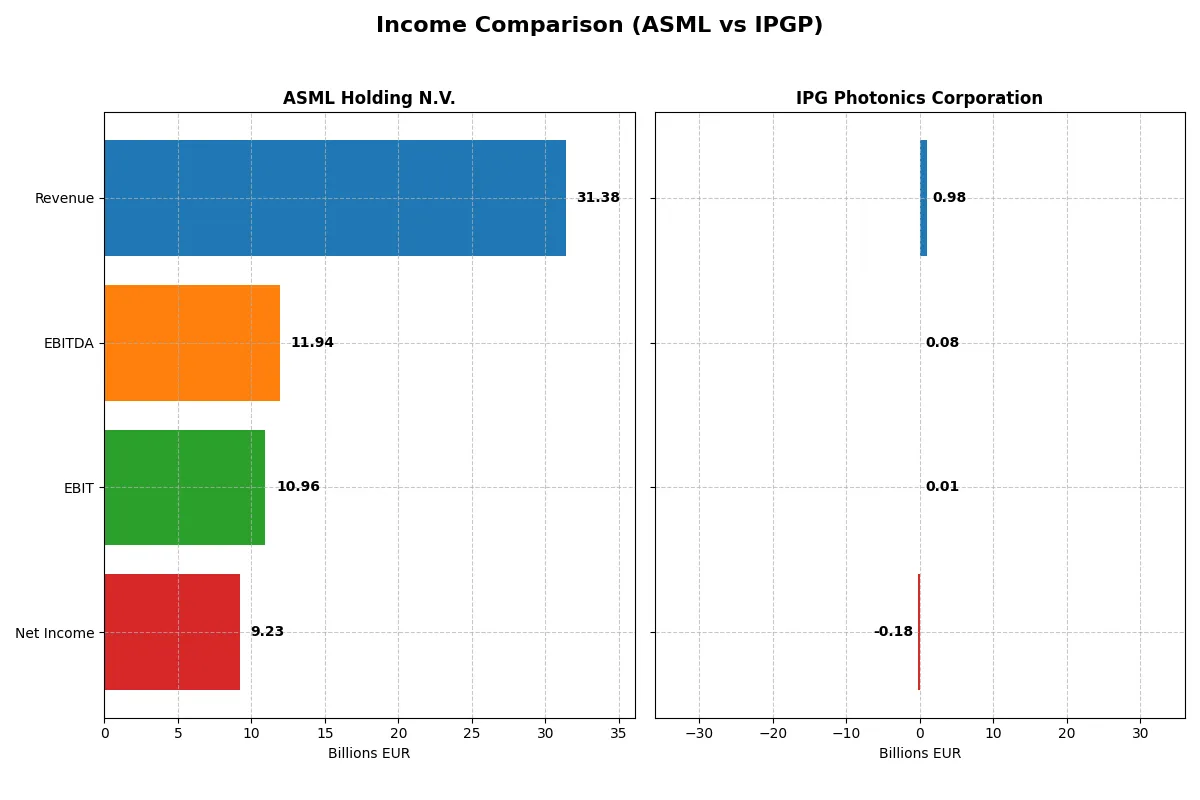
This table dissects the core profitability and scalability of both corporate engines to reveal who dominates the bottom line:
| Metric | ASML Holding N.V. (ASML) | IPG Photonics Corporation (IPGP) |
|---|---|---|
| Revenue | 31.4B EUR | 977M USD |
| Cost of Revenue | 14.8B EUR | 639M USD |
| Operating Expenses | 5.72B EUR | 546M USD |
| Gross Profit | 16.6B EUR | 338M USD |
| EBITDA | 11.9B EUR | 76M USD |
| EBIT | 11.0B EUR | 14.5M USD |
| Interest Expense | 0 | 0 |
| Net Income | 9.23B EUR | -182M USD |
| EPS | 23.76 | -4.09 |
| Fiscal Year | 2025 | 2024 |
Income Statement Analysis: The Bottom-Line Duel
The following income statement comparison reveals which company drives superior efficiency and profit generation in their respective markets.
ASML Holding N.V. Analysis
ASML exhibits robust growth, with 2025 revenue reaching 31.4B EUR, up 11% from 2024. Net income climbs to 9.2B EUR, sustaining a strong net margin near 29.4%. Its gross margin exceeds 52%, reflecting high operational efficiency. The company’s EBIT margin rose to nearly 35%, indicating solid momentum and disciplined cost control.
IPG Photonics Corporation Analysis
IPG’s 2024 revenue slid 24% to 977M USD, accompanied by a steep net loss of 182M USD and a negative net margin of -18.6%. Gross margin at 34.6% remains moderate, but EBIT margin barely surpasses 1%. The sharp decline in profitability and revenue signals operational challenges and weak momentum heading into 2026.
Margin Dominance vs. Revenue Contraction
ASML clearly outperforms IPG with superior revenue growth and sustained margin expansion. ASML’s efficient cost management and strong R&D investment fuel profit gains, while IPG struggles with shrinking sales and negative margins. For investors, ASML’s profile offers dependable growth and profitability, contrasting sharply with IPG’s current financial headwinds.
Financial Ratios Comparison
These vital ratios act as a diagnostic tool to expose the underlying fiscal health, valuation premiums, and capital efficiency of the companies compared below:
| Ratios | ASML Holding N.V. (ASML) | IPG Photonics Corporation (IPGP) |
|---|---|---|
| ROE | 47.1% | -8.97% |
| ROIC | 34.1% | -9.97% |
| P/E | 38.3 | -17.8 |
| P/B | 18.0 | 1.59 |
| Current Ratio | 1.26 | 6.98 |
| Quick Ratio | 0.79 | 5.59 |
| D/E (Debt-to-Equity) | 0.14 | 0.009 |
| Debt-to-Assets | 5.36% | 0.78% |
| Interest Coverage | N/A | N/A |
| Asset Turnover | 0.62 | 0.43 |
| Fixed Asset Turnover | 3.81 | 1.66 |
| Payout ratio | 26.5% | 0% |
| Dividend yield | 0.69% | 0% |
| Fiscal Year | 2025 | 2024 |
Efficiency & Valuation Duel: The Vital Signs
Ratios act as a company’s DNA, revealing hidden risks and operational excellence critical for investment decisions.
ASML Holding N.V.
ASML demonstrates exceptional profitability with a 47.08% ROE and a strong 29.42% net margin, signaling operational efficiency. The stock trades at a stretched P/E of 38.33 and a high P/B of 18.05, reflecting premium valuation. Shareholders see modest dividends at 0.69%, with significant reinvestment in R&D fueling growth potential.
IPG Photonics Corporation
IPGP shows weak profitability, with negative ROE (-8.97%) and a net loss margin (-18.58%), indicating operational struggles. It trades at a negative P/E (-17.76), which may reflect market skepticism despite a low P/B of 1.59. The company does not pay dividends, focusing on maintaining liquidity and managing debt conservatively with a strong quick ratio.
Premium Valuation vs. Operational Fragility
ASML offers a superior balance of high profitability and premium valuation, while IPGP reveals operational weaknesses despite conservative financial leverage. Investors seeking growth with proven returns may prefer ASML, whereas those prioritizing liquidity and turnaround potential might consider IPGP’s profile.
Which one offers the Superior Shareholder Reward?
I compare ASML Holding N.V. and IPG Photonics Corporation on dividends, buybacks, and sustainability. ASML pays a modest 0.97% dividend yield with a reasonable 27% payout ratio, supported by strong free cash flow of €27.4/share and a robust buyback program. IPGP offers no dividend but reinvests heavily in growth, reflected in solid operating cash flow and capex coverage ratios. However, IPGP’s negative net margin in 2024 signals profitability stress, raising sustainability concerns. ASML’s balanced distribution—steady dividends plus buybacks funded by healthy free cash flow—offers a superior total shareholder return profile for 2026.
Comparative Score Analysis: The Strategic Profile
The radar chart reveals the fundamental DNA and trade-offs of ASML Holding N.V. and IPG Photonics Corporation, highlighting their strategic financial strengths and weaknesses:
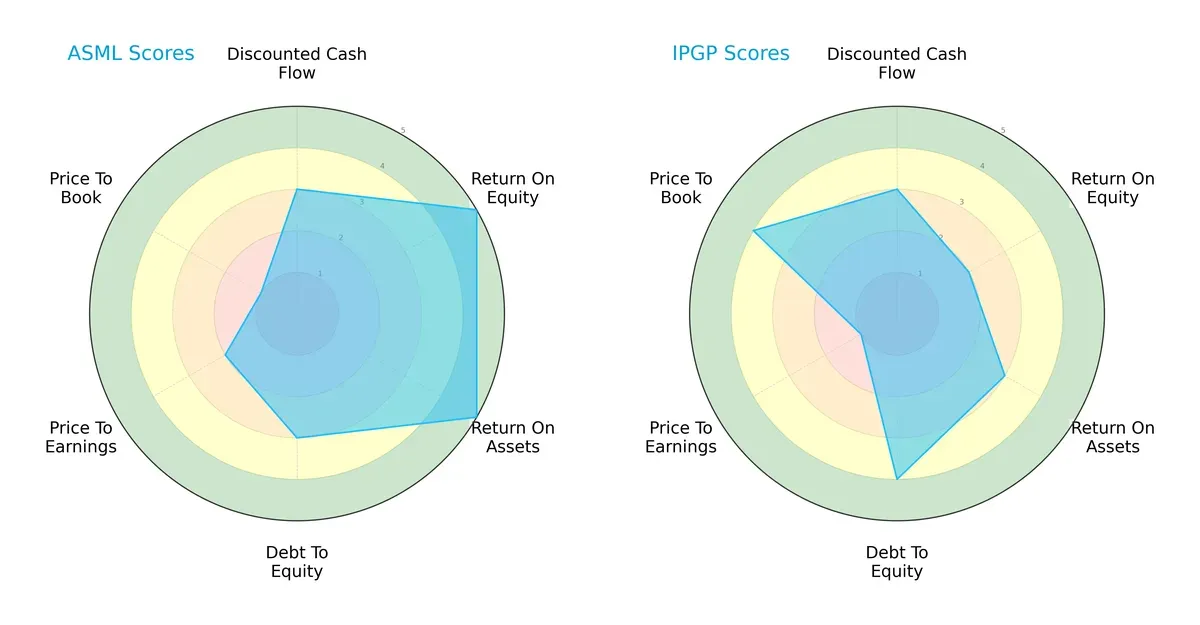
ASML dominates in profitability with top-tier ROE and ROA scores (5 each), reflecting superior asset and equity efficiency. IPG shows a more conservative balance sheet with a stronger debt-to-equity score (4 vs. 3), signaling lower financial risk. Both companies register moderate DCF scores (3), indicating similar valuation expectations. However, ASML’s valuation metrics lag, marked by unfavorable price-to-book (1) and moderate price-to-earnings (2) scores, while IPG exhibits a better price-to-book valuation (4) but struggles with price-to-earnings (1). Overall, ASML presents a more concentrated edge in profitability, while IPG offers a balanced profile with lower leverage risk.
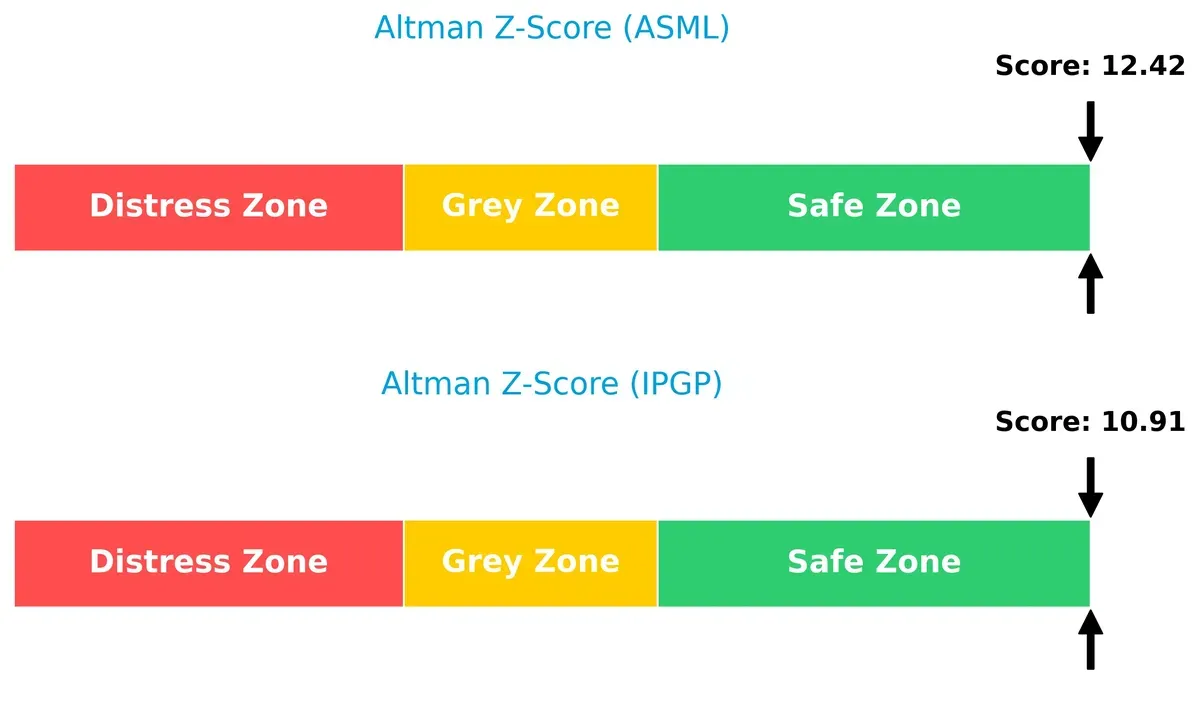
Bankruptcy Risk: Solvency Showdown
ASML’s Altman Z-Score of 12.4 versus IPG’s 10.9 signals both firms are well within the safe zone, implying robust financial resilience and minimal bankruptcy risk in this market cycle:
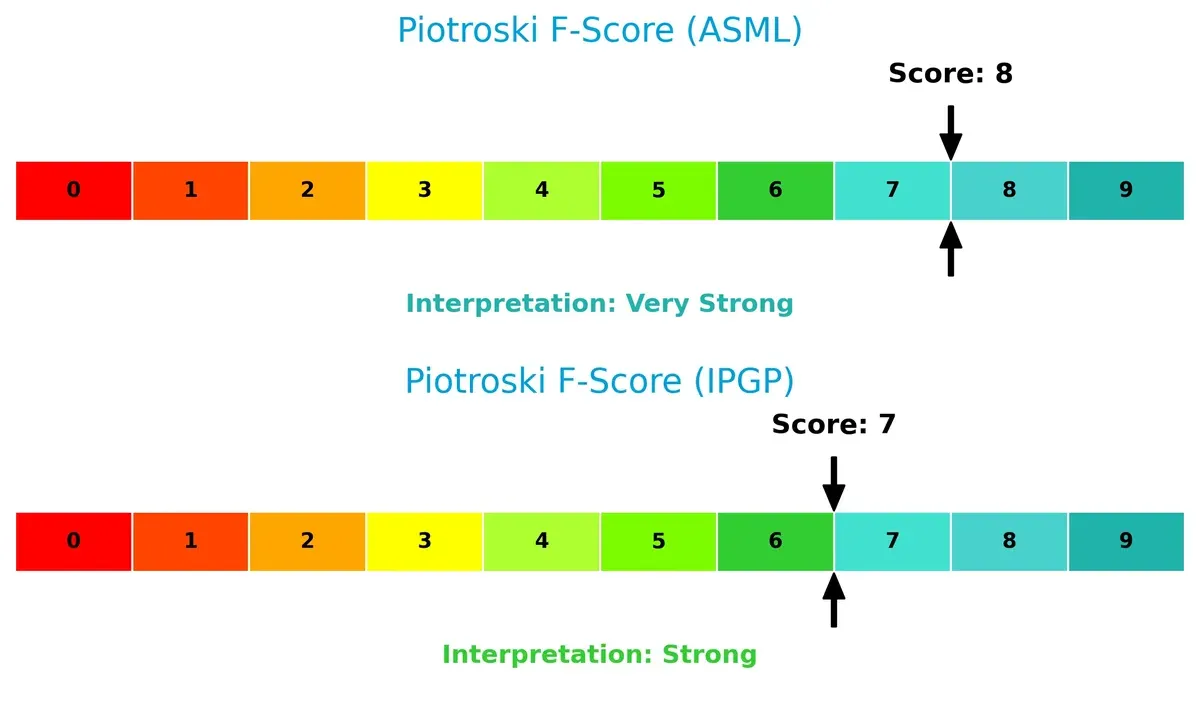
Financial Health: Quality of Operations
ASML’s Piotroski F-Score of 8 surpasses IPG’s 7, indicating superior operational quality and financial strength. IPG remains strong but shows slight red flags compared to ASML’s peak health metrics:
How are the two companies positioned?
This section dissects ASML and IPGP’s operational DNA by comparing their revenue distribution and internal dynamics. The goal is to confront their economic moats to reveal which business model delivers the most resilient competitive advantage today.
Revenue Segmentation: The Strategic Mix
The following visual comparison dissects how ASML Holding N.V. and IPG Photonics Corporation diversify their income streams and reveals their primary sector bets:
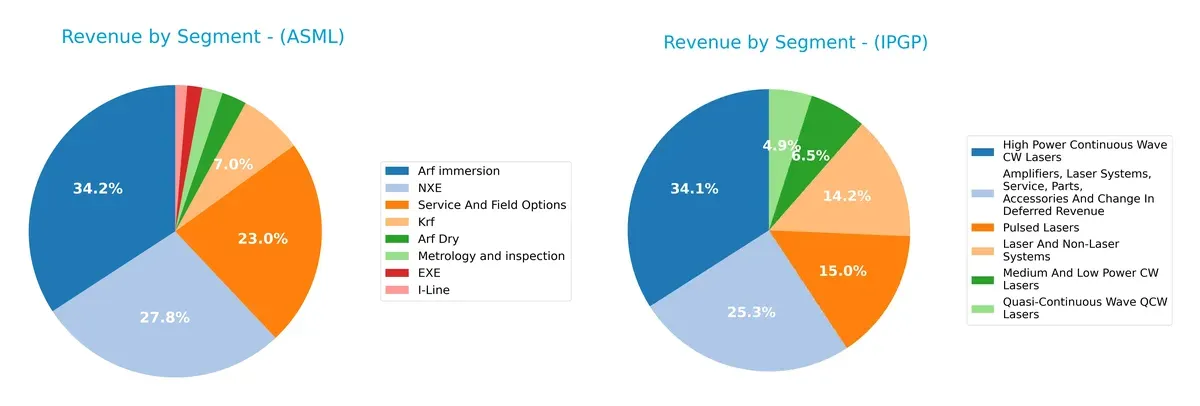
ASML pivots heavily on Arf immersion at €9.67B and NXE at €7.86B, anchoring its revenue in advanced lithography systems. Its Service And Field Options segment, €6.49B, underpins ecosystem lock-in and recurring income. In contrast, IPG relies on a more balanced mix; High Power Continuous Wave CW Lasers at $333M and Amplifiers, Laser Systems, and Service at $247M share the spotlight. IPG’s diversification mitigates concentration risk but lacks ASML’s infrastructure dominance.
Strengths and Weaknesses Comparison
This table compares the Strengths and Weaknesses of ASML Holding N.V. and IPG Photonics Corporation:
ASML Strengths
- High net margin at 29.42%
- ROE strong at 47.08%
- ROIC well above WACC at 34.14%
- Low debt-to-assets at 5.36%
- Diverse product segments with solid global sales
- Strong presence in China and Korea
IPGP Strengths
- Favorable quick ratio at 5.59 indicating liquidity
- Very low debt-to-assets at 0.78%
- Positive interest coverage ratio
- Product diversity in laser systems and services
- Balanced geographic sales including North America and Europe
ASML Weaknesses
- High PE at 38.33 and PB at 18.05 may indicate overvaluation
- Quick ratio below 1 at 0.79 suggests liquidity risk
- Dividend yield low at 0.69%
- WACC high at 10.08%
- Asset turnover moderate at 0.62
IPGP Weaknesses
- Negative profitability metrics: net margin -18.58%, ROE -8.97%, ROIC -9.97%
- High current ratio at 6.98 may suggest inefficient asset use
- Dividend yield nil
- Unfavorable asset turnover at 0.43
- Slightly unfavorable global ratio evaluation
ASML shows strong profitability and prudent leverage but faces valuation and liquidity concerns. IPGP struggles with profitability but maintains strong liquidity and low leverage, indicating contrasting strategic challenges.
The Moat Duel: Analyzing Competitive Defensibility
A structural moat is the only reliable shield protecting long-term profits from relentless competition erosion. Let’s examine how ASML and IPG Photonics stack up:
ASML Holding N.V.: Innovation-Driven Network Effects
ASML’s moat stems from advanced lithography technology and deep integration with chipmakers. This drives a strong ROIC of 24%, far exceeding WACC, reflecting durable profit margins and efficient capital use. Emerging EUV product lines and expanding semiconductor nodes in 2026 reinforce its fortress.
IPG Photonics Corporation: Specialized Cost Advantage
IPG relies on fiber laser technology as its moat, but unlike ASML, it suffers from declining profitability with ROIC well below WACC. Its competitive edge weakens amidst shrinking revenues and margin pressure. Growth opportunities in new markets are uncertain and face strong disruption risks.
Verdict: Innovation Network Effects vs. Eroding Cost Advantage
ASML’s moat is wider and deeper, sustained by technological complexity and customer lock-in, while IPG’s cost advantage deteriorates under competitive strain. ASML is clearly better equipped to defend and grow its market share in 2026.
Which stock offers better returns?
The past year shows ASML Holding N.V. surging with strong price gains and buyer dominance, while IPG Photonics Corporation posts modest growth amid neutral trading dynamics.
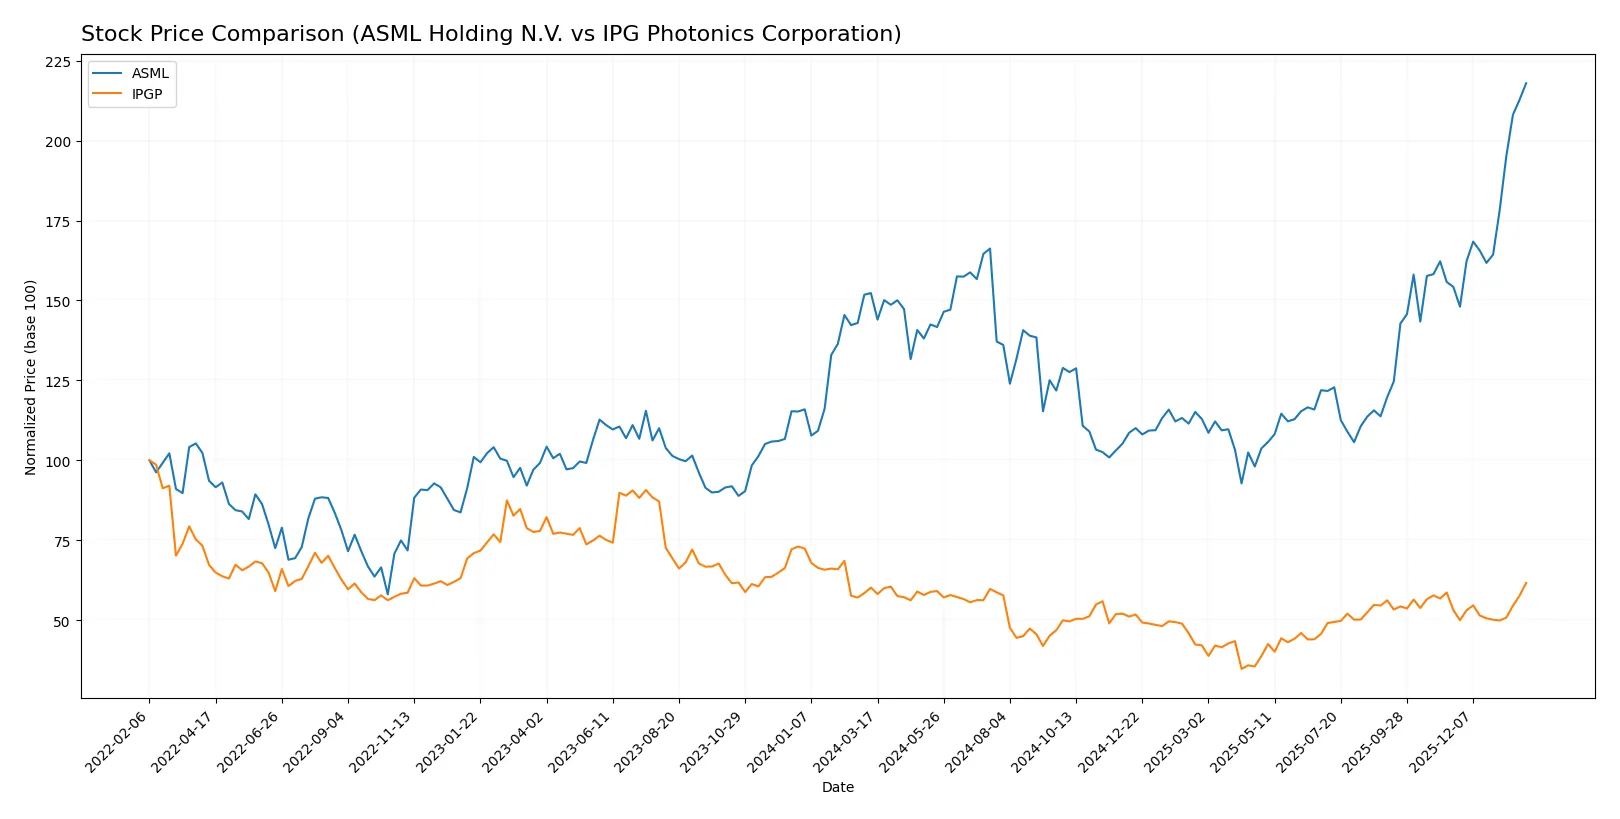
Trend Comparison
ASML’s stock rises 43.11% over 12 months, marking a bullish trend with accelerating momentum and notable volatility between 605.55 and 1423.0. Recent gains remain robust at 41.31%.
IPG Photonics’ stock advances 2.4% over 12 months, signaling a bullish but marginal trend with minimal volatility. Recent growth accelerates to 15.96%, though overall movement is less pronounced.
ASML outperforms IPG Photonics with significantly higher returns and stronger price momentum, delivering the top market performance over the past year.
Target Prices
Analysts present a clear consensus on target prices for ASML Holding N.V. and IPG Photonics Corporation.
| Company | Target Low | Target High | Consensus |
|---|---|---|---|
| ASML Holding N.V. | 1150 | 1911 | 1458.5 |
| IPG Photonics Corporation | 92 | 96 | 94 |
The consensus target for ASML sits about 2.5% above the current price of 1423, indicating moderate upside potential. IPG’s consensus target aligns closely with its current 92.41 price, signaling a near-term valuation plateau.

Don’t Let Luck Decide Your Entry Point
Optimize your entry points with our advanced ProRealTime indicators. You’ll get efficient buy signals with precise price targets for maximum performance. Start outperforming now!
How do institutions grade them?
The following tables summarize recent institutional grades for ASML Holding N.V. and IPG Photonics Corporation:
ASML Holding N.V. Grades
This table shows recent upgrades and maintained ratings by major financial institutions for ASML.
| Grading Company | Action | New Grade | Date |
|---|---|---|---|
| Barclays | upgrade | Overweight | 2026-01-29 |
| Wells Fargo | maintain | Overweight | 2026-01-29 |
| RBC Capital | maintain | Outperform | 2026-01-29 |
| Bernstein | maintain | Outperform | 2026-01-22 |
| KGI Securities | upgrade | Outperform | 2026-01-15 |
| Wells Fargo | maintain | Overweight | 2026-01-15 |
| JP Morgan | maintain | Overweight | 2026-01-14 |
| Bernstein | upgrade | Outperform | 2026-01-05 |
| B of A Securities | maintain | Buy | 2025-12-03 |
| JP Morgan | maintain | Overweight | 2025-12-01 |
IPG Photonics Corporation Grades
Below is a summary of recent institutional rating changes and maintains for IPG Photonics.
| Grading Company | Action | New Grade | Date |
|---|---|---|---|
| Citigroup | upgrade | Buy | 2025-11-05 |
| Bernstein | upgrade | Outperform | 2025-08-07 |
| Raymond James | maintain | Strong Buy | 2025-05-07 |
| CL King | upgrade | Buy | 2025-03-18 |
| Citigroup | maintain | Sell | 2025-02-18 |
| Stifel | maintain | Buy | 2025-02-12 |
| Needham | maintain | Hold | 2025-02-12 |
| Seaport Global | downgrade | Neutral | 2024-08-01 |
| Stifel | maintain | Buy | 2024-07-31 |
| Raymond James | maintain | Strong Buy | 2024-07-31 |
Which company has the best grades?
ASML Holding N.V. consistently receives strong “Overweight” and “Outperform” ratings from multiple leading institutions. IPG Photonics shows a mixed rating profile, including “Strong Buy” and “Buy” but also some “Sell” and “Neutral” grades. Investors may interpret ASML’s more uniform positive grades as a stronger signal of confidence.
Risks specific to each company
The following categories identify critical pressure points and systemic threats facing ASML Holding N.V. and IPG Photonics Corporation in the 2026 market environment:
1. Market & Competition
ASML Holding N.V.
- Dominates advanced lithography with strong pricing power but faces semiconductor cyclical risks.
IPG Photonics Corporation
- Operates in niche fiber lasers, but profitability struggles and market share pressure persist.
2. Capital Structure & Debt
ASML Holding N.V.
- Low debt-to-equity (0.14), manageable leverage, infinite interest coverage signals strong financial stability.
IPG Photonics Corporation
- Minimal debt (0.01 D/E), excellent interest coverage, but excessive liquidity suggests inefficient capital use.
3. Stock Volatility
ASML Holding N.V.
- Beta at 1.34 indicates above-market volatility, reflecting sensitivity to tech cycles.
IPG Photonics Corporation
- Beta near 1.02 shows market-like volatility, more stable but still exposed to sector swings.
4. Regulatory & Legal
ASML Holding N.V.
- Faces export controls and geopolitical tech restrictions impacting supply and sales.
IPG Photonics Corporation
- Subject to US regulations on advanced lasers, moderate compliance risk but less global trade exposure.
5. Supply Chain & Operations
ASML Holding N.V.
- Complex global supply chain with exposure to Asia; risks in rare materials and manufacturing bottlenecks.
IPG Photonics Corporation
- More localized operations in the US; supply chain less complex but dependent on specialized components.
6. ESG & Climate Transition
ASML Holding N.V.
- Increasing focus on sustainable manufacturing and reducing carbon footprint; faces investor scrutiny.
IPG Photonics Corporation
- ESG efforts less visible; potential risk if climate regulations tighten in manufacturing sectors.
7. Geopolitical Exposure
ASML Holding N.V.
- High exposure to Asia-Pacific tensions affecting sales and technology transfers.
IPG Photonics Corporation
- Primarily US-based with limited direct exposure but vulnerable to US-China tech decoupling.
Which company shows a better risk-adjusted profile?
ASML’s dominant market position and robust capital structure offset its higher volatility and geopolitical risks. IPG’s weaker profitability and operational challenges increase its risk despite lower leverage. ASML presents a more balanced risk-adjusted profile supported by its very strong Altman Z-Score (12.4) and Piotroski score (8). IPG’s financial distress signals and negative margins highlight significant downside risks despite a safe-zone Altman score (10.9). The critical risk for ASML lies in geopolitical and supply chain disruptions, while IPG struggles with sustained negative profitability. The data reveal ASML’s superior risk management and financial strength in a turbulent semiconductor environment.
Final Verdict: Which stock to choose?
ASML Holding N.V. excels as a cash-generating powerhouse with a durable competitive advantage. Its ability to sustain high returns on invested capital well above its cost signals strong value creation. A point of vigilance remains its stretched valuation multiples, which might temper upside. ASML suits aggressive growth portfolios that tolerate premium pricing for quality.
IPG Photonics Corporation’s strategic moat lies in its niche technological positioning and excellent liquidity profile, which offers relative safety amid operational challenges. However, its deteriorating profitability and value destruction raise caution flags. IPGP may appeal to value-conscious investors seeking turnaround potential and more conservative exposure.
If you prioritize durable competitive moats and superior profitability, ASML outshines as the compelling choice due to its consistent value creation and robust growth trajectory. However, if you seek potential undervalued opportunities with a stronger liquidity cushion, IPGP offers better stability despite its current financial headwinds. Both scenarios call for careful risk management given their distinct profiles.
Disclaimer: Investment carries a risk of loss of initial capital. The past performance is not a reliable indicator of future results. Be sure to understand risks before making an investment decision.
Go Further
I encourage you to read the complete analyses of ASML Holding N.V. and IPG Photonics Corporation to enhance your investment decisions: