Home > Comparison > Technology > ASML vs INTC
The strategic rivalry between ASML Holding N.V. and Intel Corporation defines the semiconductor sector’s innovation frontier. ASML excels as a capital-intensive producer of advanced lithography systems, while Intel operates as an integrated chip designer and manufacturer with a broad product portfolio. This contest pits ASML’s technological specialization against Intel’s scale and diversification. This analysis will clarify which business model presents the superior risk-adjusted return potential for a diversified portfolio in 2026.
Table of contents
Companies Overview
ASML Holding N.V. and Intel Corporation stand as titans in the semiconductor industry, shaping global technology trends.
ASML Holding N.V.: Advanced Semiconductor Equipment Leader
ASML dominates the semiconductor equipment market by developing cutting-edge lithography systems essential for chip manufacturing. Its revenue stems from selling extreme ultraviolet and deep ultraviolet lithography machines, supported by metrology and inspection tools. In 2026, ASML focuses strategically on expanding its technological edge in semiconductor nodes and enhancing customer support services.
Intel Corporation: Integrated Chipmaker and Platform Innovator
Intel is a major player in semiconductor design and manufacturing, generating revenue through platform products like CPUs and chipsets, alongside non-platform offerings such as accelerators and connectivity solutions. Its 2026 strategy emphasizes high-performance computing, AI-driven innovation, and expanding into automotive and cloud service verticals, reflecting its diversified technology footprint.
Strategic Collision: Similarities & Divergences
ASML’s specialized focus on equipment manufacturing contrasts with Intel’s integrated product and platform approach. Both compete indirectly in semiconductor advancement, but ASML targets chipmakers with precision tools, while Intel targets end-product markets. Their divergent models shape distinct risk profiles: ASML’s innovation-centric capital intensity versus Intel’s broad market exposure and vertical integration.
Income Statement Comparison
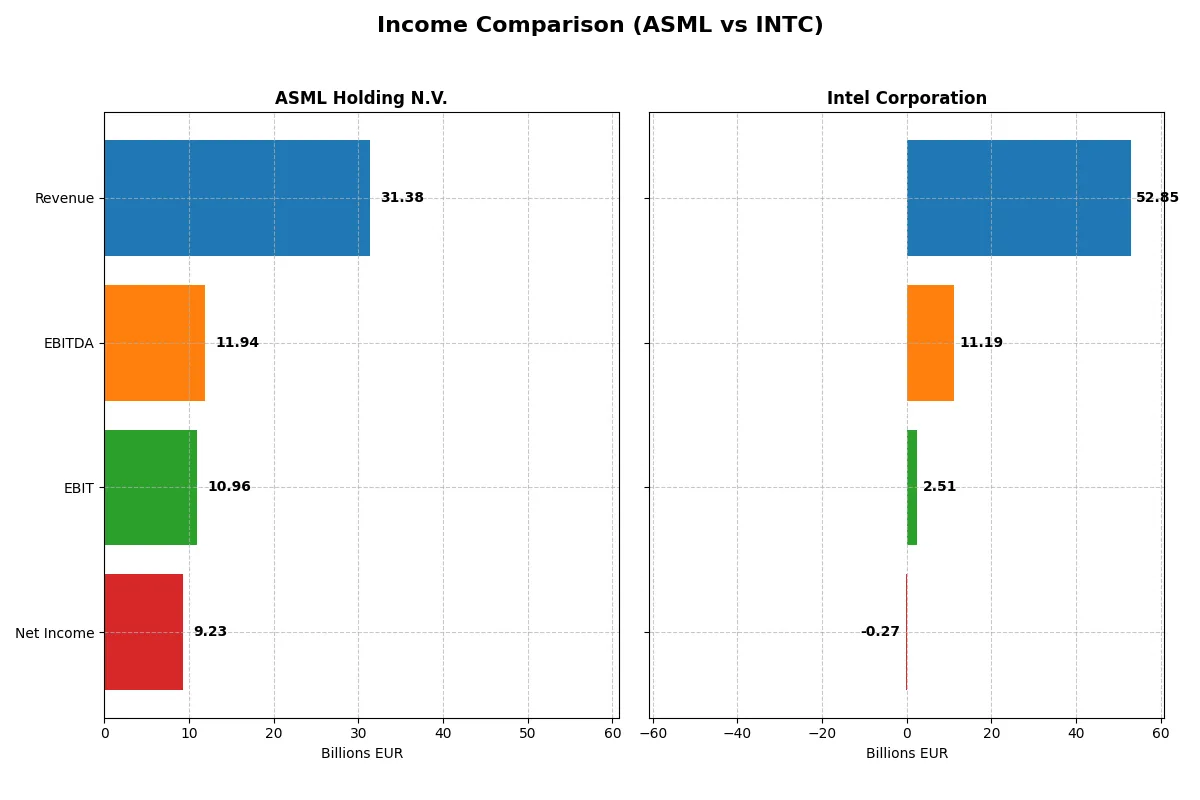
This data dissects the core profitability and scalability of both corporate engines to reveal who dominates the bottom line:
| Metric | ASML Holding N.V. (ASML) | Intel Corporation (INTC) |
|---|---|---|
| Revenue | 31.4B EUR | 52.9B USD |
| Cost of Revenue | 14.8B EUR | 34.4B USD |
| Operating Expenses | 5.7B EUR | 20.6B USD |
| Gross Profit | 16.6B EUR | 18.5B USD |
| EBITDA | 11.9B EUR | 11.2B USD |
| EBIT | 11.0B EUR | 2.5B USD |
| Interest Expense | 0 | 953M USD |
| Net Income | 9.2B EUR | -267M USD |
| EPS | 23.76 EUR | -0.082 USD |
| Fiscal Year | 2025 | 2025 |
Income Statement Analysis: The Bottom-Line Duel
This income statement comparison reveals which company runs the most efficient and profitable corporate engine amid recent market cycles.
ASML Holding N.V. Analysis
ASML’s revenue climbed steadily from 18.6B EUR in 2021 to 31.4B EUR in 2025, driven by robust demand and innovation. Net income surged from 5.9B EUR to 9.2B EUR, reflecting strong operational leverage. The company maintains a healthy gross margin above 52% and net margin near 29%, signaling exceptional cost control and margin expansion momentum in 2025.
Intel Corporation Analysis
Intel’s revenue declined from 79B USD in 2021 to 53B USD in 2025, reflecting sector headwinds and competitive pressures. Net income turned sharply negative in 2025 at -267M USD after peaking at 19.9B USD in 2021. Despite a gross margin near 35%, the net margin collapsed to -0.5%, indicating rising expenses and operational challenges undermining profitability and efficiency.
Margin Strength vs. Revenue Decline
ASML outperforms Intel with consistent revenue growth and robust margins, while Intel faces shrinking top-line and shrinking profitability. ASML’s expanding net income and high margins demonstrate superior capital allocation and competitive moat. Intel’s profile suits investors cautious of turnaround risk, whereas ASML appeals to those prioritizing steady profit growth and operational efficiency.
Financial Ratios Comparison
These vital ratios act as a diagnostic tool to expose the underlying fiscal health, valuation premiums, and capital efficiency of the companies analyzed:
| Ratios | ASML Holding N.V. (ASML) | Intel Corporation (INTC) |
|---|---|---|
| ROE | 47.1% | -0.23% |
| ROIC | 34.1% | -0.02% |
| P/E | 38.3 | -658.4 |
| P/B | 18.0 | 1.54 |
| Current Ratio | 1.26 | 2.02 |
| Quick Ratio | 0.79 | 1.65 |
| D/E | 0.14 | 0.41 |
| Debt-to-Assets | 5.4% | 22.0% |
| Interest Coverage | N/A | -2.23 |
| Asset Turnover | 0.62 | 0.25 |
| Fixed Asset Turnover | 3.81 | 0.50 |
| Payout ratio | 26.5% | 0.0% |
| Dividend yield | 0.69% | 0.00% |
| Fiscal Year | 2025 | 2025 |
Efficiency & Valuation Duel: The Vital Signs
Ratios act as a company’s DNA, exposing hidden risks and operational strengths that raw numbers alone cannot reveal.
ASML Holding N.V.
ASML boasts strong profitability with a 47.08% ROE and a robust 29.42% net margin. Its valuation appears stretched, reflected by a high 38.33 P/E and 18.05 P/B ratios. The company delivers modest dividends (0.69% yield) alongside significant R&D investment, fueling growth and shareholder value over time.
Intel Corporation
Intel struggles with negative profitability metrics, including a -0.23% ROE and a -0.51% net margin, signaling operational challenges. Despite a favorable low P/E due to losses, its valuation is more reasonable with a 1.54 P/B. Intel maintains a strong liquidity profile but offers no dividend, focusing instead on restructuring and R&D to regain competitiveness.
Premium Valuation vs. Operational Safety
ASML’s high profitability justifies its premium valuation but carries valuation risk. Intel shows weaker returns and operational stress but offers better liquidity and a lower valuation multiple. Investors seeking growth and operational excellence may prefer ASML, while those prioritizing financial safety might lean toward Intel’s cautious profile.
Which one offers the Superior Shareholder Reward?
I find ASML Holding N.V. and Intel Corporation adopt contrasting shareholder reward strategies in 2026. ASML pays a modest dividend yield near 0.7% with a sustainable payout ratio around 27%, supported by strong free cash flow of 27.4B EUR. It also executes disciplined buybacks, enhancing total return. Intel, by contrast, offers no dividend in 2025, focusing on reinvestment amid negative free cash flow (-1B USD) and weak profitability. Intel’s buyback activity is minimal or absent, reflecting financial strain. Historically in semiconductors, consistent dividends plus buybacks like ASML’s build compounding shareholder value. I see ASML’s distribution model as more sustainable and rewarding in 2026. Therefore, I judge ASML offers the superior total shareholder reward over Intel.
Comparative Score Analysis: The Strategic Profile
The radar chart reveals the fundamental DNA and trade-offs of ASML Holding N.V. and Intel Corporation, highlighting their financial strengths and weaknesses:
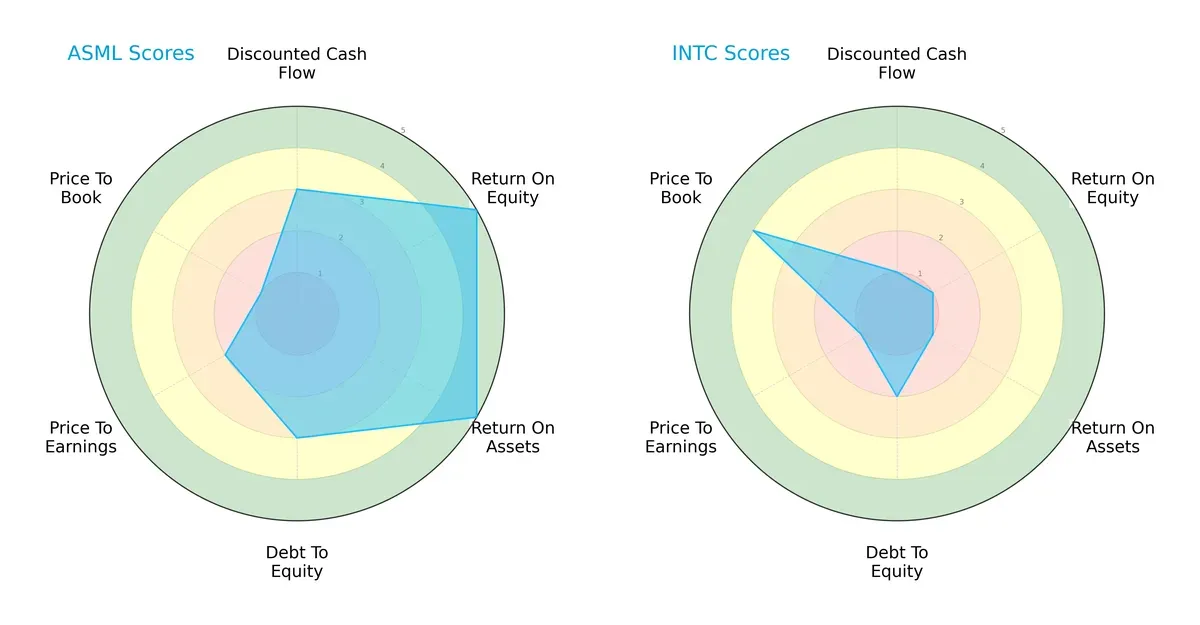
ASML shows a more balanced profile with very favorable ROE and ROA scores at 5 each, indicating efficient profit generation and asset utilization. Intel lags with very unfavorable scores of 1 in these areas, reflecting operational challenges. ASML’s moderate debt-to-equity score (3) contrasts with Intel’s slightly weaker 2, suggesting ASML manages leverage more prudently. Intel’s price-to-book score excels at 4, signaling potential undervaluation, while ASML’s 1 warns of overvaluation. Overall, ASML relies on operational excellence; Intel depends more on valuation appeal.
Bankruptcy Risk: Solvency Showdown
ASML’s Altman Z-Score of 12.4 places it firmly in the safe zone, while Intel’s 2.5 sits in the grey zone, implying moderate bankruptcy risk under current market conditions:
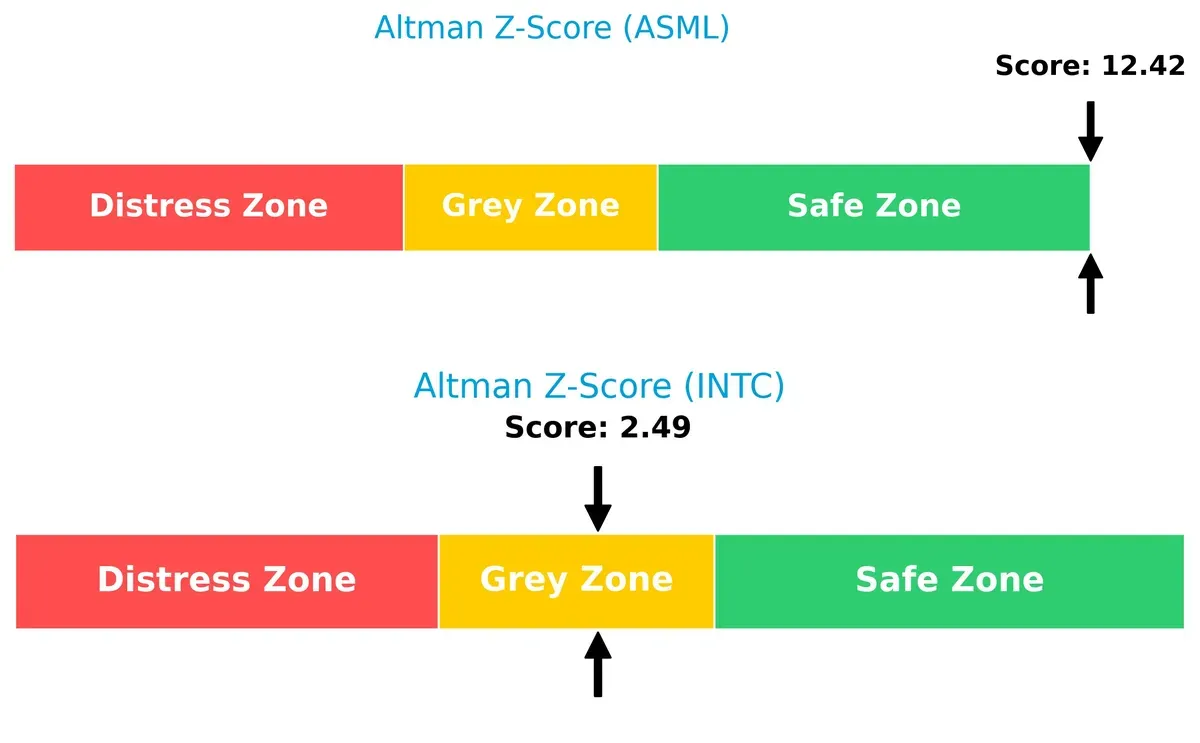
This large delta underlines ASML’s superior financial stability and lower default probability. Intel faces heightened solvency risks, requiring cautious monitoring.
Financial Health: Quality of Operations
ASML scores an 8 on the Piotroski F-Score, signaling very strong financial health compared to Intel’s average 4, which raises red flags:
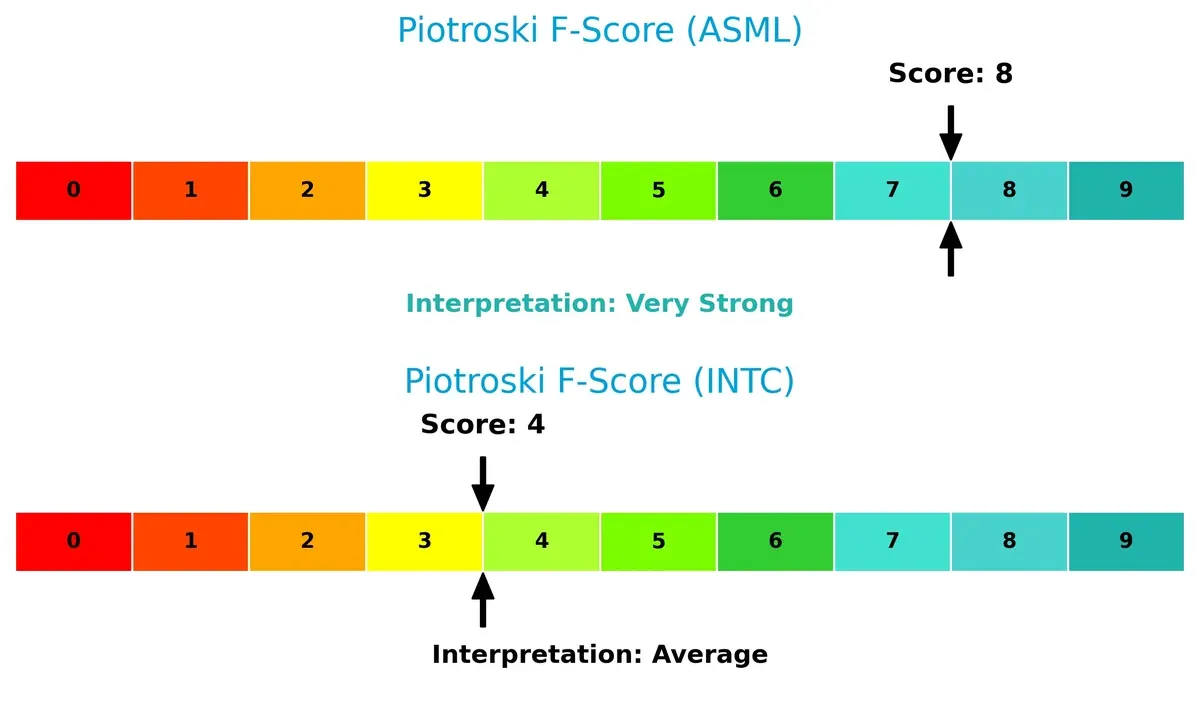
ASML’s high score reflects robust profitability, liquidity, and operational efficiency. Intel’s middling score indicates weaker fundamentals and potential internal stresses, suggesting caution for investors.
How are the two companies positioned?
This section dissects ASML and Intel’s operational DNA by comparing revenue distribution and internal dynamics. The goal is to confront their economic moats and determine which model offers the most resilient competitive advantage today.
Revenue Segmentation: The Strategic Mix
This visual comparison dissects how ASML Holding N.V. and Intel Corporation diversify their income streams and reveals where their primary sector bets lie:
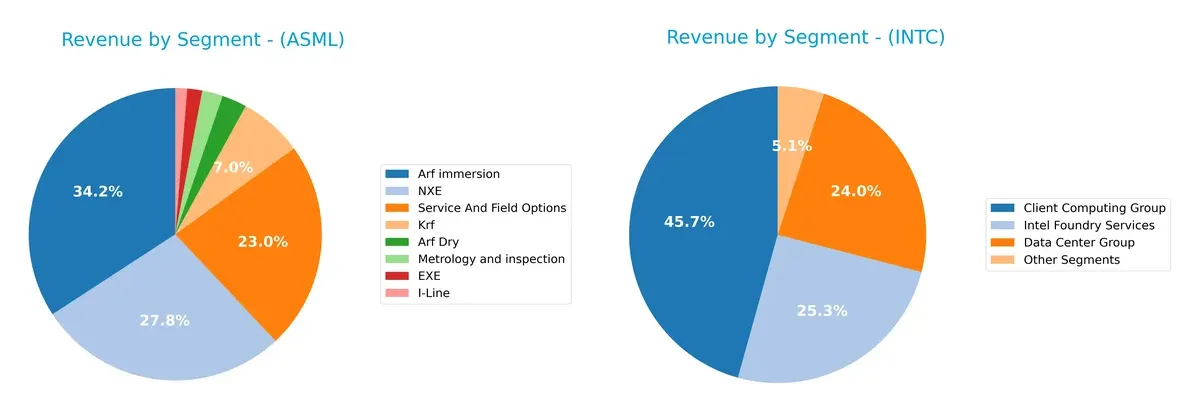
ASML anchors revenue in its Arf immersion (9.67B) and NXE (7.86B) segments, complemented by strong Service and Field Options (6.49B). This mix shows a focused high-tech equipment ecosystem. Intel dwarfs with a broader spread: Client Computing Group (32.2B), Intel Foundry Services (17.8B), and Data Center Group (16.9B). Intel’s diversification reduces concentration risk but requires managing multiple market dynamics simultaneously.
Strengths and Weaknesses Comparison
This table compares the strengths and weaknesses of ASML Holding N.V. and Intel Corporation:
ASML Strengths
- High profitability with net margin 29.42%
- Strong ROE 47.08% and ROIC 34.14%
- Low debt-to-assets 5.36% supports financial stability
- Diverse product segments including EUV and metrology
- Significant global presence in China, Korea, Taiwan, and US
Intel Strengths
- Strong liquidity with current ratio 2.02 and quick ratio 1.65
- Favorable debt levels with D/E 0.41 and debt/assets 22.03%
- Large revenue base with diversified segments like Computing and Data Center
- Broad geographic reach with major sales in US, China, Singapore, Taiwan
ASML Weaknesses
- High valuation multiples (PE 38.33, PB 18.05) may pressure returns
- Quick ratio 0.79 signals potential short-term liquidity concerns
- WACC 10.08% exceeds ROIC, indicating capital cost challenges
- Dividend yield low at 0.69%
- Asset turnover moderate at 0.62
Intel Weaknesses
- Negative profitability metrics with net margin -0.51%, ROE -0.23%, ROIC -0.02%
- Weak asset turnover 0.25 and fixed asset turnover 0.5
- No dividend yield
- Interest coverage moderate at 2.63
- PE ratio negative but status marked favorable
ASML’s strengths lie in high profitability and low leverage, but its valuation and some liquidity ratios raise caution. Intel shows strong liquidity and diversified revenues but faces profitability and efficiency challenges, impacting its capital returns and dividend policy.
The Moat Duel: Analyzing Competitive Defensibility
A structural moat is the only thing protecting long-term profits from the relentless erosion of competition. Let’s break down the competitive moats of ASML and Intel:
ASML Holding N.V.: Monopoly on Extreme Ultraviolet Lithography
ASML’s primary moat stems from its near-monopoly in extreme ultraviolet (EUV) lithography systems. This manifests in a stellar ROIC exceeding WACC by 24%, with robust margin stability near 30%. In 2026, expanding EUV adoption and new metrology tech deepen its moat, reinforcing dominance.
Intel Corporation: Legacy Scale with Innovation Challenges
Intel relies on scale and integrated manufacturing as its moat, contrasting ASML’s niche technology advantage. However, Intel’s ROIC lags below WACC by nearly 9%, signaling value destruction. Its 2026 outlook hinges on successful innovation in new compute platforms to arrest declining profitability and restore moat strength.
Monopoly Precision vs. Scale Struggles: The Semiconductors’ Moat Face-Off
ASML’s moat is both wider and deeper, supported by technology leadership and sustained value creation. Intel’s legacy scale offers some protection but suffers from shrinking returns and value loss. ASML is better equipped to defend and expand its market share amid intensifying competition.
Which stock offers better returns?
The past year shows strong price gains for both ASML Holding N.V. and Intel Corporation, with ASML exhibiting a notably sharper upward trajectory and higher trading activity.
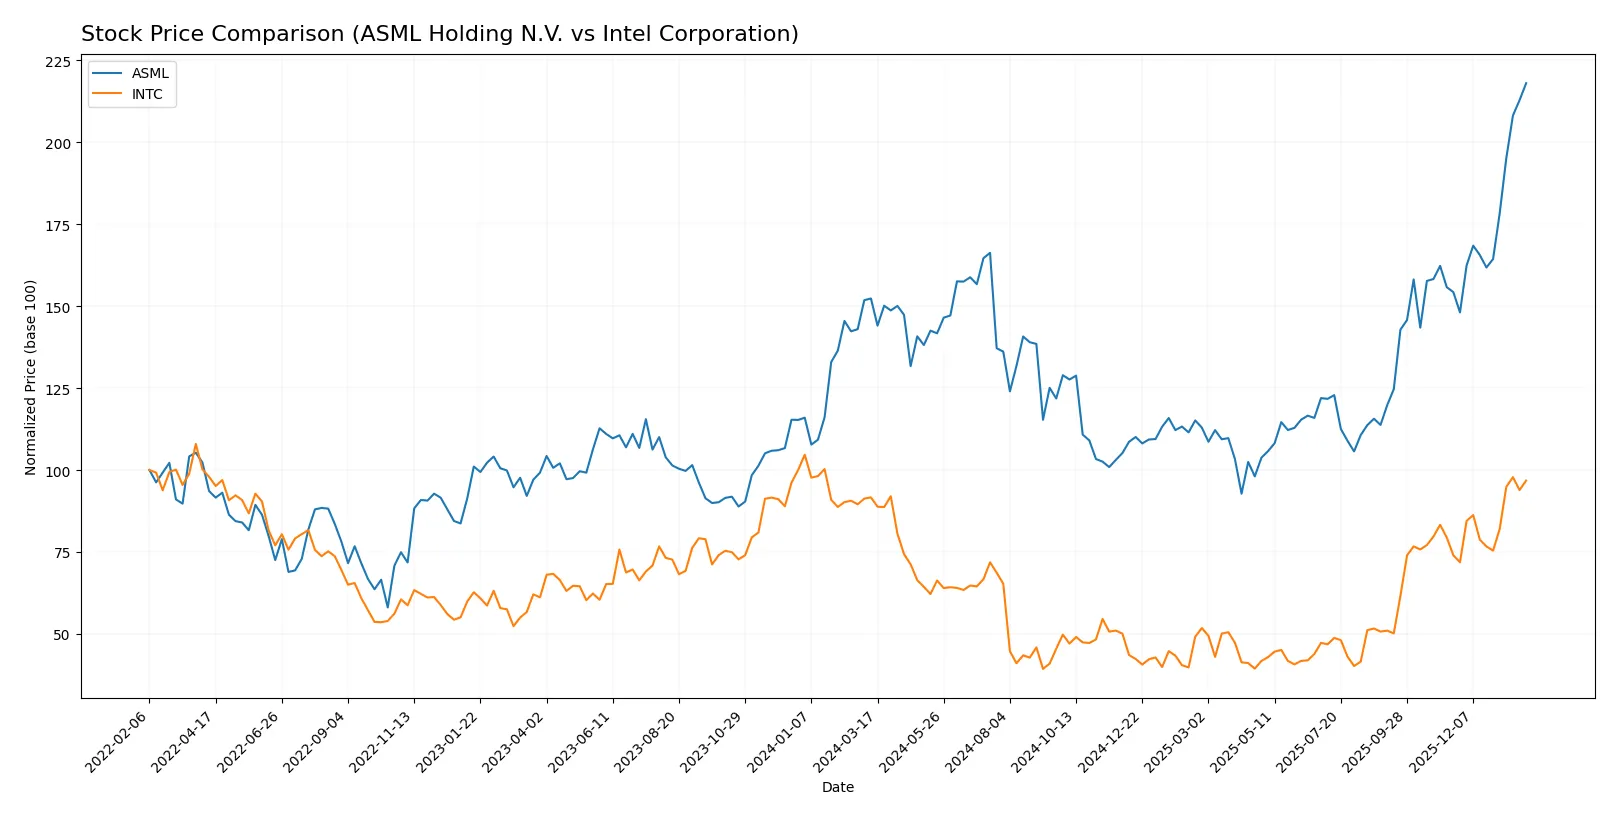
Trend Comparison
ASML Holding N.V. gained 43.11% over the past year, marking a bullish trend with accelerating momentum and notable volatility, peaking at 1423 and bottoming at 605.55.
Intel Corporation rose 5.61% in the same period, also bullish with acceleration but far less volatile, ranging from 18.89 to 46.96.
ASML’s trend outpaces Intel’s, delivering substantially higher market returns and stronger recent performance.
Target Prices
Analysts present a broad but generally optimistic target price consensus for ASML Holding N.V. and Intel Corporation.
| Company | Target Low | Target High | Consensus |
|---|---|---|---|
| ASML Holding N.V. | 1,150 | 1,911 | 1,458.5 |
| Intel Corporation | 20 | 66 | 46.95 |
ASML’s consensus target of 1,458.5 slightly exceeds its current price of 1,423, indicating modest upside potential. Intel’s consensus target of 46.95 aligns closely with its current price near 46.47, suggesting a balanced risk-reward profile.

Don’t Let Luck Decide Your Entry Point
Optimize your entry points with our advanced ProRealTime indicators. You’ll get efficient buy signals with precise price targets for maximum performance. Start outperforming now!
How do institutions grade them?
ASML Holding N.V. Grades
The following table shows recent grade updates from major grading firms for ASML Holding N.V.:
| Grading Company | Action | New Grade | Date |
|---|---|---|---|
| Barclays | Upgrade | Overweight | 2026-01-29 |
| Wells Fargo | Maintain | Overweight | 2026-01-29 |
| RBC Capital | Maintain | Outperform | 2026-01-29 |
| Bernstein | Maintain | Outperform | 2026-01-22 |
| KGI Securities | Upgrade | Outperform | 2026-01-15 |
| Wells Fargo | Maintain | Overweight | 2026-01-15 |
| JP Morgan | Maintain | Overweight | 2026-01-14 |
| Bernstein | Upgrade | Outperform | 2026-01-05 |
| B of A Securities | Maintain | Buy | 2025-12-03 |
| JP Morgan | Maintain | Overweight | 2025-12-01 |
Intel Corporation Grades
The following table shows recent grade updates from major grading firms for Intel Corporation:
| Grading Company | Action | New Grade | Date |
|---|---|---|---|
| RBC Capital | Maintain | Sector Perform | 2026-01-23 |
| Wedbush | Maintain | Neutral | 2026-01-23 |
| Stifel | Maintain | Hold | 2026-01-23 |
| UBS | Maintain | Neutral | 2026-01-23 |
| Keybanc | Maintain | Overweight | 2026-01-23 |
| Roth Capital | Maintain | Neutral | 2026-01-23 |
| Needham | Maintain | Hold | 2026-01-23 |
| Morgan Stanley | Maintain | Equal Weight | 2026-01-23 |
| Benchmark | Maintain | Buy | 2026-01-23 |
| Evercore ISI Group | Maintain | In Line | 2026-01-23 |
Which company has the best grades?
ASML Holding N.V. consistently receives higher grades, including multiple “Outperform” and “Overweight” ratings. Intel’s grades cluster around “Hold,” “Neutral,” and “Sector Perform.” This disparity may influence investor confidence and portfolio positioning.
Risks specific to each company
The following categories identify the critical pressure points and systemic threats facing both firms in the 2026 market environment:
1. Market & Competition
ASML Holding N.V.
- Dominates advanced lithography with strong technological moat but faces saturation risk in mature semiconductor markets.
Intel Corporation
- Struggles with profitability and innovation pace; intense competition from TSMC and AMD pressures market share.
2. Capital Structure & Debt
ASML Holding N.V.
- Low debt-to-equity ratio (0.14) signals conservative leverage and financial flexibility.
Intel Corporation
- Moderate leverage (0.41) with higher debt-to-assets ratio (22%); manageable but pressure on interest coverage ratio.
3. Stock Volatility
ASML Holding N.V.
- Beta of 1.34 reflects higher sensitivity to market swings but supported by solid fundamentals.
Intel Corporation
- Beta of 1.35 indicates similar volatility; compounded by weaker earnings and uncertain outlook.
4. Regulatory & Legal
ASML Holding N.V.
- Exposure to export controls on EUV technology and geopolitical trade restrictions.
Intel Corporation
- Faces regulatory scrutiny in US and global antitrust investigations, impacting strategic flexibility.
5. Supply Chain & Operations
ASML Holding N.V.
- Complex global supply chain vulnerable to component shortages but benefits from strong supplier relationships.
Intel Corporation
- Operational challenges in manufacturing scale-up and transitioning to new process nodes; supply chain disruptions possible.
6. ESG & Climate Transition
ASML Holding N.V.
- Advanced sustainability initiatives but high energy use in semiconductor manufacturing remains a concern.
Intel Corporation
- Faces pressure to improve ESG metrics amid growing investor focus; recent efforts underway but progress uneven.
7. Geopolitical Exposure
ASML Holding N.V.
- Significant exposure to Asia-Pacific tensions affecting sales and technology transfer.
Intel Corporation
- US-centric operations buffer some risk, but global supply chains and markets exposed to geopolitical volatility.
Which company shows a better risk-adjusted profile?
ASML’s dominant market position and conservative capital structure deliver a safer risk-adjusted profile. Intel’s profitability woes and operational hurdles increase its risk despite stronger liquidity. ASML’s Altman Z-Score of 12.4 confirms robust financial health versus Intel’s 2.5 in the grey zone. The key risk for ASML lies in geopolitical constraints on technology exports, while Intel’s primary risk is persistent negative profitability undermining financial stability. The widening gap in profitability metrics highlights why ASML commands a more resilient risk posture today.
Final Verdict: Which stock to choose?
ASML’s superpower lies in its durable competitive advantage, driven by a consistently growing ROIC well above its cost of capital. It operates like a high-margin cash machine in the semiconductor equipment space. A point of vigilance is its premium valuation, which demands patience from investors. This stock suits aggressive growth portfolios seeking long-term value creation.
Intel’s strength is its strong balance sheet and ongoing investment in R&D, which supports a strategic moat based on technological pivot and scale. Compared to ASML, it offers better liquidity and financial safety but struggles with profitability and value destruction. Intel fits well in GARP portfolios aiming for turnaround potential with moderate risk tolerance.
If you prioritize sustained value creation and high-quality returns, ASML outshines Intel due to its robust economic moat and operational excellence. However, if you seek a potentially undervalued name with a safer balance sheet and turnaround upside, Intel offers better stability despite current headwinds. Both cases require careful risk assessment aligned with your investment horizon.
Disclaimer: Investment carries a risk of loss of initial capital. The past performance is not a reliable indicator of future results. Be sure to understand risks before making an investment decision.
Go Further
I encourage you to read the complete analyses of ASML Holding N.V. and Intel Corporation to enhance your investment decisions: