Home > Comparison > Technology > ASML vs GFS
The strategic rivalry between ASML Holding N.V. and GLOBALFOUNDRIES Inc. shapes the semiconductor industry’s future. ASML operates as a capital-intensive producer of advanced lithography systems, while GLOBALFOUNDRIES focuses on wafer fabrication as a foundry service provider. This analysis contrasts their operational models and growth trajectories. I will determine which company offers a superior risk-adjusted return, guiding investors seeking robust exposure within the dynamic technology sector.
Table of contents
Companies Overview
ASML Holding N.V. and GLOBALFOUNDRIES Inc. both define the cutting edge of the semiconductor industry.
ASML Holding N.V.: Pioneer in Semiconductor Lithography
ASML dominates advanced semiconductor equipment, generating revenue through lithography systems crucial for chip production. Its core competitive advantage lies in extreme ultraviolet (EUV) lithography, enabling smaller, more powerful chips. In 2026, ASML sharpens its focus on refining EUV technology and expanding customer support services globally.
GLOBALFOUNDRIES Inc.: Leading Semiconductor Foundry
GLOBALFOUNDRIES specializes in integrated circuit manufacturing, serving diverse electronics markets with wafer fabrication and device production. Its revenue engine depends on high-volume fabrication of microprocessors and RF modems. The company prioritizes scaling its mainstream technologies and enhancing fabrication capacity to meet rising demand.
Strategic Collision: Similarities & Divergences
Both companies operate in semiconductors but diverge sharply: ASML supplies capital-intensive equipment, while GLOBALFOUNDRIES runs fabrication plants. Their primary battleground is advanced node technology, where lithography and wafer fabrication intersect. ASML offers a high-moat, technology-driven profile; GLOBALFOUNDRIES presents capital-heavy execution risks with volume-driven returns.
Income Statement Comparison
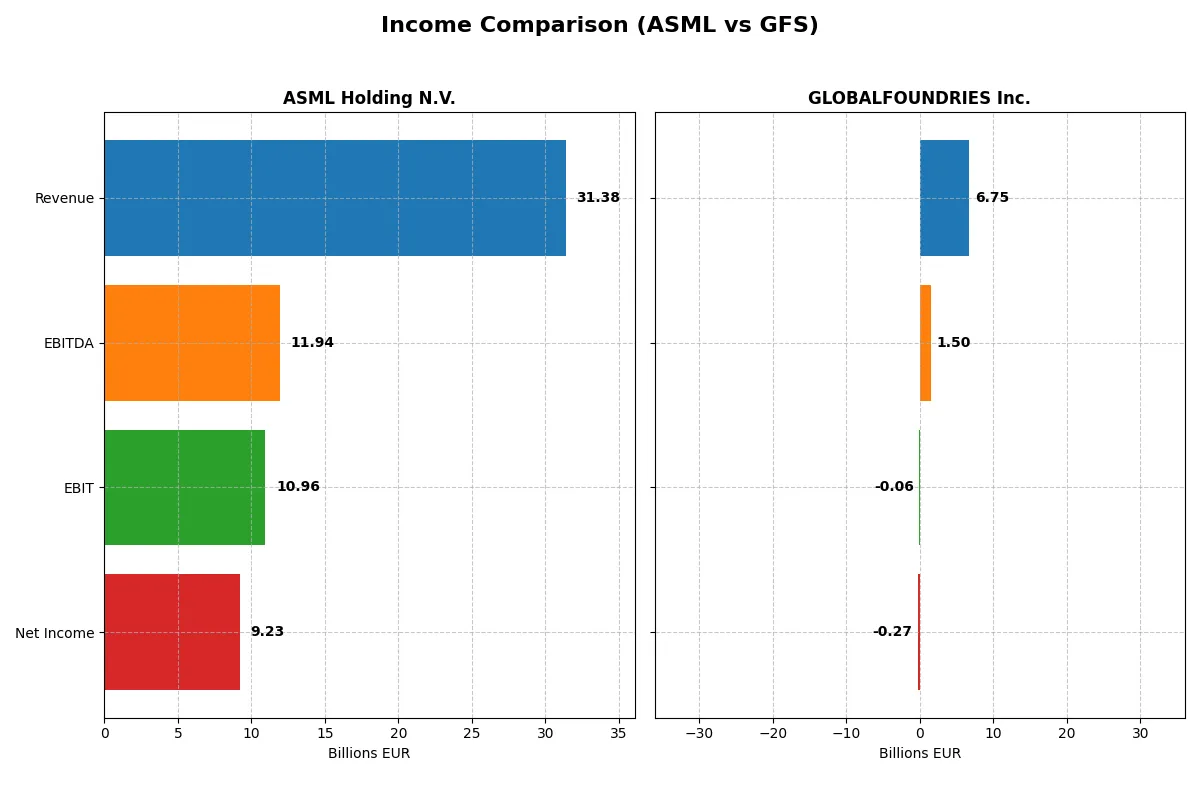
The following data dissects the core profitability and scalability of both corporate engines to reveal who dominates the bottom line:
| Metric | ASML Holding N.V. (ASML) | GLOBALFOUNDRIES Inc. (GFS) |
|---|---|---|
| Revenue | 31.4B EUR | 6.75B USD |
| Cost of Revenue | 14.8B EUR | 5.10B USD |
| Operating Expenses | 5.72B EUR | 1.87B USD |
| Gross Profit | 16.6B EUR | 1.65B USD |
| EBITDA | 11.9B EUR | 1.50B USD |
| EBIT | 11.0B EUR | -64M USD |
| Interest Expense | 0 EUR | 145M USD |
| Net Income | 9.23B EUR | -265M USD |
| EPS | 23.76 EUR | -0.48 USD |
| Fiscal Year | 2025 | 2024 |
Income Statement Analysis: The Bottom-Line Duel
This income statement comparison uncovers which company leverages its revenue into efficient profitability and sustainable earnings growth.
ASML Holding N.V. Analysis
ASML exhibits a strong revenue climb, reaching €31.4B in 2025 with net income topping €9.2B. Its gross margin holds at a robust 52.8%, and net margin stands near 29.4%, signaling superior cost control. The 2025 year shows accelerating EBIT growth (+19%) and EPS up 23%, reflecting powerful operational momentum.
GLOBALFOUNDRIES Inc. Analysis
GLOBALFOUNDRIES’ revenue declines 8.7% to $6.75B in 2024, with a net loss of $265M eroding profitability. Gross margin remains modest at 24.5%, while net margin turns negative at -3.9%, highlighting cost pressures. The latest year reveals a sharp EBIT drop, signaling operational challenges and weakening earnings power.
Margin Strength vs. Revenue Scale
ASML dominates with high and expanding margins, translating revenue growth into substantial net profits. GLOBALFOUNDRIES struggles with shrinking revenue and losses, undermining its bottom line. For investors, ASML’s profile offers superior efficiency and earnings reliability in a competitive sector.
Financial Ratios Comparison
These vital ratios act as a diagnostic tool to expose the underlying fiscal health, valuation premiums, and capital efficiency of the companies analyzed:
| Ratios | ASML Holding N.V. (ASML) | GLOBALFOUNDRIES Inc. (GFS) |
|---|---|---|
| ROE | 47.1% | -2.5% |
| ROIC | 34.1% | -1.5% |
| P/E | 38.3 | -89.5 |
| P/B | 18.0 | 2.20 |
| Current Ratio | 1.26 | 2.11 |
| Quick Ratio | 0.79 | 1.57 |
| D/E (Debt-to-Equity) | 0.14 | 0.22 |
| Debt-to-Assets | 5.4% | 13.8% |
| Interest Coverage | 0 | -1.48 |
| Asset Turnover | 0.62 | 0.40 |
| Fixed Asset Turnover | 3.81 | 0.82 |
| Payout Ratio | 26.5% | 0% |
| Dividend Yield | 0.69% | 0% |
| Fiscal Year | 2025 | 2024 |
Efficiency & Valuation Duel: The Vital Signs
Financial ratios act as a company’s DNA, revealing hidden risks and operational excellence beneath surface-level metrics.
ASML Holding N.V.
ASML demonstrates robust profitability with a 47.08% ROE and a strong 29.42% net margin, signaling operational efficiency. Its valuation appears stretched, with a high P/E of 38.33 and P/B of 18.05. Shareholder returns include a modest 0.69% dividend yield, complemented by substantial reinvestment in R&D, reflecting growth focus.
GLOBALFOUNDRIES Inc.
GLOBALFOUNDRIES struggles with negative profitability metrics, including a -2.46% ROE and -3.93% net margin, indicating operational challenges. Its valuation is low, with a favorable negative P/E, suggesting market skepticism. The company pays no dividend, prioritizing cash flow management and modest reinvestment amid a difficult earnings environment.
Premium Valuation vs. Operational Safety
ASML balances strong profitability and growth investment despite a premium valuation, while GLOBALFOUNDRIES faces operational headwinds but maintains liquidity and lower valuation. Investors seeking operational excellence and innovation may favor ASML; risk-tolerant profiles seeking turnaround potential might monitor GLOBALFOUNDRIES.
Which one offers the Superior Shareholder Reward?
I compare ASML Holding N.V. and GLOBALFOUNDRIES Inc. on dividend yield, payout ratios, and share buybacks for 2026. ASML pays a 0.97% dividend yield with a sustainable 34% payout covered 3x by free cash flow. It also executes robust buybacks, enhancing total returns. GLOBALFOUNDRIES pays no dividend, focusing on reinvestment amid profitability challenges and modest buybacks. ASML’s balanced distribution and strong free cash flow underpin a more attractive, sustainable shareholder reward than GFS’s growth-first but riskier profile. I favor ASML for superior total return and capital allocation discipline in 2026.
Comparative Score Analysis: The Strategic Profile
The radar chart reveals the fundamental DNA and trade-offs of ASML Holding N.V. and GLOBALFOUNDRIES Inc., highlighting their core financial strengths and vulnerabilities:
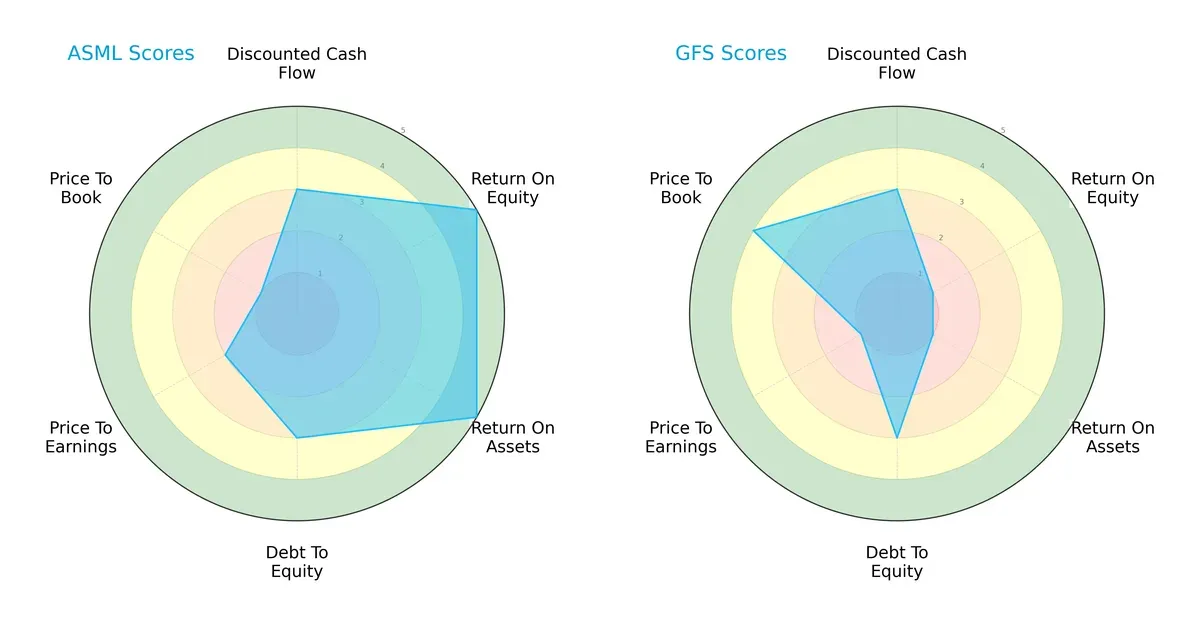
ASML exhibits a more balanced profile with very favorable ROE and ROA scores (5 each), showing operational efficiency and asset utilization. It carries moderate debt risk and decent DCF scores but suffers in valuation metrics, particularly price-to-book. Conversely, GLOBALFOUNDRIES relies heavily on its favorable price-to-book score but lags significantly in profitability (ROE and ROA scores of 1). ASML’s diversified strengths make it a more robust choice in this sector.
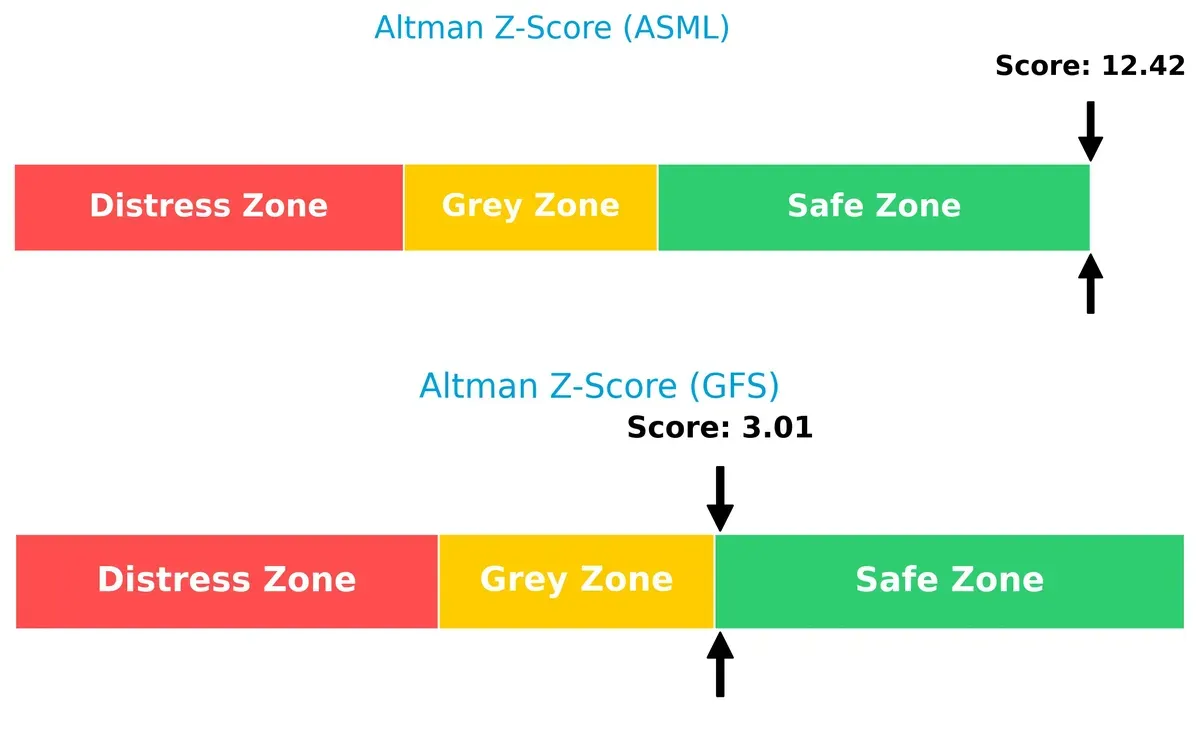
Bankruptcy Risk: Solvency Showdown
ASML’s Altman Z-Score of 12.4 far exceeds GLOBALFOUNDRIES’ 3.0, indicating a much safer financial position. Both companies are in the safe zone, but ASML’s score suggests significantly lower bankruptcy risk this cycle:
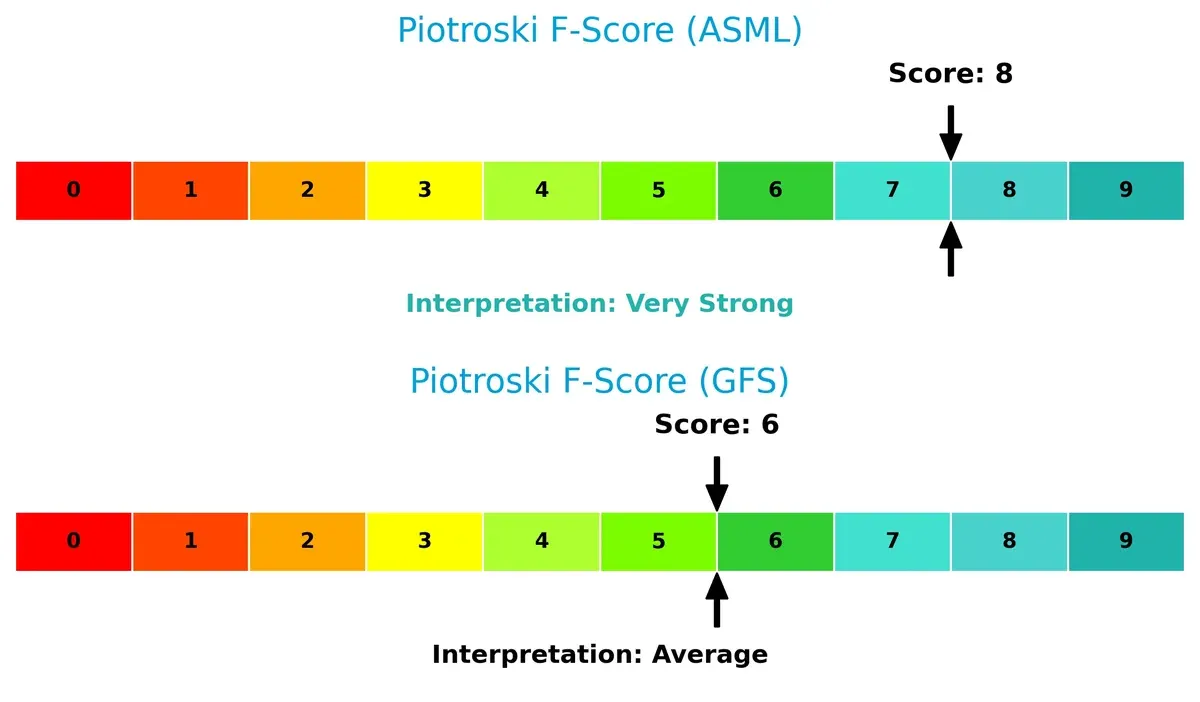
Financial Health: Quality of Operations
ASML’s Piotroski F-Score of 8 signals very strong financial health, reflecting solid profitability, leverage, and operational efficiency. GLOBALFOUNDRIES, with a score of 6, is average and may carry red flags in some internal metrics compared to ASML’s superior quality:
How are the two companies positioned?
This section dissects the operational DNA of ASML and GFS by comparing their revenue distribution by segment and internal dynamics. The goal is to confront their economic moats to identify which model offers the most resilient competitive advantage today.
Revenue Segmentation: The Strategic Mix
This visual comparison dissects how ASML Holding N.V. and GLOBALFOUNDRIES Inc. diversify their income streams and where their primary sector bets lie:
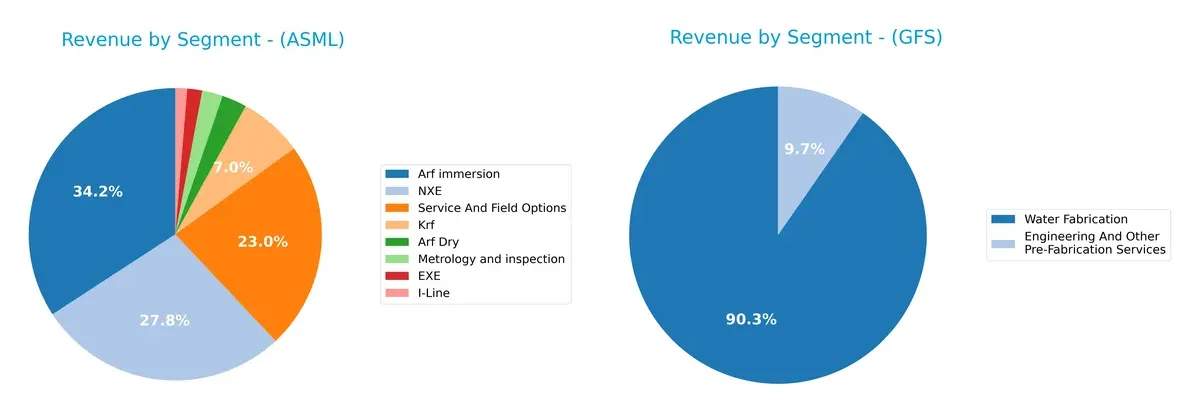
ASML shows a highly diversified portfolio with notable contributions from Arf immersion (9.67B), NXE (7.86B), and Service And Field Options (6.49B). In contrast, GLOBALFOUNDRIES relies heavily on Water Fabrication (6.10B), dwarfing its Engineering and Other Pre-Fabrication Services (652M). ASML’s broad product mix reduces concentration risk and supports ecosystem lock-in, while GLOBALFOUNDRIES’ reliance on one segment exposes it to market cyclicality and operational risks.
Strengths and Weaknesses Comparison
This table compares the Strengths and Weaknesses of ASML and GFS based on diversification, profitability, financials, innovation, global presence, and market share:
ASML Strengths
- Strong profitability with 29.42% net margin
- High ROE at 47.08%
- Favorable ROIC at 34.14%
- Low debt-to-assets at 5.36%
- Diverse product portfolio across lithography systems
- Global presence with significant sales in China, Korea, and Taiwan
GFS Strengths
- Strong liquidity with current ratio 2.11 and quick ratio 1.57
- Favorable debt metrics with debt-to-assets 13.81%
- Large U.S. market share in water fabrication
- Steady revenue from engineering and fabrication services
ASML Weaknesses
- Elevated valuation multiples with PE 38.33 and PB 18.05
- Quick ratio below 1 at 0.79
- WACC higher than ROIC at 10.08%
- Dividend yield low at 0.69%
- Asset turnover moderate at 0.62
GFS Weaknesses
- Negative profitability metrics: net margin -3.93%, ROE -2.46%, ROIC -1.47%
- Negative interest coverage at -0.44
- Low asset turnover at 0.4 and fixed asset turnover 0.82
- No dividend yield
- Concentrated revenue mainly in U.S. market
ASML’s strengths lie in its superior profitability, innovation, and diversified global sales. GFS shows strong liquidity and focused market presence but suffers from weak profitability and asset utilization. These factors shape each company’s strategic priorities and risk profiles.
The Moat Duel: Analyzing Competitive Defensibility
A structural moat is the only reliable shield protecting long-term profits from relentless competitive pressure. Here’s how ASML and GLOBALFOUNDRIES stack up:
ASML Holding N.V.: Technological Innovation & Scale Moat
ASML’s dominant moat stems from proprietary lithography technology and massive scale, reflected in its stellar 24% ROIC above WACC. Stable 53% gross margins and expanding revenue signal deepening moat through advanced EUV systems in 2026.
GLOBALFOUNDRIES Inc.: Manufacturing Scale with Margin Pressure
GLOBALFOUNDRIES competes on manufacturing scale but lacks ASML’s tech edge. Its negative ROIC versus WACC indicates value destruction despite a recent ROIC uptrend. Margin pressures and revenue decline challenge its competitive position in 2026.
Verdict: Technological Leadership vs. Scale Efficiency
ASML’s moat is wider and deeper, driven by irreplaceable technology and strong capital returns. GLOBALFOUNDRIES, while improving, remains vulnerable to margin erosion and market share loss. ASML is better equipped to defend leadership long term.
Which stock offers better returns?
The stock price comparison over the past year reveals ASML Holding N.V. surged 43%, showing accelerating bullish momentum, while GLOBALFOUNDRIES Inc. declined nearly 20%, despite recent partial recovery.
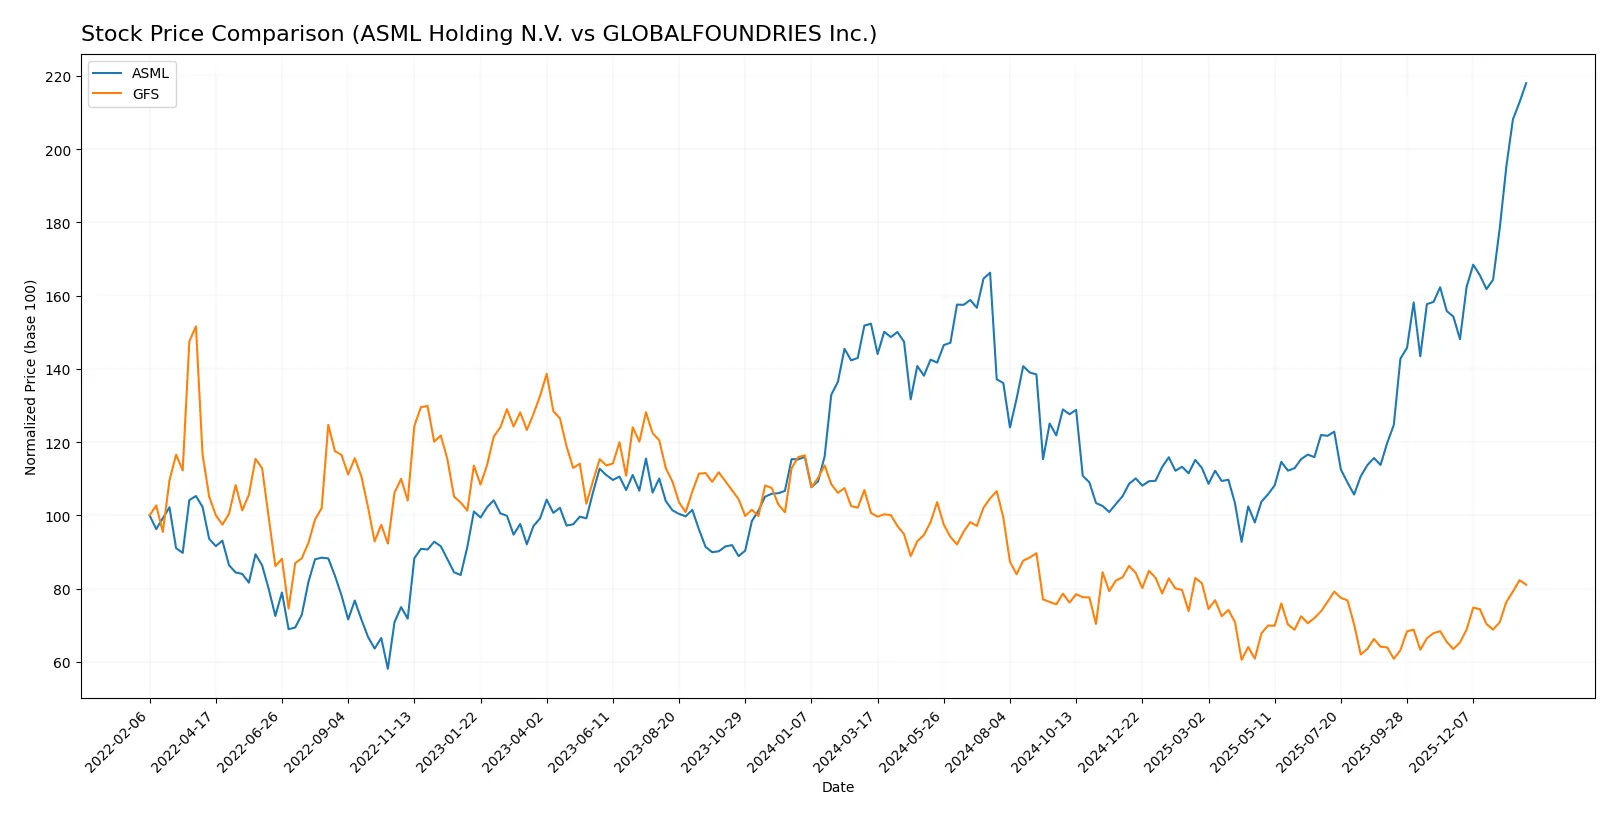
Trend Comparison
ASML Holding N.V. posted a strong 43.11% price increase over 12 months, signaling a bullish trend with accelerating gains and high volatility, peaking at 1423.0.
GLOBALFOUNDRIES Inc. experienced a 19.48% price drop over the same period, reflecting a bearish trend with accelerating decline and limited volatility, bottoming at 31.54.
ASML’s substantial positive return outperforms GLOBALFOUNDRIES, which delivered a negative total return despite recent partial price rebound.
Target Prices
Analysts present a clear target price range reflecting cautious optimism for both ASML Holding N.V. and GLOBALFOUNDRIES Inc.
| Company | Target Low | Target High | Consensus |
|---|---|---|---|
| ASML Holding N.V. | 1150 | 1911 | 1458.5 |
| GLOBALFOUNDRIES Inc. | 37 | 40 | 38.5 |
The ASML consensus target of 1458.5 sits slightly above its current 1423 price, signaling moderate upside potential. GLOBALFOUNDRIES’ consensus target of 38.5 is below its current 42.2 price, suggesting possible market overvaluation or near-term downside risk.

Don’t Let Luck Decide Your Entry Point
Optimize your entry points with our advanced ProRealTime indicators. You’ll get efficient buy signals with precise price targets for maximum performance. Start outperforming now!
How do institutions grade them?
The following tables summarize recent institutional grades for ASML Holding N.V. and GLOBALFOUNDRIES Inc.:
ASML Holding N.V. Grades
This table shows recent grading actions from established institutions for ASML Holding N.V.:
| Grading Company | Action | New Grade | Date |
|---|---|---|---|
| Barclays | Upgrade | Overweight | 2026-01-29 |
| Wells Fargo | Maintain | Overweight | 2026-01-29 |
| RBC Capital | Maintain | Outperform | 2026-01-29 |
| Bernstein | Maintain | Outperform | 2026-01-22 |
| KGI Securities | Upgrade | Outperform | 2026-01-15 |
| Wells Fargo | Maintain | Overweight | 2026-01-15 |
| JP Morgan | Maintain | Overweight | 2026-01-14 |
| Bernstein | Upgrade | Outperform | 2026-01-05 |
| B of A Securities | Maintain | Buy | 2025-12-03 |
| JP Morgan | Maintain | Overweight | 2025-12-01 |
GLOBALFOUNDRIES Inc. Grades
This table shows recent institutional grading actions for GLOBALFOUNDRIES Inc.:
| Grading Company | Action | New Grade | Date |
|---|---|---|---|
| Citigroup | Maintain | Neutral | 2026-01-15 |
| Wedbush | Downgrade | Neutral | 2025-12-31 |
| B of A Securities | Maintain | Underperform | 2025-12-04 |
| Citigroup | Maintain | Neutral | 2025-11-13 |
| Evercore ISI Group | Maintain | Outperform | 2025-11-13 |
| JP Morgan | Maintain | Neutral | 2025-11-13 |
| Wedbush | Maintain | Outperform | 2025-11-13 |
| B of A Securities | Downgrade | Underperform | 2025-10-13 |
| Wedbush | Maintain | Outperform | 2025-08-06 |
| Morgan Stanley | Maintain | Equal Weight | 2025-08-06 |
Which company has the best grades?
ASML Holding N.V. consistently earns high ratings, including multiple Outperform and Overweight grades. GLOBALFOUNDRIES shows mixed to low grades, with several Neutral and Underperform ratings. This contrast may influence investor confidence and risk perception differently.
Risks specific to each company
The following categories identify critical pressure points and systemic threats facing ASML Holding N.V. and GLOBALFOUNDRIES Inc. in the 2026 market environment:
1. Market & Competition
ASML Holding N.V.
- Dominates advanced lithography niche with strong moat, but faces high valuation risks (PE 38.3).
GLOBALFOUNDRIES Inc.
- Competes in mainstream foundry services with margin pressure and weaker profitability.
2. Capital Structure & Debt
ASML Holding N.V.
- Maintains low debt-to-equity (0.14) and strong interest coverage (infinite).
GLOBALFOUNDRIES Inc.
- Slightly higher leverage (D/E 0.22) but struggling interest coverage (-0.44) signals financial stress.
3. Stock Volatility
ASML Holding N.V.
- Beta of 1.34 reflects moderate market sensitivity in tech sector.
GLOBALFOUNDRIES Inc.
- Higher beta of 1.49 indicates greater volatility and risk.
4. Regulatory & Legal
ASML Holding N.V.
- Exposure to export controls on EUV tech poses regulatory risks.
GLOBALFOUNDRIES Inc.
- Faces evolving semiconductor trade regulations but less advanced tech focus reduces some risks.
5. Supply Chain & Operations
ASML Holding N.V.
- Complex global supply chain with critical dependencies on rare components.
GLOBALFOUNDRIES Inc.
- Operational risks from scale and efficiency challenges, reflected in low fixed asset turnover (0.82).
6. ESG & Climate Transition
ASML Holding N.V.
- Advanced sustainability initiatives but high energy consumption in EUV production.
GLOBALFOUNDRIES Inc.
- ESG efforts less mature, with potential risks in environmental compliance.
7. Geopolitical Exposure
ASML Holding N.V.
- Significant exposure to Asia-Pacific geopolitical tensions impacting supply and sales.
GLOBALFOUNDRIES Inc.
- US base limits some geopolitical risks but global foundry reliance remains vulnerable.
Which company shows a better risk-adjusted profile?
ASML’s dominant technology moat and robust financial health mitigate most risks despite high valuation. GLOBALFOUNDRIES faces substantial profitability and operational challenges, increasing risk. ASML’s Altman Z-score (12.4) and Piotroski score (8) confirm strong financial resilience. Conversely, GLOBALFOUNDRIES’ weaker scores signal caution. The main risk for ASML is geopolitical exposure, while GLOBALFOUNDRIES’ largest risk is persistent operational inefficiency. Recent data show ASML’s superior interest coverage and leverage ratios bolster its safer risk-adjusted profile.
Final Verdict: Which stock to choose?
ASML’s superpower lies in its durable competitive advantage, demonstrated by a very favorable moat and consistently high returns on invested capital. Its advanced technology and pricing power drive robust growth. A point of vigilance is its high valuation multiples, which could pressure future returns. ASML suits portfolios targeting aggressive growth with a tolerance for valuation risk.
GLOBALFOUNDRIES’ strategic moat centers on its position as a flexible foundry with a stable cash conversion cycle and improving profitability. It offers a safer balance sheet and more attractive liquidity ratios than ASML, though it currently struggles with profitability and value creation. It fits well in a GARP portfolio seeking potential turnaround stories with moderate risk.
If you prioritize long-term value creation and strong profitability, ASML outshines due to its durable moat and superior returns. However, if you seek a more conservative exposure with improving fundamentals and better liquidity, GLOBALFOUNDRIES offers better stability despite current challenges. Each presents a distinct analytical scenario depending on your risk appetite and growth expectations.
Disclaimer: Investment carries a risk of loss of initial capital. The past performance is not a reliable indicator of future results. Be sure to understand risks before making an investment decision.
Go Further
I encourage you to read the complete analyses of ASML Holding N.V. and GLOBALFOUNDRIES Inc. to enhance your investment decisions: