Home > Comparison > Technology > ASML vs CEVA
The strategic rivalry between ASML Holding N.V. and CEVA, Inc. shapes the semiconductor industry’s evolution. ASML operates as a capital-intensive leader producing advanced lithography systems, while CEVA focuses on licensing wireless connectivity and AI processor technologies. This analysis pits ASML’s manufacturing dominance against CEVA’s IP-driven model, assessing which offers superior risk-adjusted returns. I will determine which trajectory best suits a diversified portfolio navigating sector innovation and cyclical volatility.
Table of contents
Companies Overview
ASML Holding N.V. and CEVA, Inc. represent two pivotal players in the semiconductor sector, shaping innovation from hardware manufacturing to intellectual property licensing.
ASML Holding N.V.: Global Lithography Leader
ASML dominates the advanced semiconductor equipment market by developing lithography and inspection systems essential for chip production. Its revenue stems from selling cutting-edge lithography solutions, including extreme ultraviolet systems. In 2026, ASML focuses on expanding its technology leadership and service offerings globally to solidify its competitive edge in semiconductor manufacturing.
CEVA, Inc.: Wireless Connectivity and AI IP Licensor
CEVA specializes in licensing digital signal processors and AI technologies to semiconductor and OEM companies worldwide. Its core income derives from IP licensing for 5G, IoT, and sensor fusion applications. CEVA’s 2026 strategy emphasizes broadening its wireless and AI platform portfolio to capitalize on rising demand for intelligent connectivity solutions.
Strategic Collision: Similarities & Divergences
ASML and CEVA contrast sharply in business models: ASML sells physical semiconductor manufacturing equipment, while CEVA licenses intellectual property. Both compete indirectly in the semiconductor value chain, particularly in enabling advanced chip capabilities. Their investment profiles diverge, with ASML anchored in capital-intensive innovation and scale, and CEVA positioned as a nimble IP licensor targeting fast-growth wireless and AI markets.
Income Statement Comparison
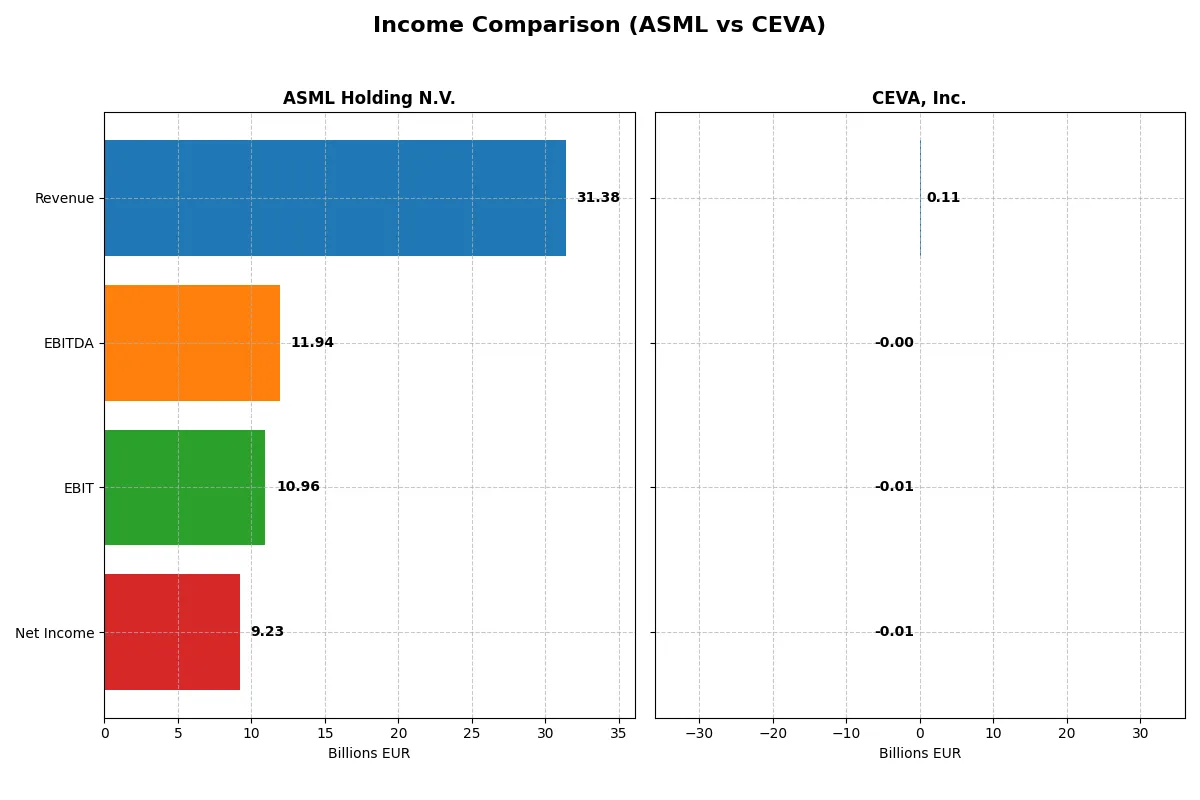
This data dissects the core profitability and scalability of both corporate engines to reveal who dominates the bottom line:
| Metric | ASML Holding N.V. (ASML) | CEVA, Inc. (CEVA) |
|---|---|---|
| Revenue | 31.4B EUR | 107M USD |
| Cost of Revenue | 14.8B EUR | 13M USD |
| Operating Expenses | 5.7B EUR | 102M USD |
| Gross Profit | 16.6B EUR | 94M USD |
| EBITDA | 11.9B EUR | -3.4M USD |
| EBIT | 11.0B EUR | -7.5M USD |
| Interest Expense | 0 | 0 |
| Net Income | 9.2B EUR | -8.8M USD |
| EPS | 23.76 EUR | -0.37 USD |
| Fiscal Year | 2025 | 2024 |
Income Statement Analysis: The Bottom-Line Duel
This income statement comparison reveals which company drives profitability and efficiency more effectively in their respective markets.
ASML Holding N.V. Analysis
ASML’s revenue surged from 18.6B EUR in 2021 to 31.4B EUR in 2025, showing robust growth. Net income climbed from 5.9B EUR to 9.2B EUR, with a strong net margin near 29%. Its gross and EBIT margins remain healthy, reflecting efficient cost control and R&D investment fueling momentum in 2025.
CEVA, Inc. Analysis
CEVA’s revenue showed moderate growth, reaching 107M USD in 2024 from 100M USD in 2020. However, net income remained negative, narrowing losses to -8.8M USD in 2024. Despite an impressive gross margin above 88%, CEVA struggles with negative EBIT and net margins, indicating challenges in converting sales into profits.
Margin Power vs. Revenue Scale
ASML clearly dominates with substantial revenue and profit growth, powered by consistent margin strength. CEVA’s high gross margin contrasts with ongoing operational losses and negative net income. For investors, ASML’s scalable profit engine offers a more attractive profile than CEVA’s improving but still loss-generating operations.
Financial Ratios Comparison
These vital ratios act as a diagnostic tool to expose the underlying fiscal health, valuation premiums, and capital efficiency of the companies compared:
| Ratios | ASML Holding N.V. (ASML) | CEVA, Inc. (CEVA) |
|---|---|---|
| ROE | 47.1% | -3.3% |
| ROIC | 34.1% | -2.7% |
| P/E | 38.3 | -84.8 |
| P/B | 18.0 | 2.79 |
| Current Ratio | 1.26 | 7.09 |
| Quick Ratio | 0.79 | 7.09 |
| D/E (Debt-to-Equity) | 0.14 | 0.021 |
| Debt-to-Assets | 5.4% | 1.8% |
| Interest Coverage | N/A | N/A |
| Asset Turnover | 0.62 | 0.35 |
| Fixed Asset Turnover | 3.81 | 8.43 |
| Payout ratio | 26.5% | 0% |
| Dividend yield | 0.69% | 0% |
| Fiscal Year | 2025 | 2024 |
Efficiency & Valuation Duel: The Vital Signs
Ratios act as the company’s DNA, uncovering hidden risks and operational excellence that shape investor confidence and future performance.
ASML Holding N.V.
ASML delivers strong profitability with a 47.08% ROE and a robust 29.42% net margin, showcasing operational efficiency. However, its P/E of 38.33 signals an expensive valuation. The company balances growth with a modest 0.69% dividend yield, indicating a strategy focused on reinvesting profits into R&D and innovation.
CEVA, Inc.
CEVA struggles with negative profitability metrics, including a -3.3% ROE and -8.22% net margin, reflecting operational challenges. Its valuation appears cheap with a negative P/E of -84.79 but carries risks. The absence of dividends and a high current ratio of 7.09 suggests heavy liquidity but inefficient capital use, focusing on R&D to drive future growth.
Premium Valuation vs. Operational Struggles
ASML offers superior profitability and operational efficiency but at a steep valuation, while CEVA presents a cheaper but riskier profile with weak returns. Investors seeking stable returns may prefer ASML’s balance; those tolerating risk might consider CEVA’s turnaround potential.
Which one offers the Superior Shareholder Reward?
I compare ASML Holding N.V. and CEVA, Inc. on their shareholder reward strategies. ASML pays a consistent dividend with a yield around 0.7–1.2% and maintains a payout ratio near 27–44%, backed by robust free cash flow coverage over 80%. Its share buybacks complement dividends, enhancing total returns sustainably. CEVA, however, pays no dividends and shows negative net margins, relying on reinvestment for growth with minimal free cash flow and weak operating cash flow coverage. Its buyback activity is negligible. I conclude ASML offers a far more attractive and sustainable total shareholder return profile in 2026.
Comparative Score Analysis: The Strategic Profile
The radar chart reveals the fundamental DNA and trade-offs of ASML Holding N.V. and CEVA, Inc., highlighting their financial strengths and weaknesses side by side:
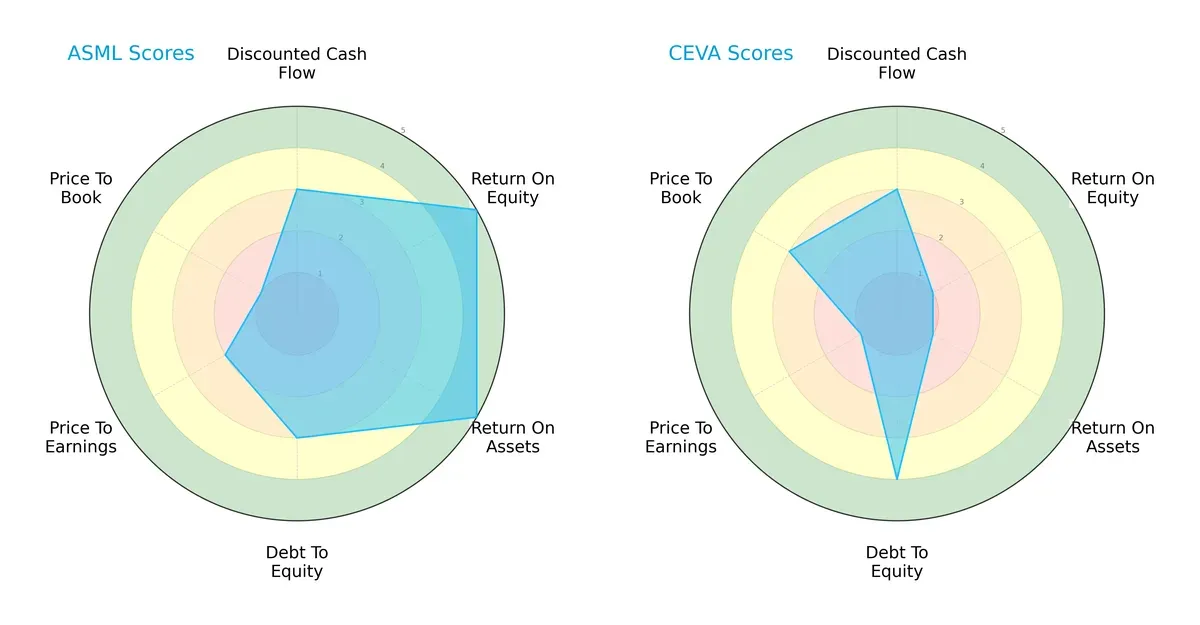
ASML delivers a balanced profile with top scores in ROE and ROA, reflecting efficient asset use and profit generation. CEVA leans on a stronger debt-to-equity position but suffers from weak returns and valuation metrics. ASML’s moderate DCF and debt scores contrast with CEVA’s uneven performance, confirming ASML’s strategic edge.
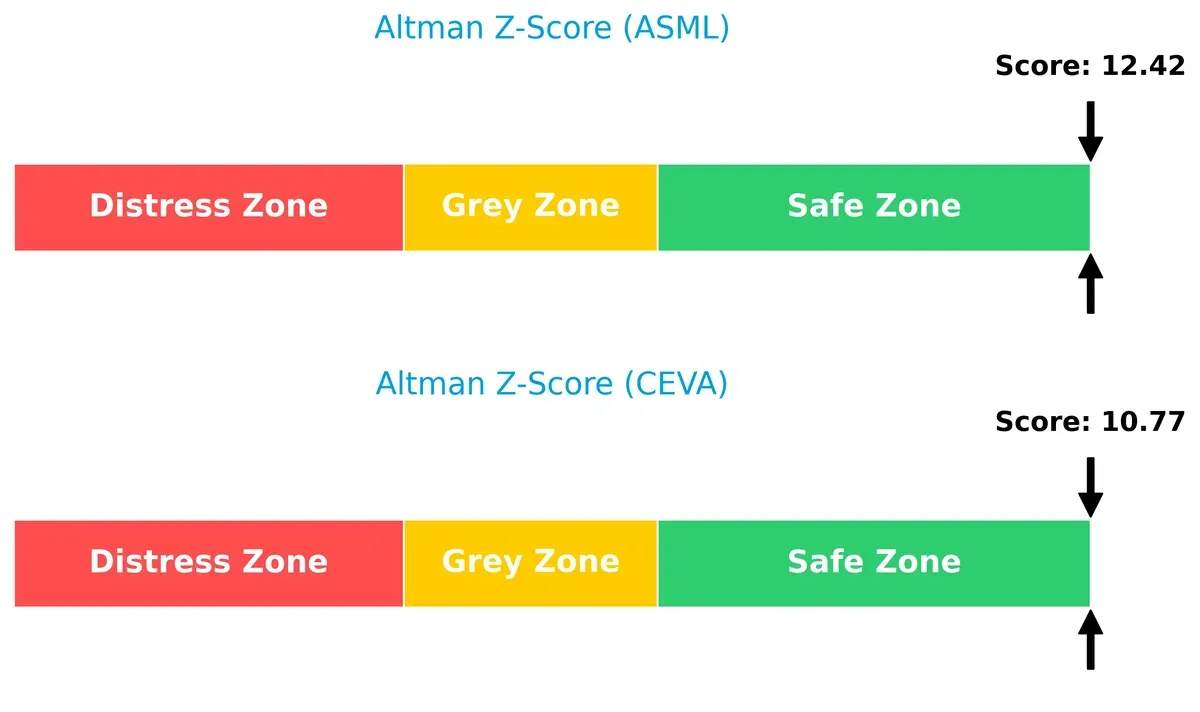
Bankruptcy Risk: Solvency Showdown
ASML’s Altman Z-Score of 12.4 surpasses CEVA’s 10.8, positioning both firms safely above distress thresholds but signaling ASML’s superior long-term resilience in volatile cycles:
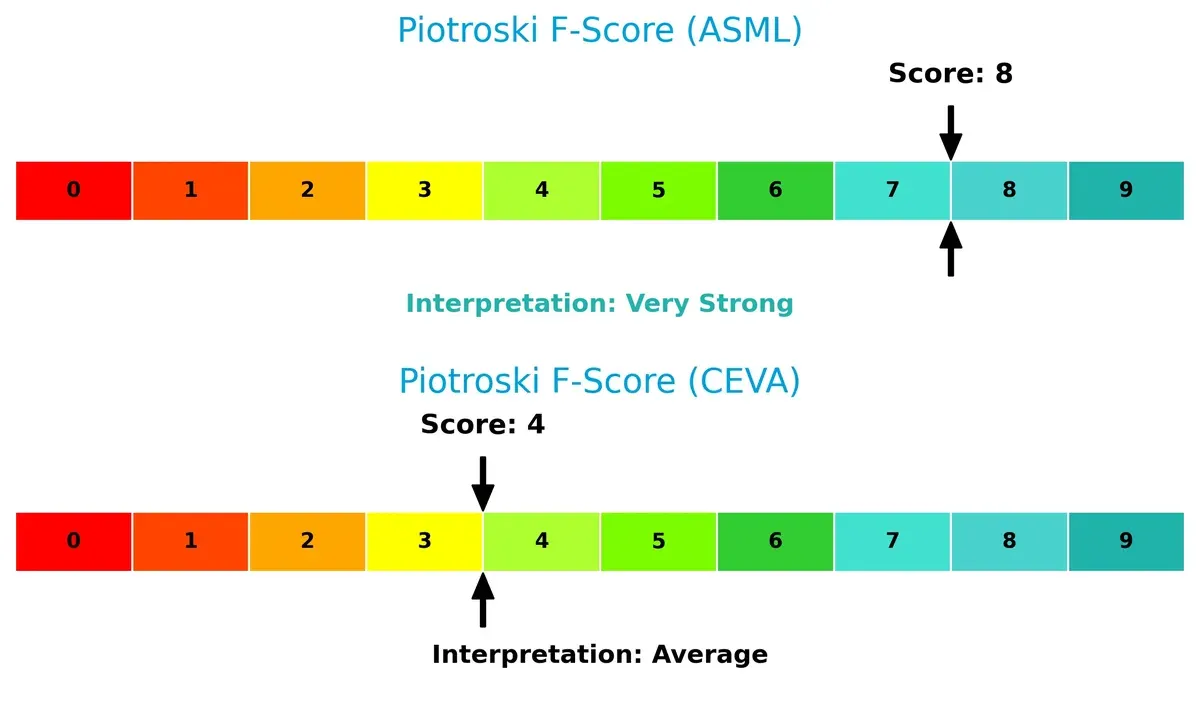
Financial Health: Quality of Operations
ASML’s Piotroski F-Score of 8 indicates very strong operational quality, while CEVA’s 4 flags average financial health, exposing potential weaknesses in profitability or efficiency:
How are the two companies positioned?
This section dissects ASML and CEVA’s operational DNA by comparing revenue distribution and internal strengths and weaknesses. The goal is to confront their economic moats and identify which model offers the most resilient competitive advantage today.
Revenue Segmentation: The Strategic Mix
This visual comparison dissects how ASML Holding N.V. and CEVA, Inc. diversify their income streams and reveals where their primary sector bets lie:
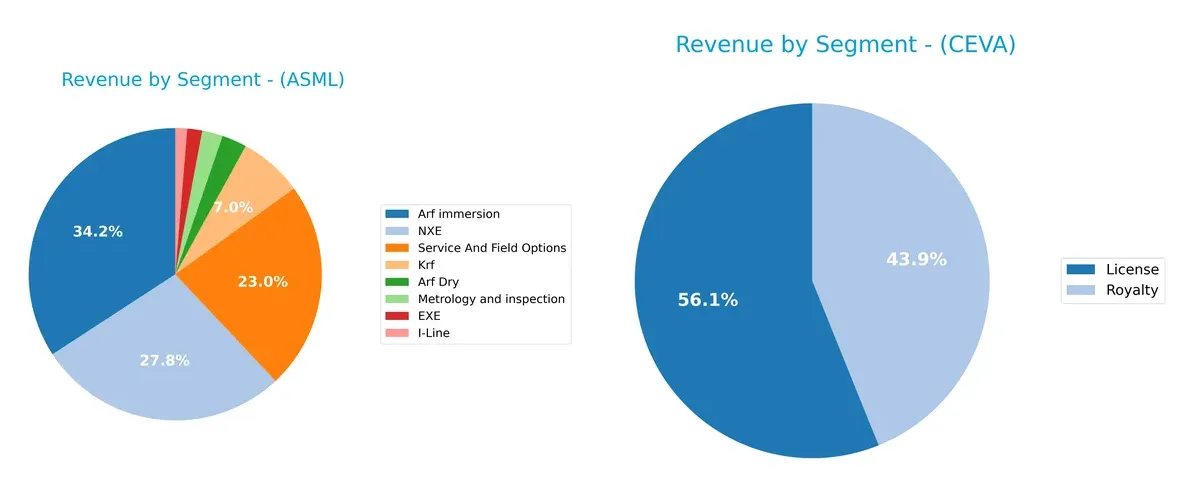
ASML displays a highly diversified revenue mix anchored by “Arf immersion” at 9.67B and “NXE” at 7.86B, with significant contributions from “Service And Field Options” at 6.49B. CEVA, however, relies mainly on two segments: “License” at 60M and “Royalty” at 47M, indicating concentration risk. ASML’s broad portfolio underpins ecosystem lock-in, while CEVA’s narrow focus suggests dependency on intellectual property licensing trends.
Strengths and Weaknesses Comparison
This table compares the Strengths and Weaknesses of ASML Holding N.V. and CEVA, Inc.:
ASML Strengths
- High profitability with net margin 29.42%
- Strong ROE at 47.08% and ROIC 34.14%
- Low debt-to-assets at 5.36%
- Diverse product portfolio including advanced lithography systems
- Significant global presence, especially in China and Korea
CEVA Strengths
- Low debt-to-assets at 1.8%
- Strong quick ratio at 7.09 indicating liquidity
- Favorable fixed asset turnover at 8.43
- Diversified revenue from licenses and royalties
- Presence in Asia Pacific and growing US markets
ASML Weaknesses
- High valuation multiples (PE 38.33, PB 18.05) may limit upside
- Quick ratio unfavorable at 0.79 suggests liquidity risk
- WACC above 10% could pressure returns
- Dividend yield low at 0.69%
- Moderate asset turnover at 0.62
CEVA Weaknesses
- Negative profitability with net margin -8.22%
- Negative ROE and ROIC indicate poor capital efficiency
- Interest coverage at 0 signals financial distress
- High current ratio at 7.09 may indicate inefficient asset use
- Unfavorable asset turnover at 0.35
- No dividend yield
ASML’s strengths lie in superior profitability and global footprint but face valuation and liquidity concerns. CEVA shows liquidity and asset efficiency strengths but suffers from weak profitability and financial stress. These contrasts highlight differing strategic challenges.
The Moat Duel: Analyzing Competitive Defensibility
A structural moat is the only reliable barrier that protects long-term profits from relentless competitive pressures and market entry risks:
ASML Holding N.V.: Proprietary Technology & Capital Intensity
ASML’s moat stems from its exclusive lithography technology and high switching costs in semiconductor manufacturing. This manifests in a strong 24% ROIC exceeding WACC by a wide margin. Growing ROIC signals durable profitability. Continued innovation in EUV systems deepens this moat in 2026.
CEVA, Inc.: Intellectual Property Licensing
CEVA leverages specialized DSP and AI processor IP licensing, contrasting with ASML’s capital-heavy model. However, its negative ROIC indicates value destruction and shrinking competitive edge. The company’s licensing model faces challenges scaling profitably but offers niche expansion opportunities with 5G and IoT growth.
Moat Battle: Capital-Intensive Innovation vs. Licensing Agility
ASML holds a wider and deeper moat, demonstrated by sustained value creation and rising ROIC. CEVA’s declining capital efficiency and negative returns signal a fragile competitive position. ASML is better equipped to defend and expand its market dominance into 2026.
Which stock offers better returns?
Over the past 12 months, ASML Holding N.V. showed strong price growth with accelerating momentum, while CEVA, Inc. experienced a steady decline, reflecting contrasting trading dynamics.
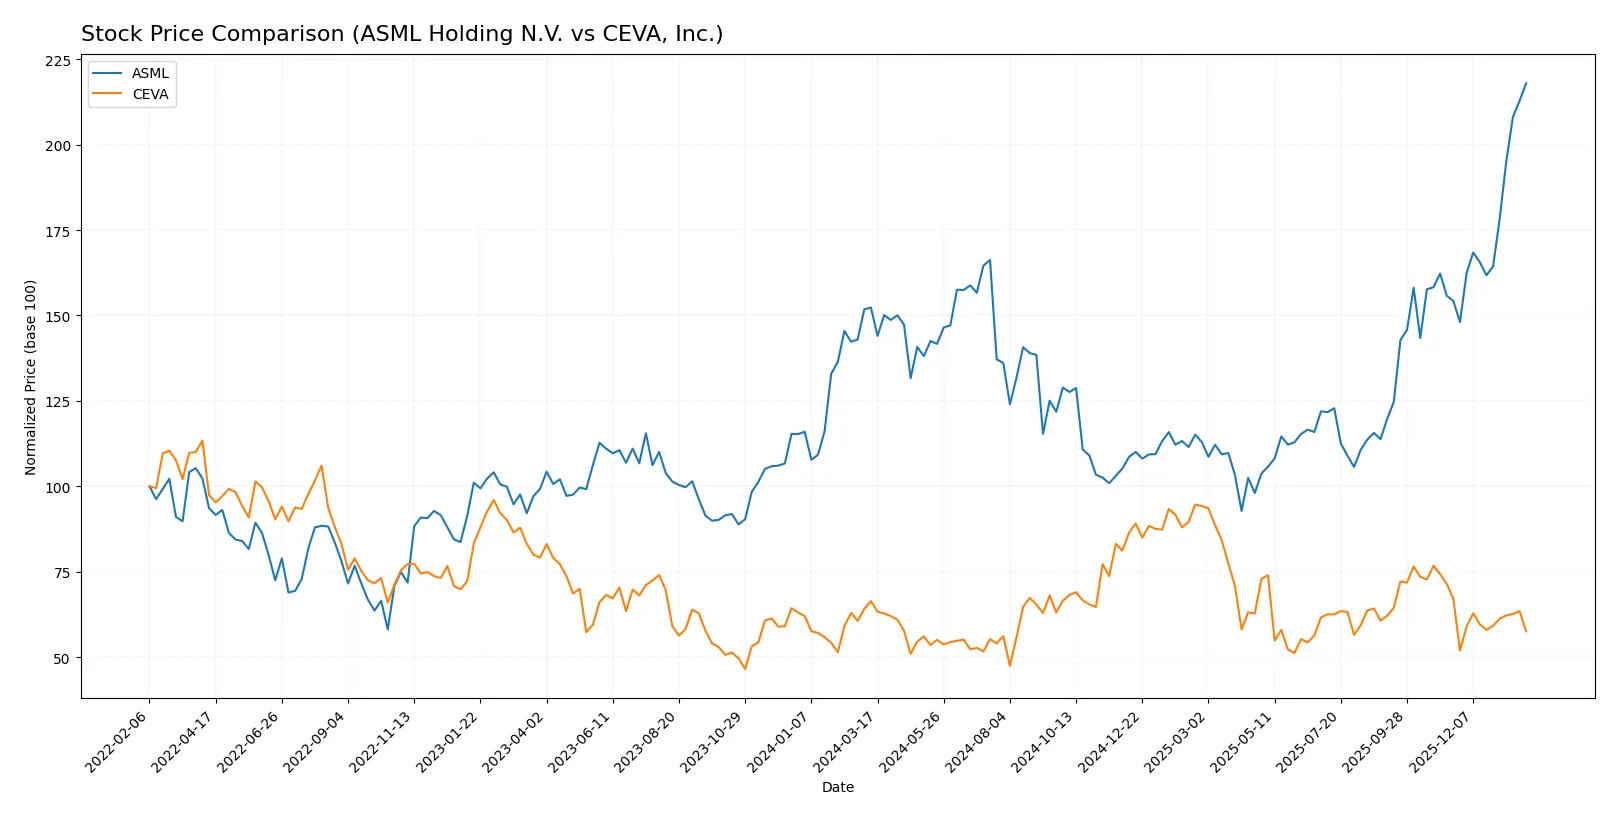
Trend Comparison
ASML Holding N.V. gained 43.11% over the past year, marking a bullish trend with accelerating price appreciation from 605.55 to a peak of 1423.0. Volatility is high, with a standard deviation of 170.09.
CEVA, Inc. fell 13.25% in the same period, confirming a bearish trend with accelerating decline. Prices ranged between 17.39 and 34.67, and volatility remained low at a 4.4 standard deviation.
ASML’s strong bullish trend outperforms CEVA’s bearish pattern, delivering the highest market returns over the past 12 months.
Target Prices
Analysts present a clear consensus on target prices for ASML Holding N.V. and CEVA, Inc.
| Company | Target Low | Target High | Consensus |
|---|---|---|---|
| ASML Holding N.V. | 1150 | 1911 | 1458.5 |
| CEVA, Inc. | 28 | 28 | 28 |
The ASML consensus target of 1458.5 slightly exceeds its current price of 1423, indicating modest upside. CEVA’s unanimous target of 28 suggests a strong potential gain from its current 21.09 price.

Don’t Let Luck Decide Your Entry Point
Optimize your entry points with our advanced ProRealTime indicators. You’ll get efficient buy signals with precise price targets for maximum performance. Start outperforming now!
How do institutions grade them?
Here is a comparison of the latest institutional grades for ASML Holding N.V. and CEVA, Inc.:
ASML Holding N.V. Grades
The following table summarizes recent grade changes and actions by reputable grading firms for ASML Holding N.V.:
| Grading Company | Action | New Grade | Date |
|---|---|---|---|
| Barclays | Upgrade | Overweight | 2026-01-29 |
| Wells Fargo | Maintain | Overweight | 2026-01-29 |
| RBC Capital | Maintain | Outperform | 2026-01-29 |
| Bernstein | Maintain | Outperform | 2026-01-22 |
| KGI Securities | Upgrade | Outperform | 2026-01-15 |
| Wells Fargo | Maintain | Overweight | 2026-01-15 |
| JP Morgan | Maintain | Overweight | 2026-01-14 |
| Bernstein | Upgrade | Outperform | 2026-01-05 |
| B of A Securities | Maintain | Buy | 2025-12-03 |
| JP Morgan | Maintain | Overweight | 2025-12-01 |
CEVA, Inc. Grades
The following table shows recent grading actions by established firms for CEVA, Inc.:
| Grading Company | Action | New Grade | Date |
|---|---|---|---|
| Barclays | Maintain | Overweight | 2025-11-12 |
| Rosenblatt | Maintain | Buy | 2025-11-11 |
| Rosenblatt | Maintain | Buy | 2025-08-14 |
| Oppenheimer | Maintain | Outperform | 2025-05-09 |
| Rosenblatt | Maintain | Buy | 2025-05-08 |
| Barclays | Maintain | Overweight | 2025-05-08 |
| Rosenblatt | Maintain | Buy | 2025-04-23 |
| Barclays | Maintain | Overweight | 2025-02-14 |
| Rosenblatt | Maintain | Buy | 2025-02-14 |
| Rosenblatt | Maintain | Buy | 2025-02-11 |
Which company has the best grades?
ASML Holding N.V. has received multiple recent upgrades and consistently higher grades like Outperform and Overweight. CEVA, Inc. maintains mostly Buy and Overweight ratings without upgrades. ASML’s stronger grades suggest greater analyst confidence, potentially influencing investor sentiment more positively.
Risks specific to each company
The following categories identify critical pressure points and systemic threats facing ASML Holding N.V. and CEVA, Inc. in the 2026 market environment:
1. Market & Competition
ASML Holding N.V.
- Dominates advanced semiconductor equipment with strong technological moats. Faces intense competition from global chipmakers’ evolving needs.
CEVA, Inc.
- Operates in a niche licensing market with high dependency on semiconductor OEMs. Faces risks from rapid tech shifts and larger IP licensors.
2. Capital Structure & Debt
ASML Holding N.V.
- Low debt-to-equity (0.14) and strong interest coverage indicate conservative leverage and financial stability.
CEVA, Inc.
- Minimal debt (D/E 0.02) but zero interest coverage signals vulnerability if cash flows decline. Reliance on equity financing remains high.
3. Stock Volatility
ASML Holding N.V.
- Beta at 1.34 shows moderate sensitivity to market swings, typical for large-cap tech stocks.
CEVA, Inc.
- Higher beta of 1.44 reflects greater volatility and risk, amplified by smaller market cap and liquidity constraints.
4. Regulatory & Legal
ASML Holding N.V.
- Faces complex export controls and IP protection issues globally, especially in semiconductor geopolitics.
CEVA, Inc.
- Exposed to licensing disputes and regulatory scrutiny in wireless tech sectors, with potential patent litigation risks.
5. Supply Chain & Operations
ASML Holding N.V.
- Operates a global, intricate supply chain reliant on advanced materials and manufacturing precision, vulnerable to disruptions.
CEVA, Inc.
- Depends on chip manufacturers’ production cycles and third-party foundries, exposing it to operational delays and capacity constraints.
6. ESG & Climate Transition
ASML Holding N.V.
- Emphasizes sustainable manufacturing and energy efficiency in semiconductor equipment, aligning with ESG trends.
CEVA, Inc.
- Faces challenges in embedding ESG in licensing model; less direct operational control over environmental impact.
7. Geopolitical Exposure
ASML Holding N.V.
- High exposure to Asia-Pacific tensions due to sales and manufacturing footprint; subject to export restrictions.
CEVA, Inc.
- Primarily US-based but dependent on global customers, vulnerable to trade policy shifts and sanctions.
Which company shows a better risk-adjusted profile?
ASML’s dominant market position, prudent capital structure, and high Altman Z-Score (12.4) indicate a robust risk-adjusted profile. CEVA’s negative profitability margins, zero interest coverage, and moderate Piotroski score (4) reveal heightened financial and operational risks. ASML’s strengths in supply chain and geopolitical navigation offer greater stability. CEVA’s volatility and weaker financial metrics mark it as riskier. The most impactful risk for ASML lies in geopolitical tensions affecting its supply chain. For CEVA, poor profitability and fragile liquidity pose the greatest threat. ASML’s strong financial health and diversified global presence justify a more confident investment stance despite certain external pressures.
Final Verdict: Which stock to choose?
ASML’s superpower lies in its durable competitive advantage and exceptional capital efficiency. It consistently generates returns well above its cost of capital, fueling robust growth in a highly technical industry. A point of vigilance remains its premium valuation, which could temper near-term upside. This stock suits portfolios seeking long-term aggressive growth with tolerance for valuation risk.
CEVA’s strategic moat centers on its niche in semiconductor IP, supported by recurring revenue potential and a strong balance sheet. Relative to ASML, it offers a safer capital structure but struggles with profitability and value creation. CEVA fits investors looking for GARP exposure—growth at a reasonable price—accepting operational challenges for potential turnaround rewards.
If you prioritize resilient value creation and market leadership, ASML is the compelling choice due to its strong moat and superior profitability. However, if you seek a more conservative profile with room for operational improvement and a lower valuation, CEVA offers better stability but requires patience. Both present clear but distinct investment scenarios aligned with different risk appetites.
Disclaimer: Investment carries a risk of loss of initial capital. The past performance is not a reliable indicator of future results. Be sure to understand risks before making an investment decision.
Go Further
I encourage you to read the complete analyses of ASML Holding N.V. and CEVA, Inc. to enhance your investment decisions: