Home > Comparison > Technology > AVGO vs ASML
The strategic rivalry between Broadcom Inc. and ASML Holding N.V. shapes the semiconductor sector’s future. Broadcom operates as a diversified technology firm, blending semiconductor design with infrastructure software. ASML, in contrast, dominates as a capital-intensive manufacturer of advanced lithography equipment essential to chipmakers. This analysis pits Broadcom’s integrated model against ASML’s technological specialization to identify which offers superior risk-adjusted returns for a diversified portfolio in an evolving global market.
Table of contents
Companies Overview
Broadcom Inc. and ASML Holding N.V. stand as titans in the semiconductor industry, shaping global technology landscapes.
Broadcom Inc.: Semiconductor and Infrastructure Solutions Powerhouse
Broadcom Inc. dominates the semiconductor sector by designing and supplying semiconductor and infrastructure software solutions. It generates revenue across four segments: wired infrastructure, wireless communications, enterprise storage, and industrial applications. In 2026, Broadcom sharpens its strategic focus on integrating complex sub-systems and firmware to capture growth in data centers, telecommunications, and alternative energy systems.
ASML Holding N.V.: Advanced Lithography Innovator
ASML Holding N.V. leads the semiconductor equipment market by producing advanced lithography and metrology systems critical for chip manufacturing. Its revenue depends heavily on extreme ultraviolet and deep ultraviolet lithography technologies. The company prioritizes expanding its lithography system capabilities and customer support services to maintain dominance in semiconductor node advances and high precision wafer inspection.
Strategic Collision: Similarities & Divergences
Broadcom emphasizes integrated semiconductor products and software, while ASML focuses on cutting-edge manufacturing equipment. Their competition centers on the semiconductor value chain but in fundamentally different segments: Broadcom targets end-product components, ASML the chip fabrication process. This divergence creates distinct investment profiles—Broadcom with broad market exposure and ASML with a specialized technological moat in lithography.
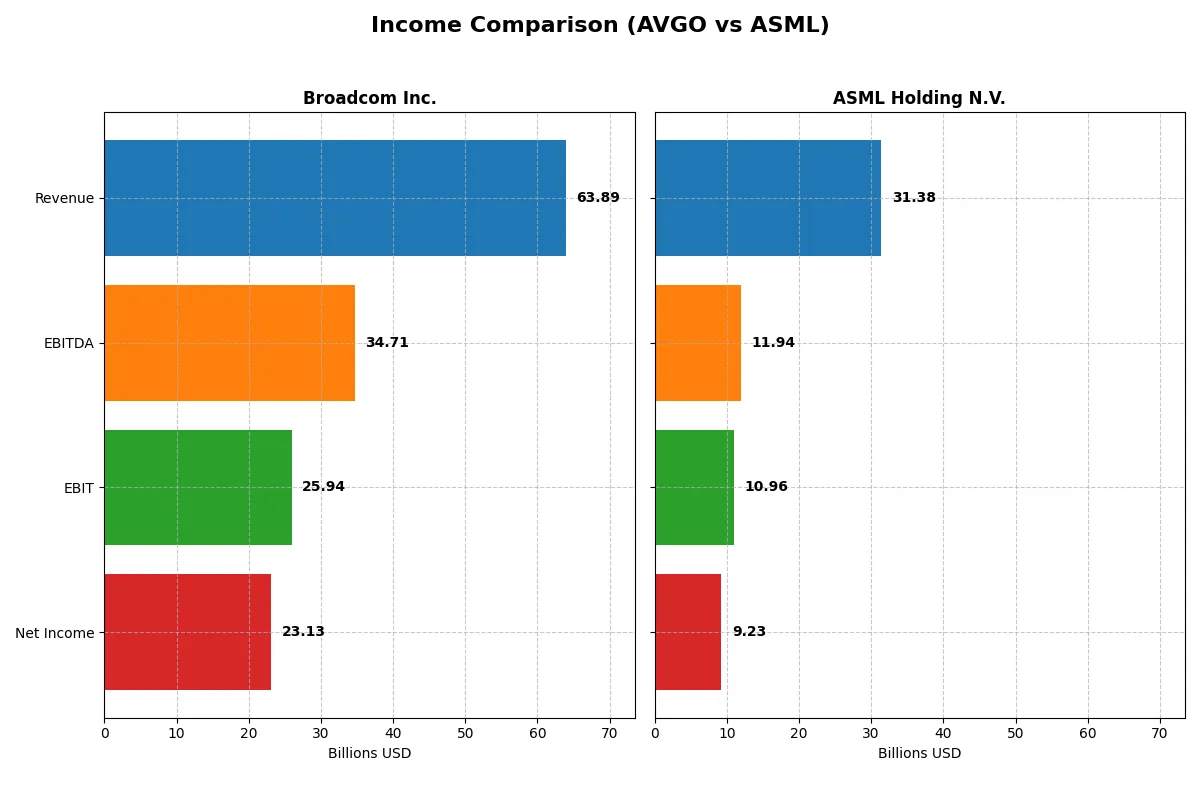
Income Statement Comparison
This data dissects the core profitability and scalability of both corporate engines to reveal who dominates the bottom line:
| Metric | Broadcom Inc. (AVGO) | ASML Holding N.V. (ASML) |
|---|---|---|
| Revenue | 63.9B | 31.4B |
| Cost of Revenue | 20.6B | 14.8B |
| Operating Expenses | 17.8B | 5.7B |
| Gross Profit | 43.3B | 16.6B |
| EBITDA | 34.7B | 11.9B |
| EBIT | 25.9B | 11.0B |
| Interest Expense | 3.2B | 0 |
| Net Income | 23.1B | 9.2B |
| EPS | 4.91 | 23.76 |
| Fiscal Year | 2025 | 2025 |
Income Statement Analysis: The Bottom-Line Duel
This income statement comparison unveils the true operational efficiency and profitability momentum of two semiconductor giants.
Broadcom Inc. Analysis
Broadcom’s revenue surged from $27.5B in 2021 to $63.9B in 2025, with net income more than tripling to $23.1B. Its gross margin stands strong at 67.8%, showcasing excellent cost control, while net margin expanded to 36.2%. The 2025 fiscal year highlights exceptional momentum, with EBIT nearly doubling and net income growing 217% year-over-year.
ASML Holding N.V. Analysis
ASML’s revenue rose steadily from €18.6B in 2021 to €31.4B in 2025, with net income increasing by over 56% across the period but showing modest single-digit growth recently. The gross margin remains healthy at 52.8%, and net margin at 29.4%, reflecting solid profitability. The 2025 results indicate consistent growth, though at a slower pace compared to Broadcom’s explosive gains.
Margin Dominance vs. Steady Expansion
Broadcom outpaces ASML in margin strength and growth velocity, with a superior 2025 net margin of 36.2% versus ASML’s 29.4%. Broadcom’s aggressive expansion delivers rapid earnings growth and operational leverage. ASML offers steady, reliable revenue gains with healthy margins but slower profit acceleration. For investors, Broadcom’s profile appeals to those seeking dynamic margin expansion, while ASML suits those favoring steady, disciplined growth.
Financial Ratios Comparison
These vital ratios act as a diagnostic tool to expose the underlying fiscal health, valuation premiums, and capital efficiency of each company:
| Ratios | Broadcom Inc. (AVGO) | ASML Holding N.V. (ASML) |
|---|---|---|
| ROE | 28.4% | 47.1% |
| ROIC | 16.4% | 34.1% |
| P/E | 73.9x | 38.3x |
| P/B | 21.0x | 18.0x |
| Current Ratio | 1.71 | 1.26 |
| Quick Ratio | 1.58 | 0.79 |
| D/E | 0.80 | 0.14 |
| Debt-to-Assets | 38.1% | 5.4% |
| Interest Coverage | 7.94x | N/A |
| Asset Turnover | 0.37 | 0.62 |
| Fixed Asset Turnover | 25.3 | 3.81 |
| Payout ratio | 48.2% | 26.5% |
| Dividend yield | 0.65% | 0.69% |
| Fiscal Year | 2025 | 2025 |
Efficiency & Valuation Duel: The Vital Signs
Financial ratios act as a company’s DNA, unveiling hidden risks and operational strengths that guide investment decisions with clarity.
Broadcom Inc.
Broadcom delivers robust profitability, boasting a 28.45% ROE and a strong 36.2% net margin, signaling operational excellence. Its valuation appears stretched, with a high P/E of 73.87 and P/B of 21.01. Shareholder returns include a modest 0.65% dividend yield, while significant R&D investment (17.18% of revenue) supports future growth.
ASML Holding N.V.
ASML posts impressive profitability, with a 47.08% ROE and a solid 29.42% net margin, reflecting high capital efficiency. The stock remains expensive, trading at a P/E of 38.33 and P/B of 18.05. It offers a 0.69% dividend yield but maintains a conservative debt profile, reinvesting heavily in R&D at 14.38% of revenue to sustain innovation.
Premium Valuation vs. Operational Safety
Both companies show slightly favorable overall ratios but carry high valuations. Broadcom’s higher margins contrast with ASML’s superior ROE and lower leverage. Broadcom suits investors seeking strong cash flow and growth reinvestment, while ASML appeals to those valuing exceptional capital returns with disciplined debt management.
Which one offers the Superior Shareholder Reward?
Broadcom (AVGO) pays a higher dividend yield of 2.19% with a payout ratio near 48%, supported by strong free cash flow (5.7/share) and a consistent buyback program. ASML yields 0.69% with a lower payout ratio (~27%) but retains more cash for R&D and growth, alongside significant buybacks fueling shareholder returns. I see Broadcom’s balanced dividend and aggressive buybacks as more sustainable for 2026 investors seeking total return. ASML’s growth focus suits those prioritizing capital appreciation but offers less immediate income. Overall, Broadcom delivers a superior total shareholder reward this year.
Comparative Score Analysis: The Strategic Profile
The radar chart reveals the fundamental DNA and trade-offs of Broadcom Inc. and ASML Holding N.V., highlighting their financial strengths and valuation contrasts:
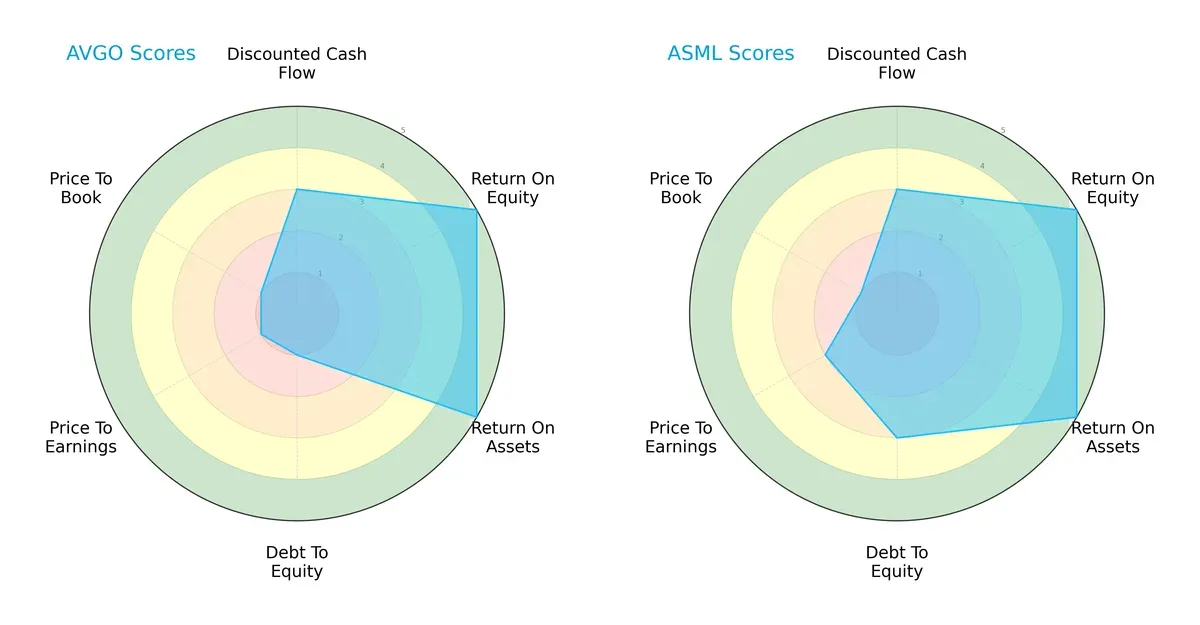
Both firms demonstrate equally strong profitability with top-tier ROE and ROA scores of 5. ASML maintains a more balanced financial profile, scoring a moderate 3 in debt-to-equity and a better 2 in price-to-earnings valuation. Broadcom, however, relies on a sharper profitability edge but struggles with weak valuation and leverage scores, each scoring 1, signaling higher financial risk and potential overvaluation.
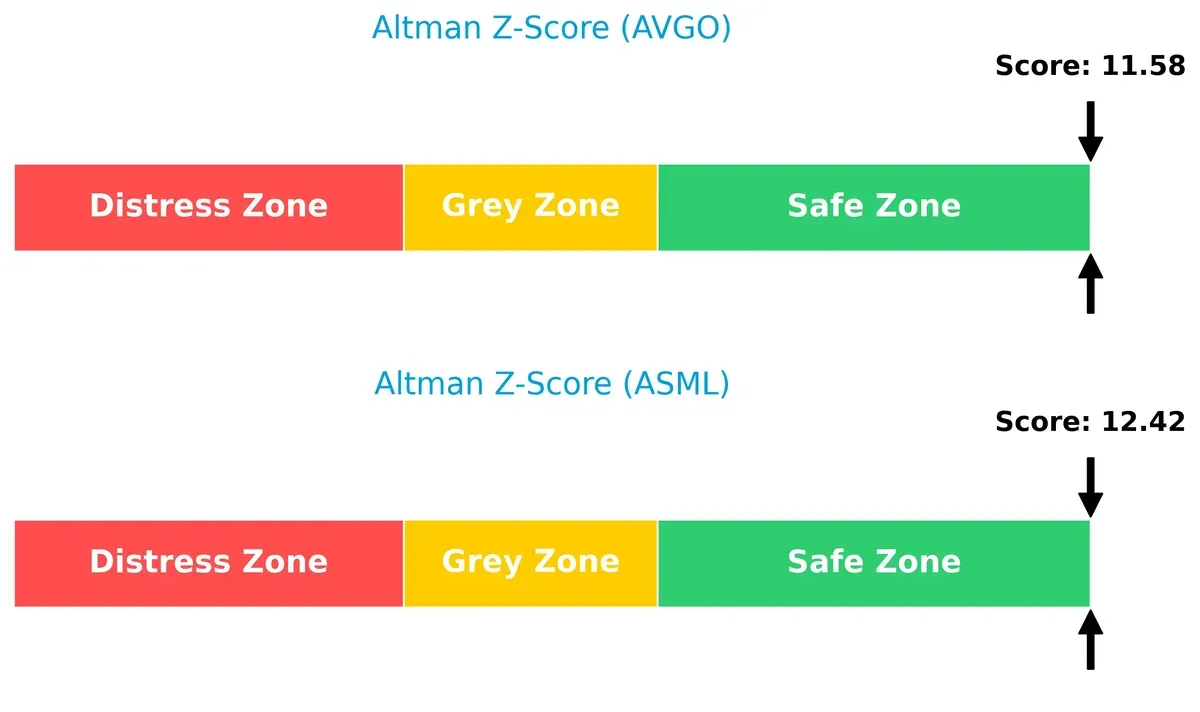
Bankruptcy Risk: Solvency Showdown
Broadcom and ASML both reside safely above the distress threshold with Altman Z-Scores of 11.58 and 12.42 respectively, confirming robust solvency and low bankruptcy risk in this cycle:
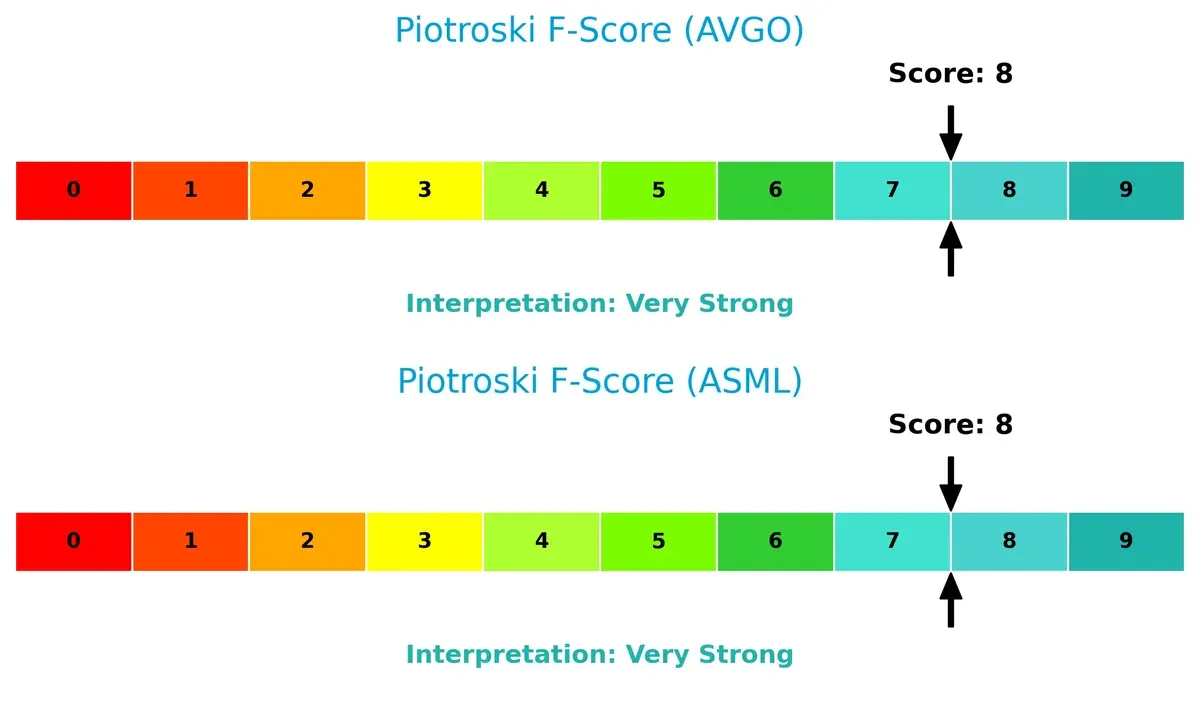
Financial Health: Quality of Operations
Both companies score an impressive 8 on the Piotroski F-Score scale, indicating very strong internal financial health and operational quality. Neither shows red flags, signaling sound fundamentals and efficient capital allocation:
How are the two companies positioned?
This section dissects the operational DNA of Broadcom and ASML by comparing their revenue distribution and internal strengths and weaknesses. The goal is to confront their economic moats to reveal which model offers the most resilient and sustainable competitive advantage today.
Revenue Segmentation: The Strategic Mix
This visual comparison dissects how Broadcom Inc. and ASML Holding diversify their income streams and where their primary sector bets lie:
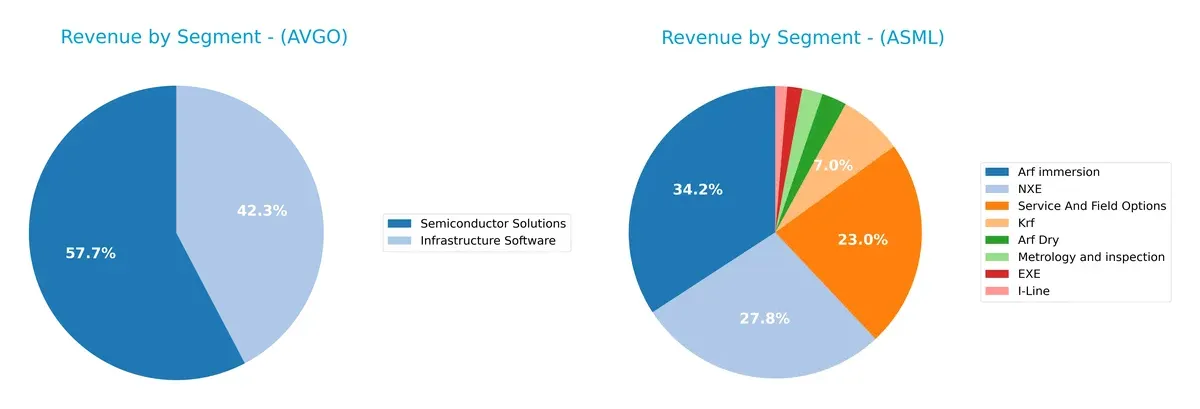
Broadcom anchors its revenue in two major segments: Semiconductor Solutions at $36.9B and Infrastructure Software at $27B, showing a balanced but concentrated portfolio. ASML, however, diversifies across multiple specialized segments like Arfi ($9.7B), NXE ($7.9B), and Service and Field Options ($6.5B). Broadcom’s focus signals strong ecosystem lock-in, while ASML’s broad base reflects infrastructure dominance but less concentration risk.
Strengths and Weaknesses Comparison
This table compares the strengths and weaknesses of Broadcom Inc. and ASML Holding N.V.:
Broadcom Inc. Strengths
- Highly diversified revenue streams in Infrastructure Software and Semiconductor Solutions
- Favorable profitability metrics including 36.2% net margin and 28.45% ROE
- Strong liquidity with current ratio of 1.71 and quick ratio of 1.58
- Robust global presence, especially in Asia Pacific with $35.9B revenue
- High fixed asset turnover at 25.25 indicates efficient asset use
ASML Holding N.V. Strengths
- Superior profitability with 47.08% ROE and 34.14% ROIC far above WACC
- Low leverage with debt-to-assets at 5.36% and favorable interest coverage
- Solid market presence in semiconductor lithography with diversified product portfolio
- Strong revenue exposure to China ($10.2B) and Korea ($6.4B)
- Favorable fixed asset turnover at 3.81 reflects efficient capital use
Broadcom Inc. Weaknesses
- High valuation multiples, P/E at 73.87 and P/B at 21.01, may pressure returns
- Unfavorable asset turnover at 0.37 signals less efficient asset deployment
- Moderate debt levels with debt-to-assets at 38.07% and D/E of 0.8
- Low dividend yield of 0.65% may deter income-focused investors
- Lower market share in some geographic regions like EMEA at $9.1B
ASML Holding N.V. Weaknesses
- Unfavorable WACC at 10.08% above ROIC may impact capital efficiency
- Quick ratio at 0.79 signals weaker short-term liquidity
- Elevated valuation multiples, P/E at 38.33 and P/B at 18.05, suggest premium pricing
- Higher proportion of unfavorable ratios (35.71%) compared to Broadcom
- Dividend yield at 0.69% remains relatively low for income investors
Broadcom shows strength in diversification and liquidity but faces challenges from high valuation and asset efficiency. ASML excels in profitability and low leverage but must manage liquidity and capital cost concerns. Both companies demonstrate slightly favorable financial profiles with distinct strategic focuses.
The Moat Duel: Analyzing Competitive Defensibility
A structural moat is the only reliable shield protecting long-term profits from relentless competitive erosion in dynamic markets:
Broadcom Inc. (AVGO): Switching Costs Powerhouse
Broadcom’s primary moat is high switching costs, locking customers into its semiconductor and infrastructure software ecosystem. This manifests in robust 40.6% EBIT margins and 7%+ ROIC above WACC. In 2026, expanding wireless and data center segments could deepen this advantage amid evolving connectivity demands.
ASML Holding N.V. (ASML): Technology and Intellectual Property Fortress
ASML’s moat centers on its cutting-edge lithography technology, supported by intangible assets and patent protections. It sustains a remarkable 34.9% EBIT margin and an exceptional 24% ROIC premium over WACC. Continued innovation in extreme ultraviolet lithography promises to extend its dominance in advanced semiconductor manufacturing.
Switching Costs vs. Technological Leadership: The Moat Showdown
ASML’s moat is wider and technologically deeper, driven by irreplaceable IP and innovation. Broadcom’s switching cost moat is strong but more vulnerable to market shifts. ASML is better positioned to defend and grow its market share through innovation barriers in 2026.
Which stock offers better returns?
The past year reveals stark contrasts: Broadcom’s sharp 153% rise slows recently, while ASML gains steadily with accelerating momentum and stronger buyer dominance.
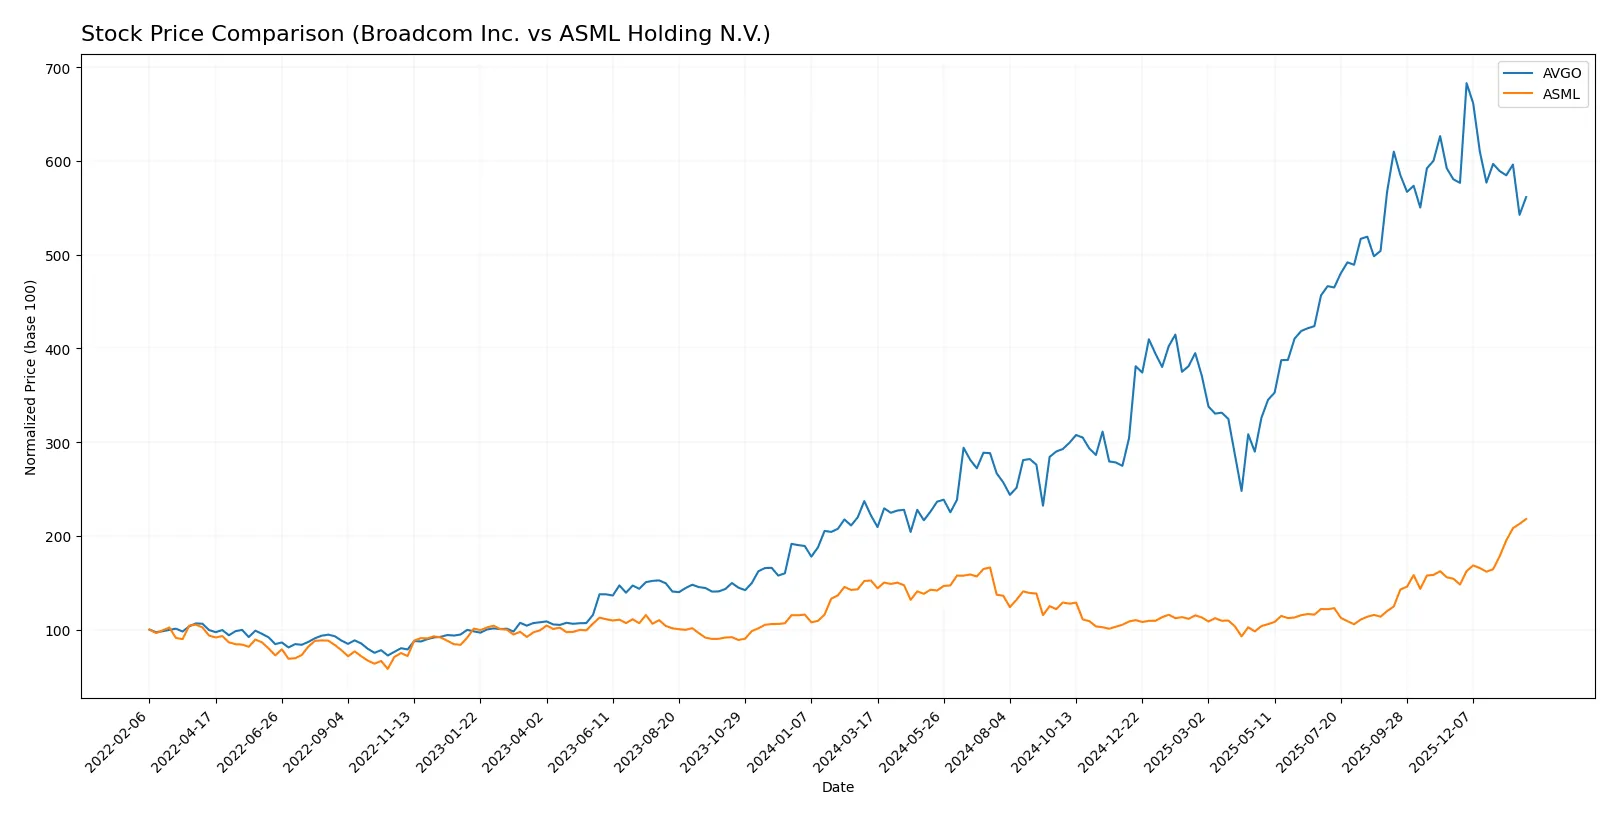
Trend Comparison
Broadcom Inc. shows a 153.15% gain over 12 months with a decelerating bullish trend. Its volatility is moderate at 78.96; the price peaked at 402.96 and bottomed at 120.47.
ASML Holding N.V. posts a 43.11% rise over the same period, accelerating its bullish momentum. Volatility is higher at 170.09, with a high of 1423.0 and a low of 605.55.
Broadcom outperforms ASML in total returns despite recent weakness. ASML’s trend accelerates, but Broadcom delivers the highest market gains over 12 months.
Target Prices
Analysts present a bullish consensus on Broadcom Inc. and ASML Holding N.V. with significant upside potential.
| Company | Target Low | Target High | Consensus |
|---|---|---|---|
| Broadcom Inc. | 370 | 510 | 450.12 |
| ASML Holding N.V. | 1150 | 1911 | 1458.5 |
The target consensus for Broadcom exceeds its current price by about 36%, signaling strong growth expectations. ASML’s consensus suggests modest upside from its current price, reflecting confidence amid recent market volatility.

Don’t Let Luck Decide Your Entry Point
Optimize your entry points with our advanced ProRealTime indicators. You’ll get efficient buy signals with precise price targets for maximum performance. Start outperforming now!
How do institutions grade them?
Here is a comparison of recent institutional grades for Broadcom Inc. and ASML Holding N.V.:
Broadcom Inc. Grades
The following table shows Broadcom Inc.’s latest grades from major financial institutions:
| Grading Company | Action | New Grade | Date |
|---|---|---|---|
| Wells Fargo | Upgrade | Overweight | 2026-01-15 |
| Mizuho | Maintain | Outperform | 2026-01-09 |
| Truist Securities | Maintain | Buy | 2025-12-19 |
| UBS | Maintain | Buy | 2025-12-15 |
| B of A Securities | Maintain | Buy | 2025-12-12 |
| Mizuho | Maintain | Outperform | 2025-12-12 |
| TD Cowen | Maintain | Buy | 2025-12-12 |
| Benchmark | Maintain | Buy | 2025-12-12 |
| Keybanc | Maintain | Overweight | 2025-12-12 |
| Rosenblatt | Maintain | Buy | 2025-12-12 |
ASML Holding N.V. Grades
Below are recent grades assigned to ASML Holding N.V. by leading institutions:
| Grading Company | Action | New Grade | Date |
|---|---|---|---|
| Barclays | Upgrade | Overweight | 2026-01-29 |
| Wells Fargo | Maintain | Overweight | 2026-01-29 |
| RBC Capital | Maintain | Outperform | 2026-01-29 |
| Bernstein | Maintain | Outperform | 2026-01-22 |
| KGI Securities | Upgrade | Outperform | 2026-01-15 |
| Wells Fargo | Maintain | Overweight | 2026-01-15 |
| JP Morgan | Maintain | Overweight | 2026-01-14 |
| Bernstein | Upgrade | Outperform | 2026-01-05 |
| B of A Securities | Maintain | Buy | 2025-12-03 |
| JP Morgan | Maintain | Overweight | 2025-12-01 |
Which company has the best grades?
Both companies enjoy strong institutional support with multiple Buy, Outperform, and Overweight ratings. ASML has a slightly higher frequency of Outperform grades and recent upgrades from Barclays and KGI Securities. This may suggest stronger recent momentum in analyst confidence compared to Broadcom, whose ratings remain consistently positive but with fewer recent upgrades. Investors may view ASML’s upgrades as signals of potential outperformance, while Broadcom’s stable Buy consensus reflects steady institutional trust.
Risks specific to each company
In 2026, both Broadcom Inc. and ASML Holding N.V. face critical pressure points and systemic threats across several risk categories in the semiconductor market environment:
1. Market & Competition
Broadcom Inc.
- Faces intense competition with a broad product portfolio but benefits from diversification across segments.
ASML Holding N.V.
- Leads in advanced semiconductor equipment with a strong technological moat but faces niche competition risks.
2. Capital Structure & Debt
Broadcom Inc.
- Moderate leverage (D/E 0.8) with solid interest coverage (8.08x), though debt-to-equity score is very unfavorable.
ASML Holding N.V.
- Low leverage (D/E 0.14) and strong balance sheet with infinite interest coverage, reflecting financial prudence.
3. Stock Volatility
Broadcom Inc.
- Beta of 1.218 indicates moderate market sensitivity, with a wide trading range (138–414).
ASML Holding N.V.
- Higher beta at 1.341 suggests greater volatility; recent price dip of -2.21% signals market caution.
4. Regulatory & Legal
Broadcom Inc.
- U.S.-based regulatory environment with potential export controls impacting global supply chains.
ASML Holding N.V.
- Operates under European and global regulations, including export restrictions on advanced tech to China.
5. Supply Chain & Operations
Broadcom Inc.
- Relies on complex global supply chains for semiconductors and infrastructure software; vulnerable to disruptions.
ASML Holding N.V.
- Dependent on advanced manufacturing inputs and global customers, with high operational complexity.
6. ESG & Climate Transition
Broadcom Inc.
- Increasing pressure to improve sustainability practices amid semiconductor energy consumption concerns.
ASML Holding N.V.
- Strong ESG focus required to maintain leadership, especially in emissions and resource efficiency.
7. Geopolitical Exposure
Broadcom Inc.
- Exposure to U.S.-China tensions affecting supply and sales in Asia markets.
ASML Holding N.V.
- High geopolitical risk due to reliance on Asian manufacturing hubs and export controls.
Which company shows a better risk-adjusted profile?
Broadcom’s main risk lies in its capital structure, with relatively high leverage and unfavorable debt-to-equity scores. ASML’s greatest challenge is geopolitical exposure, amplified by export restrictions and market volatility. Despite both showing solid financial strength and safe Altman Z-scores, ASML’s lower leverage and stronger interest coverage give it a slightly better risk-adjusted profile. However, ASML’s recent 2.2% stock decline warns of heightened market sensitivity. I view ASML as the more balanced risk choice, provided geopolitical tensions do not escalate further.
Final Verdict: Which stock to choose?
Broadcom Inc. (AVGO) shines as a cash machine with unmatched operational efficiency and a robust ability to generate value above its cost of capital. Its main point of vigilance lies in its high valuation multiples, which could pressure returns if growth slows. AVGO suits investors in aggressive growth portfolios seeking strong profitability.
ASML Holding N.V. (ASML) commands a technological moat with its indispensable semiconductor lithography systems, delivering recurring revenue safety and superior capital efficiency. Compared to AVGO, it offers better financial stability with considerably lower leverage. ASML fits well in GARP (Growth at a Reasonable Price) portfolios targeting durable competitive advantages.
If you prioritize rapid earnings expansion and cash generation, AVGO is the compelling choice due to its superior margin profile and rising ROIC trend. However, if you seek long-term stability with a proven technological moat and lower financial risk, ASML offers better stability and sustainable profitability despite a higher price tag. Each stock aligns with distinct investor risk tolerances and return expectations.
Disclaimer: Investment carries a risk of loss of initial capital. The past performance is not a reliable indicator of future results. Be sure to understand risks before making an investment decision.
Go Further
I encourage you to read the complete analyses of Broadcom Inc. and ASML Holding N.V. to enhance your investment decisions: