Home > Comparison > Technology > ASML vs ALAB
The strategic rivalry between ASML Holding N.V. and Astera Labs, Inc. defines the current trajectory of the semiconductor sector. ASML operates as a capital-intensive industrial giant specializing in advanced lithography systems, while Astera Labs is a nimble innovator focused on semiconductor connectivity solutions for cloud and AI infrastructure. This head-to-head pits scale and technological depth against specialized growth. This analysis will determine which corporate path offers superior risk-adjusted returns for a diversified portfolio.
Table of contents
Companies Overview
ASML Holding N.V. and Astera Labs, Inc. stand as pivotal players in the semiconductor industry’s evolving landscape.
ASML Holding N.V.: Advanced Lithography Pioneer
ASML dominates the semiconductor equipment sector with advanced lithography systems that drive chip manufacturing. Its revenue stems from selling extreme ultraviolet and deep ultraviolet lithography tools globally. In 2026, ASML focuses on refining computational lithography and expanding metrology solutions to sustain its technological edge.
Astera Labs, Inc.: Connectivity Innovator for Cloud AI
Astera Labs specializes in semiconductor connectivity solutions tailored for cloud and AI infrastructure. It monetizes through its Intelligent Connectivity Platform, which integrates data, network, and memory products under a software-defined architecture. The company pushes strategic growth by scaling its platform to meet surging demand for high-performance cloud computing.
Strategic Collision: Similarities & Divergences
Both invest heavily in semiconductor innovation but diverge in focus: ASML’s closed, hardware-centric ecosystem contrasts with Astera Labs’ open, software-driven connectivity model. Their primary battleground lies in the semiconductor supply chain—equipment versus infrastructure. ASML boasts a massive market cap and global reach, while Astera Labs offers nimble, high-growth potential with a lean workforce.
Income Statement Comparison
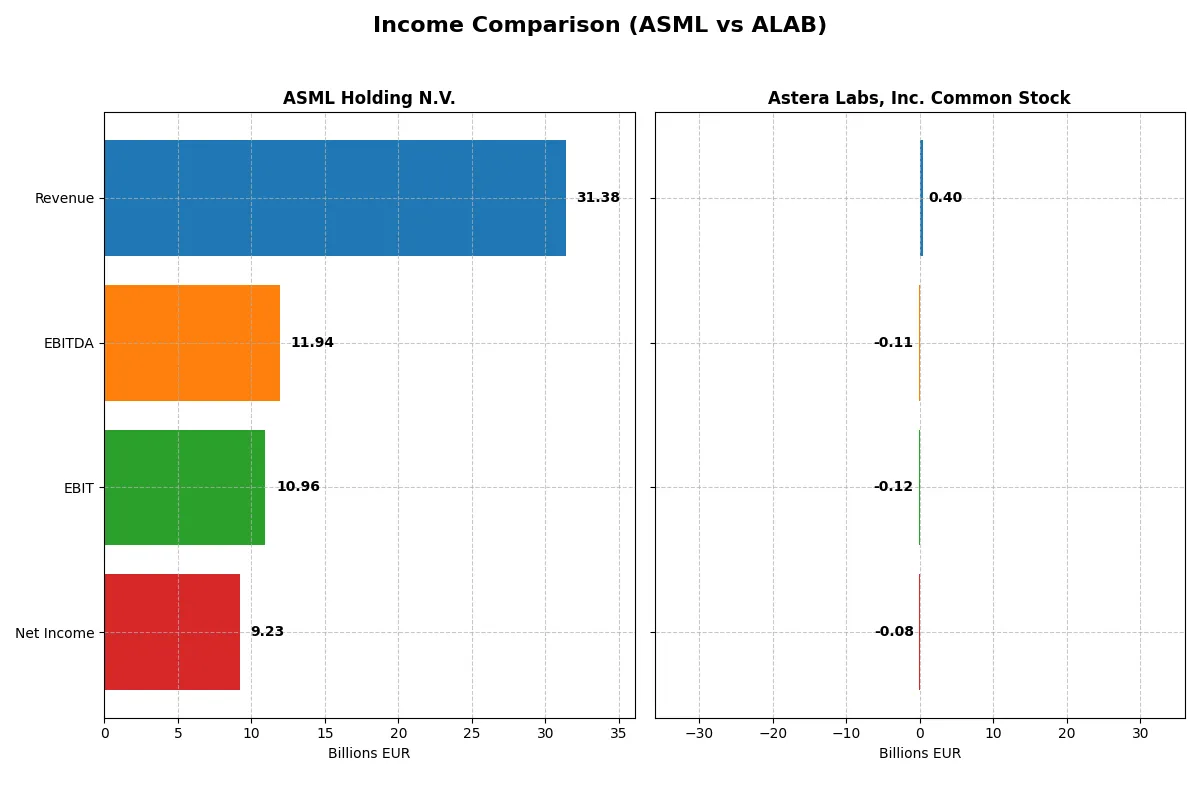
This comparison dissects the core profitability and scalability of both corporate engines to reveal who dominates the bottom line:
| Metric | ASML Holding N.V. (ASML) | Astera Labs, Inc. Common Stock (ALAB) |
|---|---|---|
| Revenue | 31.4B EUR | 396M USD |
| Cost of Revenue | 14.8B EUR | 94M USD |
| Operating Expenses | 5.72B EUR | 419M USD |
| Gross Profit | 16.6B EUR | 303M USD |
| EBITDA | 11.9B EUR | -113M USD |
| EBIT | 11.0B EUR | -116M USD |
| Interest Expense | 0 EUR | 0 USD |
| Net Income | 9.23B EUR | -83M USD |
| EPS | 23.76 EUR | -0.64 USD |
| Fiscal Year | 2025 | 2024 |
Income Statement Analysis: The Bottom-Line Duel
This income statement comparison reveals which company drives superior profitability and operational efficiency in their respective markets.
ASML Holding N.V. Analysis
ASML’s revenue rose steadily to 31.4B EUR in 2025, with net income climbing to 9.2B EUR. The company sustains robust margins, boasting a gross margin of 52.8% and net margin near 29.4%. Its efficient cost control and R&D investment fuel a 19% EBIT growth, signaling strong momentum and operational leverage.
Astera Labs, Inc. Common Stock Analysis
Astera Labs expanded revenue sharply by 242% to 396M USD in 2024 but remains unprofitable with a net loss of 83M USD. Despite a high gross margin of 76.4%, its negative EBIT margin (-29.3%) highlights heavy operating expenses. The company’s scale-up phase shows promising top-line growth but persistent losses limit current earnings efficiency.
Sustained Profitability vs. High Growth Burden
ASML clearly leads with scalable profits and margin strength, reflecting a mature, capital-efficient business. Astera Labs impresses with explosive revenue growth but struggles to convert sales into earnings. For investors prioritizing steady returns and operational discipline, ASML’s profile offers a more compelling fundamental foundation.
Financial Ratios Comparison
These vital ratios act as a diagnostic tool to expose the underlying fiscal health, valuation premiums, and capital efficiency of the companies compared below:
| Ratios | ASML Holding N.V. (ASML) | Astera Labs, Inc. Common Stock (ALAB) |
|---|---|---|
| ROE | 47.1% | -8.6% |
| ROIC | 34.1% | -12.0% |
| P/E | 38.3 | -208.4 |
| P/B | 18.0 | 18.0 |
| Current Ratio | 1.26 | 11.7 |
| Quick Ratio | 0.79 | 11.2 |
| D/E | 0.14 | 0.0013 |
| Debt-to-Assets | 5.4% | 0.12% |
| Interest Coverage | 0 (not reported) | 0 (not reported) |
| Asset Turnover | 0.62 | 0.38 |
| Fixed Asset Turnover | 3.8 | 11.1 |
| Payout Ratio | 26.5% | 0% |
| Dividend Yield | 0.69% | 0% |
| Fiscal Year | 2025 | 2024 |
Efficiency & Valuation Duel: The Vital Signs
Financial ratios act as a company’s DNA, unveiling its operational strengths and hidden risks to guide investors’ decisions clearly.
ASML Holding N.V.
ASML demonstrates robust profitability with a 47.1% ROE and a 29.4% net margin, signaling operational excellence. However, its P/E of 38.3 and P/B of 18.1 suggest a stretched valuation. The company returns value with a modest 0.69% dividend yield, balancing returns and growth through substantial R&D investments.
Astera Labs, Inc. Common Stock
Astera Labs shows negative profitability metrics, including an -8.7% ROE and -21.1% net margin, reflecting operational challenges. Its P/E is negative due to losses, though a P/B of 18.0 is comparable to ASML’s. The firm pays no dividends, instead prioritizing heavy reinvestment in R&D, evident by over 50% revenue allocation.
Valuation Stretch vs. Profitability Strength
ASML offers a strong profitability profile with a premium valuation, while Astera Labs struggles with losses despite heavy R&D spending. ASML’s balance suits investors seeking operational safety with modest income. Astera Labs fits those willing to accept higher risk for growth potential amid operational headwinds.
Which one offers the Superior Shareholder Reward?
I compare ASML Holding N.V. and Astera Labs, Inc. on shareholder rewards through dividends and buybacks. ASML pays a steady dividend yield averaging around 0.7%–1.2% with payout ratios near 26%–44%, demonstrating solid free cash flow coverage (above 60%). It also runs consistent buybacks, enhancing total return. Astera Labs pays no dividends but reinvests heavily in growth, reflected in negative margins and no buybacks. ASML’s balanced distribution and strong cash flow underpin a sustainable model. Astera’s zero payout and losses indicate riskier, long-term reinvestment. I conclude ASML offers the more attractive total return profile for 2026 investors seeking reliability and growth.
Comparative Score Analysis: The Strategic Profile
The radar chart reveals the fundamental DNA and trade-offs of ASML Holding N.V. and Astera Labs, Inc., highlighting their contrasting financial strengths and valuation risks:
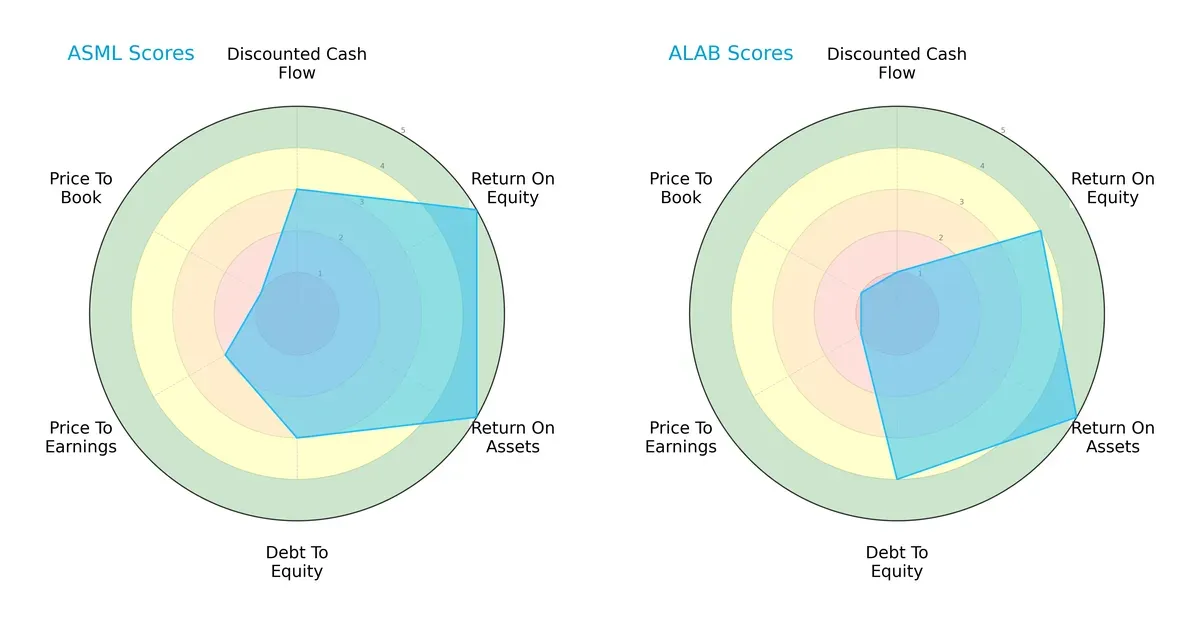
ASML boasts higher scores in ROE and ROA, reflecting superior profitability and asset efficiency. Astera Labs shows better debt management and slightly stronger overall balance, but its discounted cash flow and valuation metrics lag considerably. ASML’s profile is skewed towards operational excellence, while Astera relies more on financial prudence amid valuation challenges.
Bankruptcy Risk: Solvency Showdown
The Altman Z-Score gap signals both firms reside comfortably in the safe zone, with Astera Labs exhibiting exceptional solvency far beyond typical industry standards:
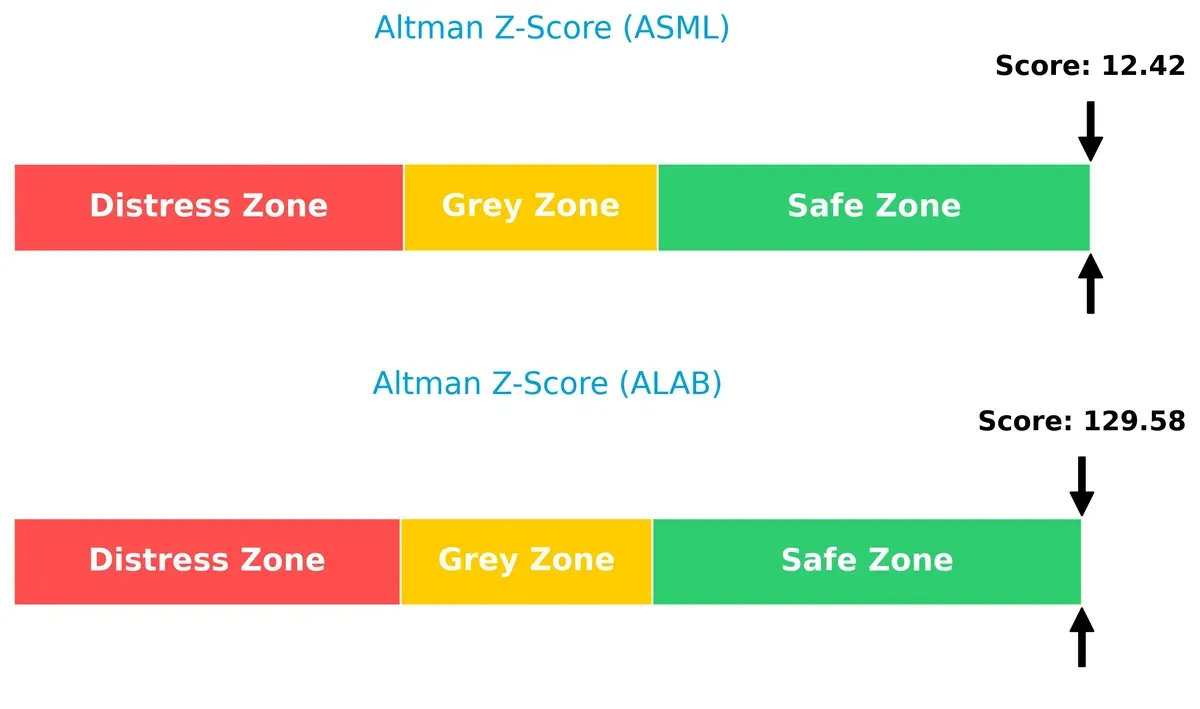
Astera’s extraordinary Z-Score of 130 versus ASML’s 12.4 underscores its rock-solid financial foundation and minimal bankruptcy risk. ASML remains very safe but faces comparatively higher leverage and operational complexity risks in this cycle.
Financial Health: Quality of Operations
ASML’s Piotroski F-Score of 8 indicates peak financial health, surpassing Astera Labs’ solid but average score of 6:
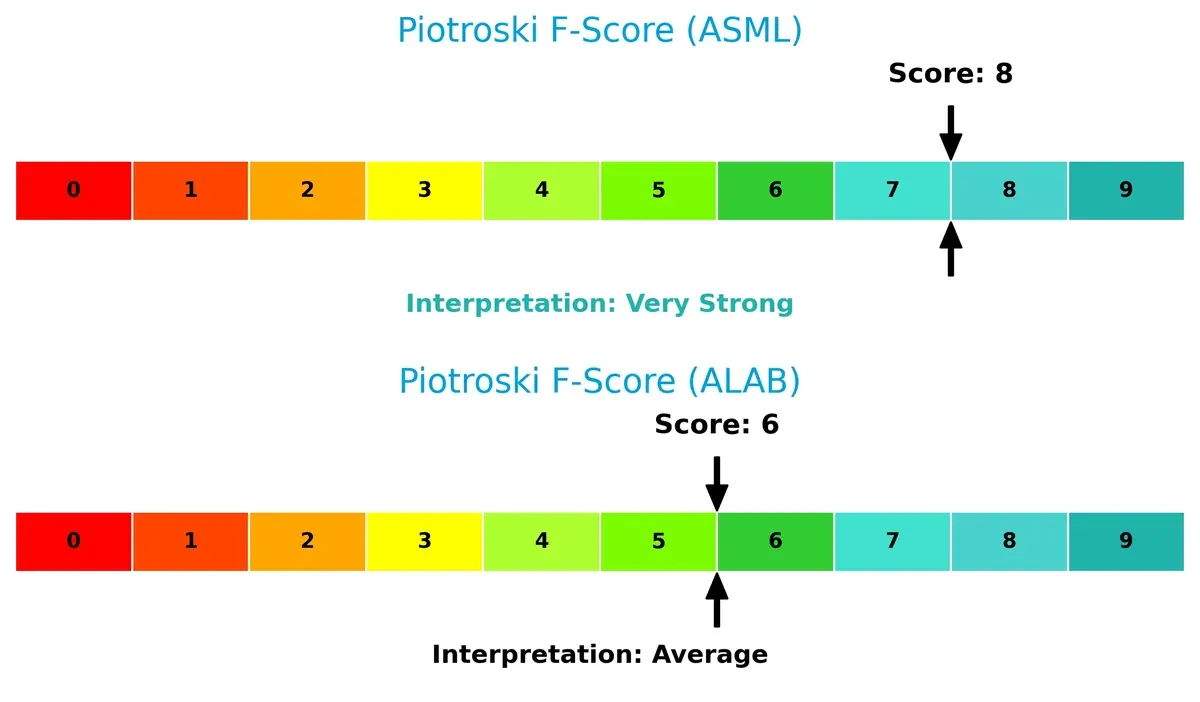
ASML demonstrates robust profitability, liquidity, and operational efficiency with minimal red flags. Astera, while financially stable, shows room for improvement in internal metrics that monitor value creation and risk management. Investors should weigh ASML’s higher quality against Astera’s conservative financial posture.
How are the two companies positioned?
This section dissects ASML and ALAB’s operational DNA by comparing their revenue distribution and internal strengths and weaknesses. The goal is to confront their economic moats to identify which model offers the most resilient, sustainable advantage in today’s market.
Revenue Segmentation: The Strategic Mix
This visual comparison dissects how both firms diversify their income streams and where their primary sector bets lie:
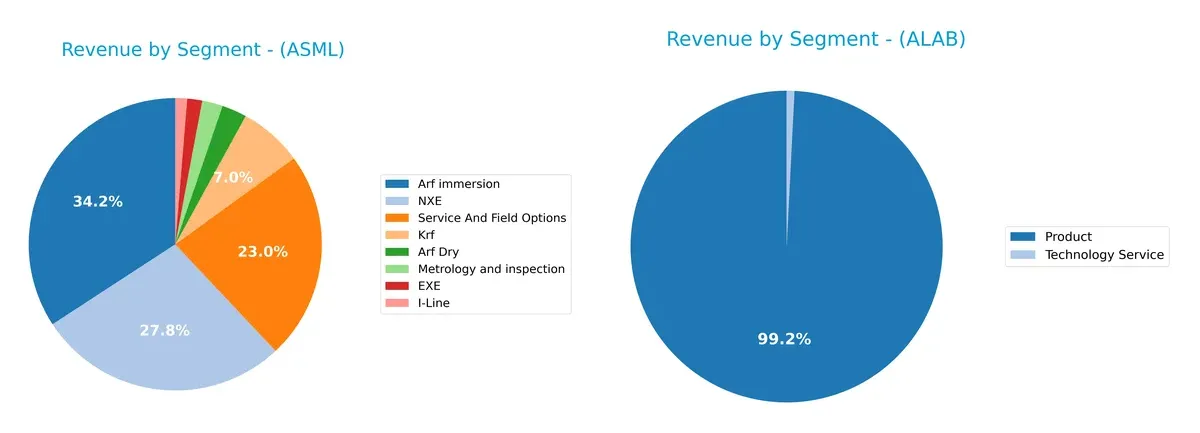
ASML Holding N.V. anchors its revenue heavily in “Arf immersion” at 9.67B and “NXE” at 7.86B, showing dominance in advanced lithography systems. It also generates 6.49B from “Service And Field Options,” reflecting a strong after-sales ecosystem. Astera Labs, Inc. Common Stock, by contrast, relies mainly on “Product” sales at 393M, with minimal contribution from “Technology Service” at 3.2M. ASML’s diversified, high-value portfolio underpins its infrastructure dominance, while Astera Labs faces concentration risk with limited segment breadth.
Strengths and Weaknesses Comparison
This table compares the Strengths and Weaknesses of ASML Holding N.V. and Astera Labs, Inc. Common Stock:
ASML Strengths
- High net margin of 29.42%
- Strong ROE at 47.08%
- Favorable ROIC at 34.14%
- Low debt-to-assets at 5.36%
- Broad global presence including China and US
- Diverse product segments with high-value EUV systems
ALAB Strengths
- Favorable PE ratio despite losses
- Very high quick ratio at 11.21 indicates liquidity
- Zero debt improves financial flexibility
- Strong fixed asset turnover at 11.12
- Presence in key markets including Taiwan and China
- Focused product revenue with technology service
ASML Weaknesses
- Unfavorable WACC at 10.08% above ROIC
- High PE and PB ratios suggest valuation risk
- Quick ratio below 1 at 0.79 signals liquidity concern
- Low dividend yield at 0.69%
- Moderate current ratio at 1.26
- Asset turnover only neutral at 0.62
ALAB Weaknesses
- Negative net margin of -21.05% and negative ROE
- WACC at 10.93% with low interest coverage
- Unfavorable current ratio at 11.71 may indicate inefficiency
- Negative ROIC at -11.97%
- No dividend yield
- Unfavorable asset turnover at 0.38
ASML’s financial strength reflects operational efficiency and global scale, but valuation and liquidity present risks. ALAB shows liquidity and asset use strengths but suffers from negative profitability and coverage issues, suggesting challenges in capital allocation and earnings generation.
The Moat Duel: Analyzing Competitive Defensibility
A structural moat is the only thing protecting long-term profits from competition’s relentless erosion:
ASML Holding N.V.: Technological Intangibles and Scale Powerhouse
ASML’s moat stems from unmatched intellectual property and scale in lithography. It delivers high ROIC (24%) and margin stability. Expanding extreme ultraviolet technology deepens this moat in 2026.
Astera Labs, Inc. Common Stock: Emerging Connectivity Innovator
Astera Labs relies on software-defined architecture and niche connectivity solutions. Unlike ASML, it lacks positive ROIC but shows rapid revenue growth. 2026 offers expansion but also risks from capital inefficiency.
Technological Excellence vs. Growth at an Operational Cost
ASML’s wide moat in advanced lithography outstrips Astera Labs’ narrow, early-stage advantage. ASML is better equipped to defend market share with proven profitability and durable competitive advantages.
Which stock offers better returns?
The past year showed strong price rallies for both ASML Holding N.V. and Astera Labs, Inc., with notable acceleration in gains and shifting buyer-seller dynamics influencing trading volumes.
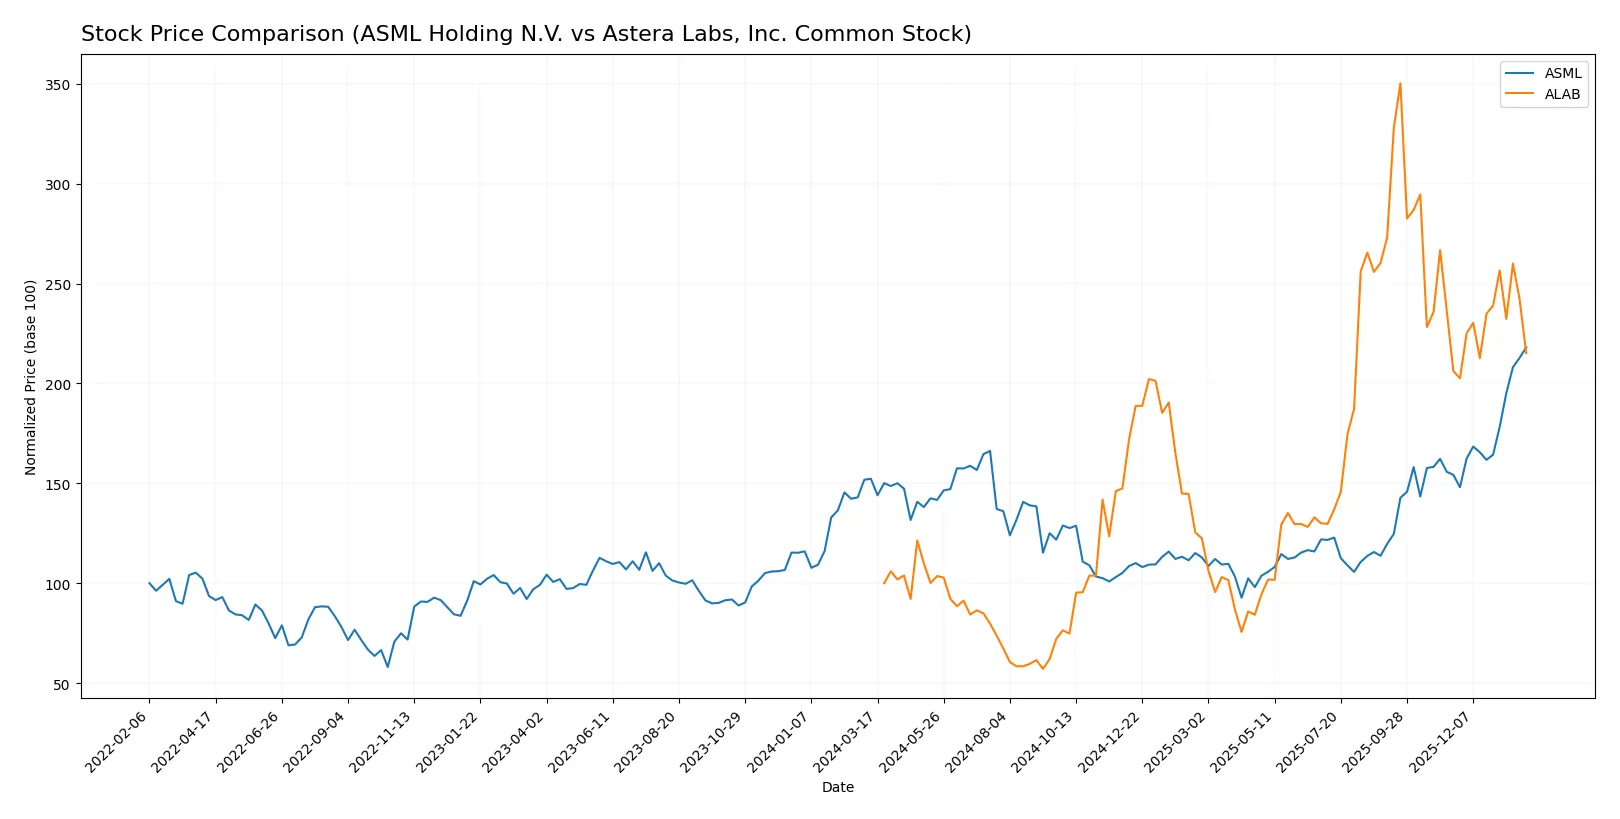
Trend Comparison
ASML Holding N.V. gained 43.11% over the past 12 months, marking a bullish trend with accelerating momentum and a high volatility level indicated by a 170.09 std deviation.
Astera Labs, Inc. surged 115.17% in the same period, also bullish with acceleration but much lower volatility at 50.39 std deviation, reflecting steadier upward movement.
Astera Labs outperformed ASML significantly in market performance, delivering the highest returns despite a recent slight seller dominance in trading volume.
Target Prices
Analysts show a cautiously optimistic consensus on target prices for ASML Holding N.V. and Astera Labs, Inc. Common Stock.
| Company | Target Low | Target High | Consensus |
|---|---|---|---|
| ASML Holding N.V. | 1150 | 1911 | 1458.5 |
| Astera Labs, Inc. | 165 | 225 | 202.14 |
The target consensus for ASML is modestly above the current price of 1423, signaling moderate upside. Astera Labs’ consensus of 202.14 suggests significant potential above its current 150.62 price.

Don’t Let Luck Decide Your Entry Point
Optimize your entry points with our advanced ProRealTime indicators. You’ll get efficient buy signals with precise price targets for maximum performance. Start outperforming now!
How do institutions grade them?
ASML Holding N.V. Grades
Below is a summary of recent grades issued for ASML Holding N.V.:
| Grading Company | Action | New Grade | Date |
|---|---|---|---|
| Barclays | Upgrade | Overweight | 2026-01-29 |
| Wells Fargo | Maintain | Overweight | 2026-01-29 |
| RBC Capital | Maintain | Outperform | 2026-01-29 |
| Bernstein | Maintain | Outperform | 2026-01-22 |
| KGI Securities | Upgrade | Outperform | 2026-01-15 |
| Wells Fargo | Maintain | Overweight | 2026-01-15 |
| JP Morgan | Maintain | Overweight | 2026-01-14 |
| Bernstein | Upgrade | Outperform | 2026-01-05 |
| B of A Securities | Maintain | Buy | 2025-12-03 |
| JP Morgan | Maintain | Overweight | 2025-12-01 |
Astera Labs, Inc. Common Stock Grades
The following grades have been assigned recently for Astera Labs, Inc.:
| Grading Company | Action | New Grade | Date |
|---|---|---|---|
| Northland Capital Markets | Maintain | Outperform | 2025-12-09 |
| Northland Capital Markets | Upgrade | Outperform | 2025-11-17 |
| Needham | Maintain | Buy | 2025-11-05 |
| JP Morgan | Maintain | Overweight | 2025-11-05 |
| TD Cowen | Maintain | Hold | 2025-11-05 |
| Morgan Stanley | Maintain | Overweight | 2025-11-05 |
| Roth Capital | Maintain | Buy | 2025-11-05 |
| Stifel | Maintain | Buy | 2025-11-05 |
| Barclays | Downgrade | Equal Weight | 2025-10-20 |
| Stifel | Maintain | Buy | 2025-10-17 |
Which company has the best grades?
ASML Holding N.V. generally holds higher and more consistent grades, with multiple “Outperform” and “Overweight” ratings from leading banks. Astera Labs’ grades are positive but include some downgrades and more “Hold” ratings, suggesting relatively lower institutional confidence. Investors may see ASML as having stronger institutional support.
Risks specific to each company
The following categories identify the critical pressure points and systemic threats facing both firms in the 2026 market environment:
1. Market & Competition
ASML Holding N.V.
- Dominates advanced semiconductor equipment with strong global presence but faces intense innovation pressure.
Astera Labs, Inc. Common Stock
- Emerging player in semiconductor connectivity with rapid growth, yet vulnerable to established competitors and market penetration risks.
2. Capital Structure & Debt
ASML Holding N.V.
- Low debt-to-equity at 0.14 indicates conservative leverage and strong balance sheet.
Astera Labs, Inc. Common Stock
- Zero debt signals no financial risk from leverage but may limit capital flexibility for growth.
3. Stock Volatility
ASML Holding N.V.
- Beta at 1.34 implies moderate market sensitivity, typical for semiconductor leaders.
Astera Labs, Inc. Common Stock
- Higher beta of 1.51 signals greater price swings and elevated investor risk.
4. Regulatory & Legal
ASML Holding N.V.
- Global operations expose ASML to complex export controls and IP regulations.
Astera Labs, Inc. Common Stock
- US-based with emerging market exposure; regulatory risks tied to technology exports and cloud infrastructure compliance.
5. Supply Chain & Operations
ASML Holding N.V.
- Extensive supply chain across Asia and Europe faces geopolitical and component scarcity risks.
Astera Labs, Inc. Common Stock
- Smaller scale supply chain more agile but vulnerable to single-source dependencies and production scale challenges.
6. ESG & Climate Transition
ASML Holding N.V.
- Advanced manufacturing demands high energy use; ESG initiatives critical for long-term license to operate.
Astera Labs, Inc. Common Stock
- Early-stage company with opportunity to embed ESG practices but currently limited track record.
7. Geopolitical Exposure
ASML Holding N.V.
- Significant exposure to Asia-Pacific tensions and trade restrictions affecting chip equipment sales.
Astera Labs, Inc. Common Stock
- US-centric but reliant on global cloud infrastructure trends; geopolitical risks remain moderate but evolving.
Which company shows a better risk-adjusted profile?
ASML’s strongest risk is geopolitical exposure given its broad global footprint and reliance on sensitive markets. Astera Labs faces critical market and competition risk as a smaller, newer player with volatile stock behavior. ASML shows a better risk-adjusted profile, supported by a conservative capital structure and strong financial health metrics, despite some valuation concerns. Astera Labs’s financial instability and higher volatility raise red flags. The recent negative net margin and unfavorable interest coverage for Astera Labs underscore its operational challenges and elevated risk.
Final Verdict: Which stock to choose?
ASML Holding N.V. stands out as a cash-generating powerhouse with a durable competitive moat. Its ability to deliver growing returns on invested capital well above its cost of capital signals a strong value creator. The main point of vigilance is its relatively high valuation multiples, which could temper near-term upside. ASML suits investors seeking steady, long-term growth with a moderate risk appetite.
Astera Labs, Inc. offers a strategic moat rooted in rapid revenue growth and heavy R&D investment, positioning it for potential breakthrough innovation. Its balance sheet shows ample liquidity and low debt, providing a safety cushion compared to ASML’s capital structure. However, it currently struggles with profitability and value creation. Astera fits growth-at-a-reasonable-price (GARP) portfolios targeting early-stage tech plays with higher risk tolerance.
If you prioritize a proven track record of value creation and financial strength, ASML is the compelling choice due to its durable moat and consistent free cash flow. However, if you seek aggressive growth through innovation and can tolerate early-stage volatility, Astera Labs offers superior revenue momentum and liquidity. Each scenario appeals to distinct investor profiles balancing growth potential and financial stability.
Disclaimer: Investment carries a risk of loss of initial capital. The past performance is not a reliable indicator of future results. Be sure to understand risks before making an investment decision.
Go Further
I encourage you to read the complete analyses of ASML Holding N.V. and Astera Labs, Inc. Common Stock to enhance your investment decisions: