Home > Comparison > Technology > ASML vs ARM
The strategic rivalry between ASML Holding N.V. and Arm Holdings plc shapes the semiconductor sector’s evolution. ASML, a capital-intensive equipment manufacturer, contrasts sharply with Arm, a high-margin IP licensor. This head-to-head embodies the clash between hardware innovation and software-driven scalability. I will analyze which business model delivers a superior risk-adjusted return for diversified portfolios amid ongoing technological shifts and cyclical market dynamics.
Table of contents
Companies Overview
ASML Holding N.V. and Arm Holdings plc stand as pivotal innovators shaping the semiconductor industry’s future.
ASML Holding N.V.: Global Leader in Semiconductor Equipment
ASML dominates the semiconductor equipment segment by developing advanced lithography systems essential for chip manufacturing. Its revenue hinges on sales and services of extreme ultraviolet and deep ultraviolet lithography systems, along with metrology and inspection solutions. In 2026, ASML strategically focuses on refining computational lithography and expanding its global service footprint, solidifying its technological moat.
Arm Holdings plc: Architect of Semiconductor IP
Arm commands the semiconductor IP market by licensing CPU designs and system architectures widely adopted across automotive, computing, and IoT sectors. Its core revenue derives from licensing fees and royalties on microprocessors, GPUs, and physical IPs. In 2026, Arm prioritizes broadening its product ecosystem and enhancing software toolchains to capitalize on diverse industry applications.
Strategic Collision: Similarities & Divergences
Both companies lead critical semiconductor innovation but diverge sharply in approach: ASML controls hardware manufacturing tools, while Arm licenses open architectures. Their competitive clash centers on enabling chipmakers’ performance—ASML through precision fabrication, Arm via flexible chip design. ASML offers a capital-intensive, high-barrier-to-entry profile; Arm presents scalable growth fueled by widespread adoption of its IP.
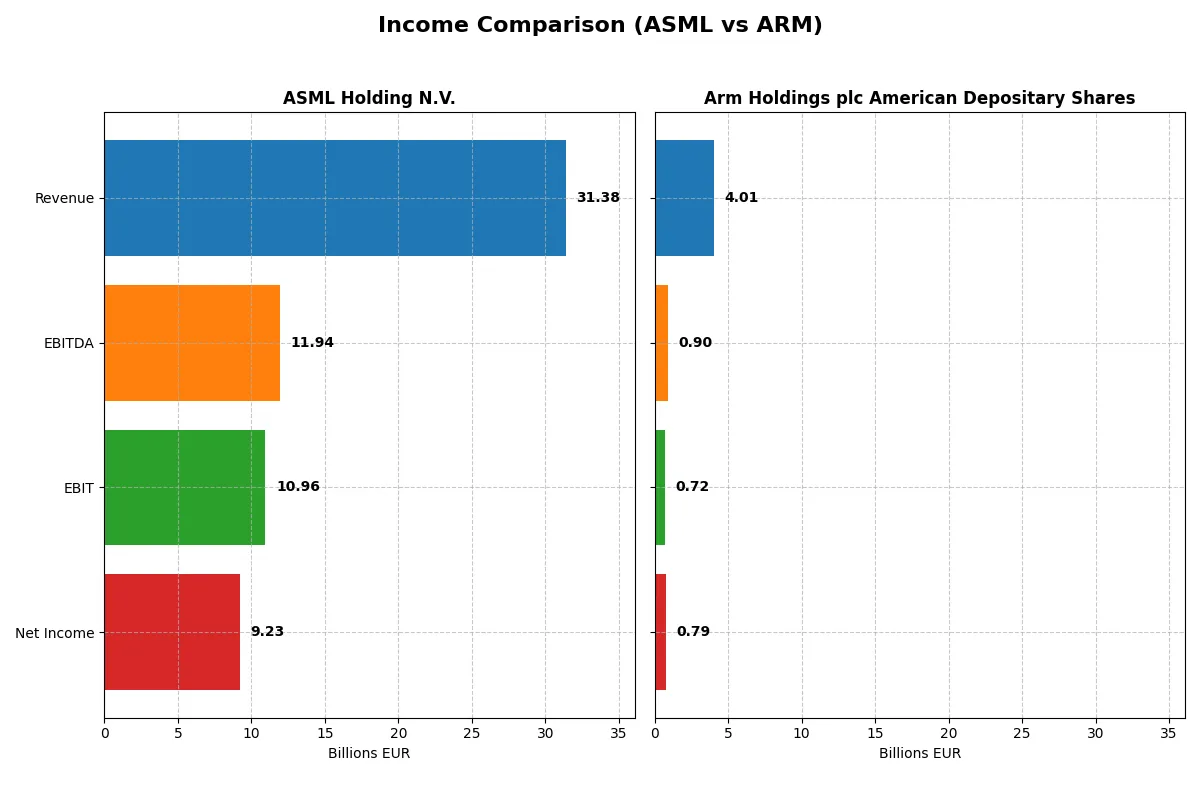
Income Statement Comparison
This data dissects the core profitability and scalability of both corporate engines to reveal who dominates the bottom line:
| Metric | ASML Holding N.V. (ASML) | Arm Holdings plc ADS (ARM) |
|---|---|---|
| Revenue | 31.4B EUR | 4.0B USD |
| Cost of Revenue | 14.8B EUR | 206M USD |
| Operating Expenses | 5.7B EUR | 3.0B USD |
| Gross Profit | 16.6B EUR | 3.8B USD |
| EBITDA | 11.9B EUR | 903M USD |
| EBIT | 11.0B EUR | 720M USD |
| Interest Expense | 0 | 0 |
| Net Income | 9.2B EUR | 792M USD |
| EPS | 23.76 EUR | 0.75 USD |
| Fiscal Year | 2025 | 2025 |
Income Statement Analysis: The Bottom-Line Duel
A precise income statement comparison reveals which company runs its corporate engine with superior efficiency and momentum.
ASML Holding N.V. Analysis
ASML’s revenue climbed from 18.6B EUR in 2021 to 31.4B EUR in 2025, reflecting robust growth. Net income surged from 5.9B EUR to 9.2B EUR, pushing net margin to a healthy 29.4%. Gross and EBIT margins exceed 50% and 34%, respectively, showcasing strong cost control and operational leverage in 2025.
Arm Holdings plc American Depositary Shares Analysis
Arm doubled revenue from 2.0B USD in 2021 to 4.0B USD in 2025, with net income nearly doubling to 792M USD. Its gross margin impresses at 94.9%, though EBIT margin lags at 18%. The latest year shows sharp EBIT and net margin expansion, signaling improving profitability and efficient scaling.
Margin Strength vs. Growth Velocity
ASML dominates with superior absolute profits and margins, reflecting a mature, high-moat semiconductor equipment business. Arm impresses with faster revenue and earnings growth and exceptional gross margins, but lower operating margins limit bottom-line leverage. ASML suits investors seeking strong margin power; Arm appeals to those valuing rapid growth momentum.
Financial Ratios Comparison
These vital ratios act as a diagnostic tool to expose the underlying fiscal health, valuation premiums, and capital efficiency of the companies analyzed:
| Ratios | ASML Holding N.V. (ASML) | Arm Holdings plc ADS (ARM) |
|---|---|---|
| ROE | 47.1% | 11.6% |
| ROIC | 34.1% | 10.3% |
| P/E | 38.3 | 141.6 |
| P/B | 18.0 | 16.4 |
| Current Ratio | 1.26 | 5.20 |
| Quick Ratio | 0.79 | 5.20 |
| D/E (Debt-to-Equity) | 0.14 | 0.05 |
| Debt-to-Assets | 5.4% | 4.0% |
| Interest Coverage | N/A | N/A |
| Asset Turnover | 0.62 | 0.45 |
| Fixed Asset Turnover | 3.81 | 5.61 |
| Payout Ratio | 26.5% | 0% |
| Dividend Yield | 0.69% | 0% |
| Fiscal Year | 2025 | 2025 |
Efficiency & Valuation Duel: The Vital Signs
Financial ratios act as a company’s DNA, exposing hidden risks and signaling operational strengths that shape investor decisions.
ASML Holding N.V.
ASML displays robust profitability with a 47.1% ROE and a strong 29.4% net margin, confirming superior operational efficiency. However, the stock trades at a stretched 38.3 P/E and 18.1 P/B, signaling a premium valuation. Shareholders receive modest 0.69% dividends, reflecting a cautious capital return balanced with heavy R&D investment.
Arm Holdings plc American Depositary Shares
Arm posts a moderate 11.6% ROE and 19.8% net margin, indicating decent but less efficient profitability. Its valuation is markedly high with a 141.6 P/E and 16.4 P/B, suggesting an expensive stock. The company pays no dividend, opting to channel resources aggressively into R&D, targeting long-term growth over immediate shareholder payouts.
Premium Valuation vs. Operational Safety
ASML offers a more favorable risk-reward balance, blending strong profitability with controlled leverage despite a high valuation. Arm appears stretched with weaker returns and sky-high multiples, fitting investors comfortable with growth risk and reinvestment focus. Investors seeking operational safety and steady returns may prefer ASML’s profile.
Which one offers the Superior Shareholder Reward?
I compare ASML Holding N.V. and Arm Holdings plc’s distribution strategies. ASML pays a modest dividend yield near 0.7–1.2%, supported by a payout ratio around 27–44%, reflecting solid free cash flow coverage above 80%. Meanwhile, Arm pays no dividends, reinvesting heavily in R&D and growth, evident from its minimal free cash flow per share (~0.17–0.92 USD) and zero payout ratio. ASML also runs an active buyback program, enhancing shareholder value by reducing share count, while Arm’s buyback activity is negligible. Historically in tech, dividends combined with buybacks provide tangible returns amidst market cycles. I see ASML’s balanced distribution, backed by sustainable cash flow and capital allocation, as a superior total return model for 2026 investors compared to Arm’s high valuation and reinvestment risk.
Comparative Score Analysis: The Strategic Profile
The radar chart reveals the fundamental DNA and trade-offs of ASML Holding N.V. and Arm Holdings plc American Depositary Shares:
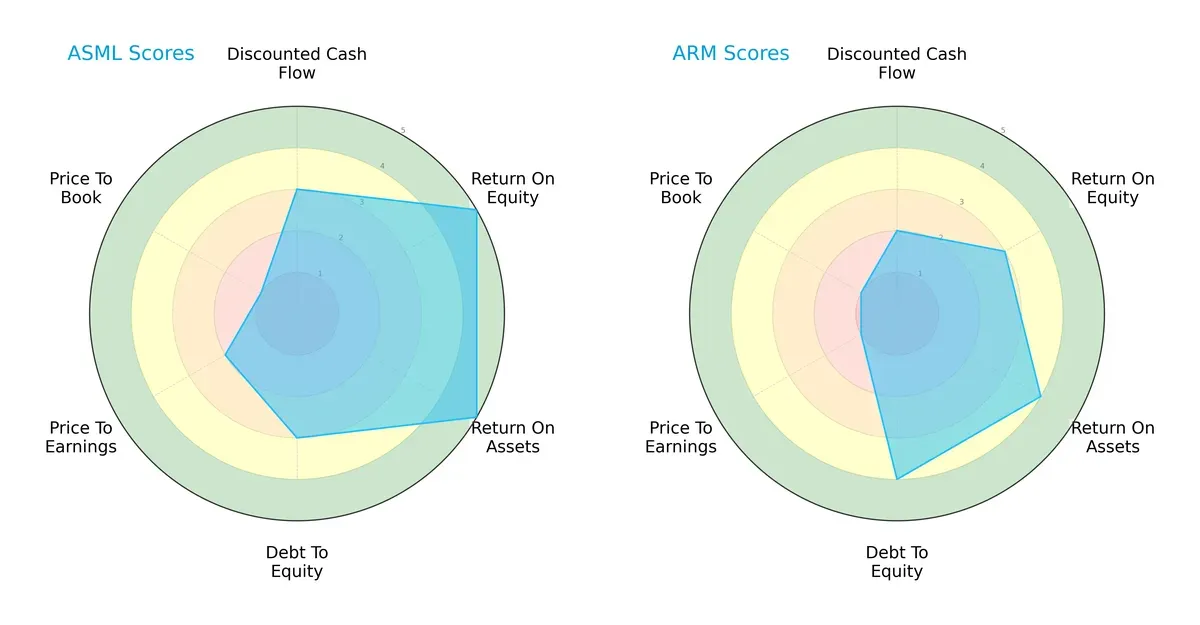
ASML excels with very favorable ROE and ROA scores, highlighting operational efficiency. Arm holds an edge in debt-to-equity, indicating stronger balance sheet discipline. ASML’s valuation metrics lag, showing potential overvaluation risk, while Arm’s valuation scores are very unfavorable, suggesting deep market skepticism. ASML presents a more balanced profile; Arm relies on financial prudence amid market doubts.
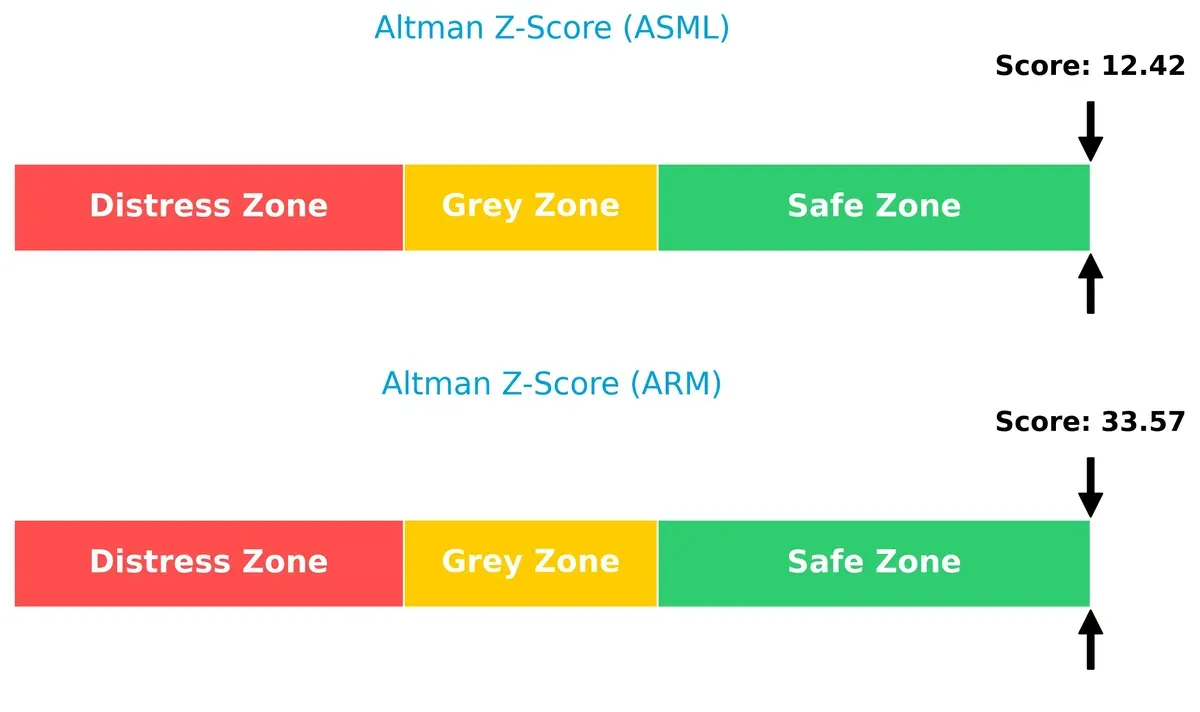
Bankruptcy Risk: Solvency Showdown
Arm’s Altman Z-Score of 33.57 far exceeds ASML’s 12.42, both firmly in the safe zone, implying exceptional long-term solvency for both firms in this cycle:
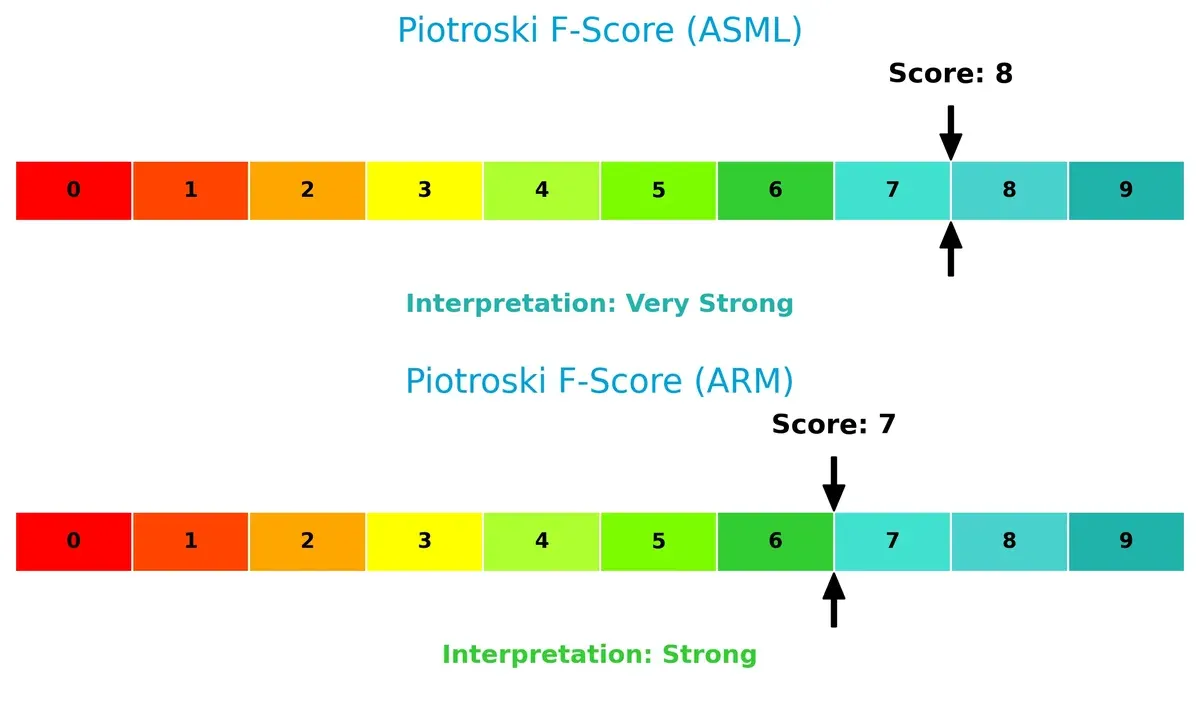
Financial Health: Quality of Operations
ASML’s Piotroski score of 8 surpasses Arm’s 7, signaling peak financial health and fewer internal red flags compared to its peer:
How are the two companies positioned?
This section dissects the operational DNA of ASML and Arm by comparing their revenue distribution by segment and internal dynamics, including strengths and weaknesses. The final objective confronts their economic moats to identify which model offers the most resilient and sustainable competitive advantage today.
Revenue Segmentation: The Strategic Mix
This comparison dissects how ASML Holding N.V. and Arm Holdings plc diversify their income streams and highlights where their primary sector bets lie:
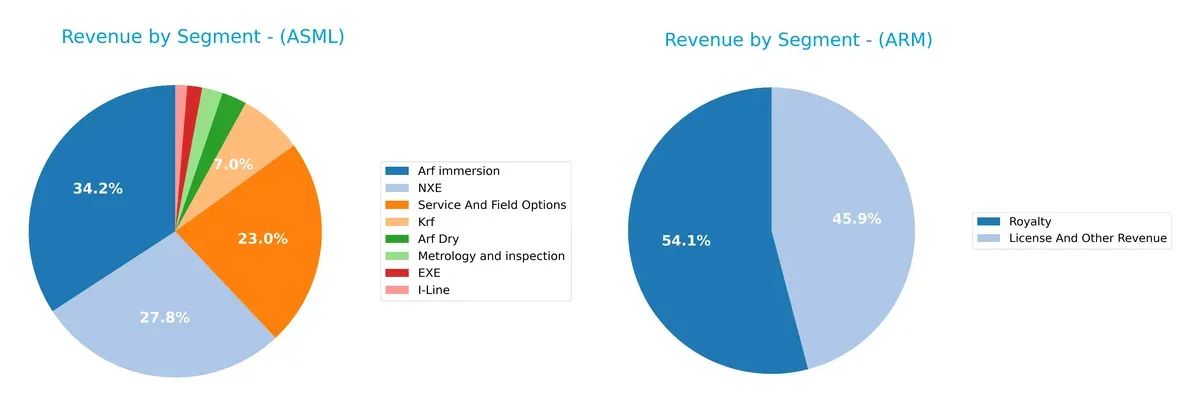
ASML anchors its revenue in specialized lithography systems, with Arf immersion at 9.7B and NXE at 7.9B in 2024, complemented by a strong service segment at 6.5B. Arm pivots on two core streams: royalties at 2.2B and licenses at 1.8B, showing less diversification. ASML’s broad portfolio reduces risk via ecosystem lock-in, while Arm’s reliance on royalties underscores vulnerability to semiconductor cycle swings.
Strengths and Weaknesses Comparison
This table compares the Strengths and Weaknesses of ASML Holding N.V. and Arm Holdings plc American Depositary Shares:
ASML Strengths
- High net margin at 29.42%
- ROE very strong at 47.08%
- ROIC well above WACC at 34.14%
- Low debt-to-assets at 5.36%
- Strong fixed asset turnover at 3.81
- Diverse, large global presence with major Asia and US markets
ARM Strengths
- Favorable net margin at 19.77%
- Very low debt-to-assets at 3.99%
- Perfect interest coverage
- High quick ratio at 5.2
- Strong fixed asset turnover at 5.61
- Growing royalty and licensing revenue streams
ASML Weaknesses
- Unfavorable WACC at 10.08%
- High PE and PB ratios indicating expensive valuation
- Quick ratio below 1 at 0.79
- Low dividend yield at 0.69%
- Asset turnover moderate at 0.62
ARM Weaknesses
- Unfavorable WACC very high at 24.32%
- ROIC below WACC at 10.28%
- Very high PE ratio at 141.58
- Overly high current ratio at 5.2 indicating idle assets
- Zero dividend yield
- Asset turnover weak at 0.45
ASML exhibits robust profitability and efficient capital use but faces valuation and liquidity concerns. ARM shows strengths in liquidity and fixed asset efficiency but struggles with high valuation multiples and returns not exceeding capital costs. These factors shape the strategic challenges both firms must manage.
The Moat Duel: Analyzing Competitive Defensibility
A structural moat protects long-term profits from relentless competition erosion. Only such moats sustain value over time:
ASML Holding N.V.: Technological Innovation & Scale Moat
ASML’s competitive edge lies in proprietary lithography tech and scale. Its 24% ROIC above WACC confirms durable value creation. Expanding EUV systems deepen this moat in 2026.
Arm Holdings plc: Intellectual Property Licensing Moat
Arm’s moat stems from its dominant CPU architecture licensing. Unlike ASML, Arm’s ROIC trails WACC, signaling value erosion. Growing adoption in new markets offers a turnaround opportunity.
Verdict: Technological Dominance vs. Licensing Reliance
ASML’s wider moat reflects robust capital efficiency and innovation leadership. Arm’s licensing model faces margin pressure despite growth. ASML stands better poised to defend and expand market share.
Which stock offers better returns?
Over the past year, ASML Holding N.V. showed strong price growth with accelerating momentum, while Arm Holdings plc ADS experienced a notable decline and decelerating trend.
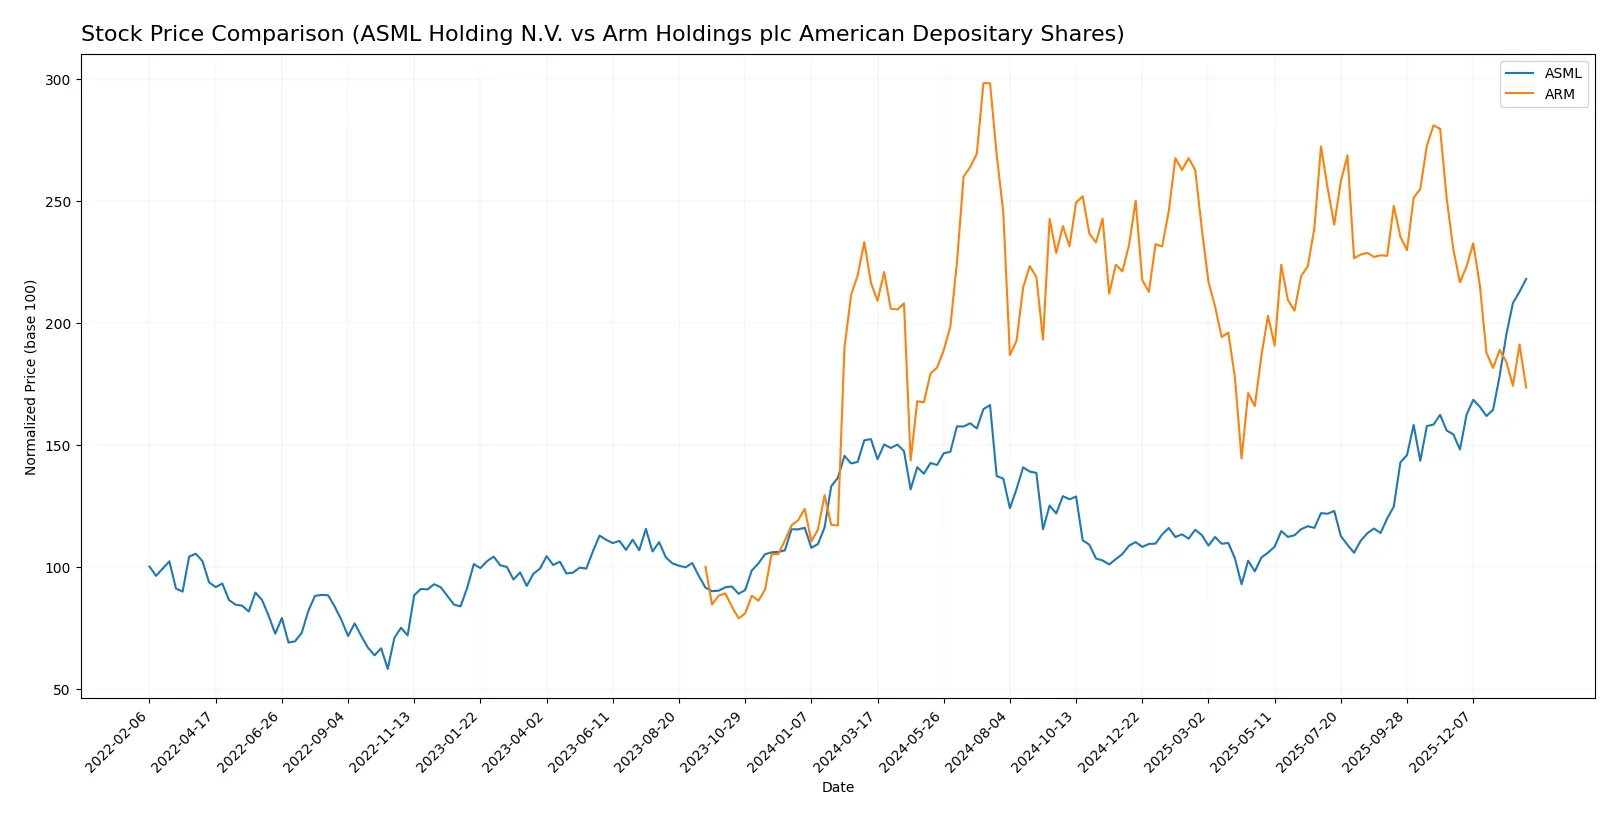
Trend Comparison
ASML’s stock gained 43.11% over 12 months, marking a bullish trend with accelerating price momentum and a high of 1423.0. Volatility is elevated, with a std deviation of 170.09.
Arm Holdings’ shares fell 19.87% in the same period, indicating a bearish trend with deceleration. Price volatility remains low compared to ASML, with a std deviation of 19.62.
ASML outperformed Arm Holdings, delivering stronger market returns marked by sustained price acceleration versus Arm’s persistent decline.
Target Prices
Analysts present a cautiously optimistic consensus for ASML Holding N.V. and Arm Holdings plc.
| Company | Target Low | Target High | Consensus |
|---|---|---|---|
| ASML Holding N.V. | 1150 | 1911 | 1458.5 |
| Arm Holdings plc American Depositary Shares | 120 | 170 | 145 |
The ASML consensus target of 1458.5 slightly exceeds its current price of 1423, indicating modest upside potential. Arm’s 145 consensus target suggests a significant premium to its 105.36 current price, reflecting strong growth expectations.

Don’t Let Luck Decide Your Entry Point
Optimize your entry points with our advanced ProRealTime indicators. You’ll get efficient buy signals with precise price targets for maximum performance. Start outperforming now!
How do institutions grade them?
ASML Holding N.V. Grades
Here are the latest institutional grades for ASML Holding N.V.:
| Grading Company | Action | New Grade | Date |
|---|---|---|---|
| Barclays | Upgrade | Overweight | 2026-01-29 |
| Wells Fargo | Maintain | Overweight | 2026-01-29 |
| RBC Capital | Maintain | Outperform | 2026-01-29 |
| Bernstein | Maintain | Outperform | 2026-01-22 |
| KGI Securities | Upgrade | Outperform | 2026-01-15 |
| Wells Fargo | Maintain | Overweight | 2026-01-15 |
| JP Morgan | Maintain | Overweight | 2026-01-14 |
| Bernstein | Upgrade | Outperform | 2026-01-05 |
| B of A Securities | Maintain | Buy | 2025-12-03 |
| JP Morgan | Maintain | Overweight | 2025-12-01 |
Arm Holdings plc American Depositary Shares Grades
Below are the recent institutional grades for Arm Holdings plc American Depositary Shares:
| Grading Company | Action | New Grade | Date |
|---|---|---|---|
| UBS | Maintain | Buy | 2026-01-26 |
| Wells Fargo | Maintain | Overweight | 2026-01-26 |
| Morgan Stanley | Maintain | Overweight | 2026-01-23 |
| Susquehanna | Upgrade | Positive | 2026-01-21 |
| B of A Securities | Downgrade | Neutral | 2026-01-13 |
| B of A Securities | Maintain | Buy | 2025-12-16 |
| Goldman Sachs | Downgrade | Sell | 2025-12-15 |
| Loop Capital | Maintain | Buy | 2025-11-12 |
| Benchmark | Maintain | Hold | 2025-11-06 |
| Needham | Maintain | Hold | 2025-11-06 |
Which company has the best grades?
ASML Holding N.V. consistently receives higher grades, such as multiple “Outperform” and “Overweight” ratings. Arm Holdings shows more mixed ratings, including downgrades to “Neutral” and “Sell.” Better grades may attract more investor confidence and potential demand for ASML shares.
Risks specific to each company
The following categories identify the critical pressure points and systemic threats facing both firms in the 2026 market environment:
1. Market & Competition
ASML Holding N.V.
- Dominates advanced lithography equipment with a strong moat in semiconductor manufacturing technology.
Arm Holdings plc American Depositary Shares
- Faces intense competition in CPU architecture licensing; innovation pace and licensing model pressure margins.
2. Capital Structure & Debt
ASML Holding N.V.
- Low debt-to-equity (0.14) and debt-to-assets (5.36%) ratios indicate conservative leverage and strong balance sheet.
Arm Holdings plc American Depositary Shares
- Even lower leverage with debt-to-equity at 0.05 and debt-to-assets under 4%, reflecting very prudent capital structure.
3. Stock Volatility
ASML Holding N.V.
- Beta of 1.34 implies moderate volatility, typical for tech sector leaders with global exposure.
Arm Holdings plc American Depositary Shares
- High beta at 4.36 signals extreme stock price swings and elevated market risk for investors.
4. Regulatory & Legal
ASML Holding N.V.
- Subject to export controls on semiconductor tech, especially with China tensions, impacting sales growth.
Arm Holdings plc American Depositary Shares
- Regulatory risks from IP licensing and antitrust scrutiny in multiple jurisdictions pose ongoing challenges.
5. Supply Chain & Operations
ASML Holding N.V.
- Complex, capital-intensive supply chain vulnerable to disruptions but backed by strong customer relationships.
Arm Holdings plc American Depositary Shares
- Licensing-based model less exposed to physical supply chain risks but dependent on semiconductor ecosystem health.
6. ESG & Climate Transition
ASML Holding N.V.
- Faces pressure to reduce energy use in manufacturing and align with stricter EU climate goals.
Arm Holdings plc American Depositary Shares
- ESG risks tied to software development practices and global data privacy regulations in multiple markets.
7. Geopolitical Exposure
ASML Holding N.V.
- Significant exposure to US-China tensions affecting sales and technology transfers.
Arm Holdings plc American Depositary Shares
- Geopolitical risk elevated by UK-US-China nexus and dependency on global semiconductor markets.
Which company shows a better risk-adjusted profile?
ASML’s most impactful risk is geopolitical tensions limiting market access. Arm’s primary risk is extreme stock volatility increasing investment uncertainty. I see ASML as having a better risk-adjusted profile due to its moderate volatility, robust capital structure, and dominant market position. Arm’s very high beta and stretched valuation present pronounced downside risks despite strong growth potential.
Final Verdict: Which stock to choose?
ASML’s superpower lies in its robust capital efficiency and durable competitive advantage, reflected in its very favorable moat and consistently growing ROIC. Its point of vigilance is the relatively high valuation multiples, which could pressure returns if growth slows. ASML suits portfolios focused on aggressive growth with a tolerance for premium pricing.
Arm Holdings commands a strategic moat through its dominant licensing model and recurring revenue streams, providing a unique safety cushion compared to ASML. While its financial efficiency lags, Arm’s strong cash position and innovation pipeline appeal to investors seeking growth at a reasonable price (GARP) with a moderate risk profile.
If you prioritize durable economic moats and proven capital efficiency, ASML outshines with superior value creation and growth momentum. However, if you seek exposure to scalable IP licensing with better balance sheet stability, Arm offers a compelling scenario despite its current valuation challenges. Both require careful risk assessment aligned to your investment horizon and risk appetite.
Disclaimer: Investment carries a risk of loss of initial capital. The past performance is not a reliable indicator of future results. Be sure to understand risks before making an investment decision.
Go Further
I encourage you to read the complete analyses of ASML Holding N.V. and Arm Holdings plc American Depositary Shares to enhance your investment decisions: