Home > Comparison > Technology > ASML vs AMBA
The strategic rivalry between ASML Holding N.V. and Ambarella, Inc. shapes the semiconductor sector’s innovation frontier. ASML operates as a capital-intensive industrial giant focused on advanced lithography systems, while Ambarella specializes in high-margin, AI-driven video processing chips. This head-to-head embodies a clash between scale and specialization. This analysis will uncover which company’s trajectory offers a superior risk-adjusted outlook for a diversified technology portfolio.

Table of contents
Companies Overview
ASML Holding N.V. and Ambarella, Inc. shape critical segments of the semiconductor landscape with distinct market roles and innovation paths.
ASML Holding N.V.: Semiconductor Equipment Titan
ASML dominates advanced semiconductor equipment, specializing in lithography systems essential for chip fabrication. Its revenue stems from selling and servicing cutting-edge lithography and metrology systems. In 2026, ASML focuses strategically on expanding extreme ultraviolet lithography technology to support the next generation of semiconductor nodes and maintain its technological edge.
Ambarella, Inc.: Video Semiconductor Innovator
Ambarella leads in semiconductor solutions for HD and ultra HD video processing, integrating AI and computer vision on single chips. Its core revenue comes from system-on-a-chip designs powering automotive cameras, security systems, and consumer devices. The company prioritizes enhancing neural network processing capabilities to capture growth in autonomous vehicles and smart imaging applications this year.
Strategic Collision: Similarities & Divergences
Both companies excel in semiconductor innovation but diverge sharply in scope: ASML provides capital-intensive lithography tools, while Ambarella delivers embedded video processing chips. They compete indirectly within the broader semiconductor ecosystem, particularly in advanced tech enabling next-gen electronics. ASML’s scale and specialized equipment contrast with Ambarella’s agility in AI-driven imaging, creating distinct investment profiles with different risk and growth dynamics.
Income Statement Comparison
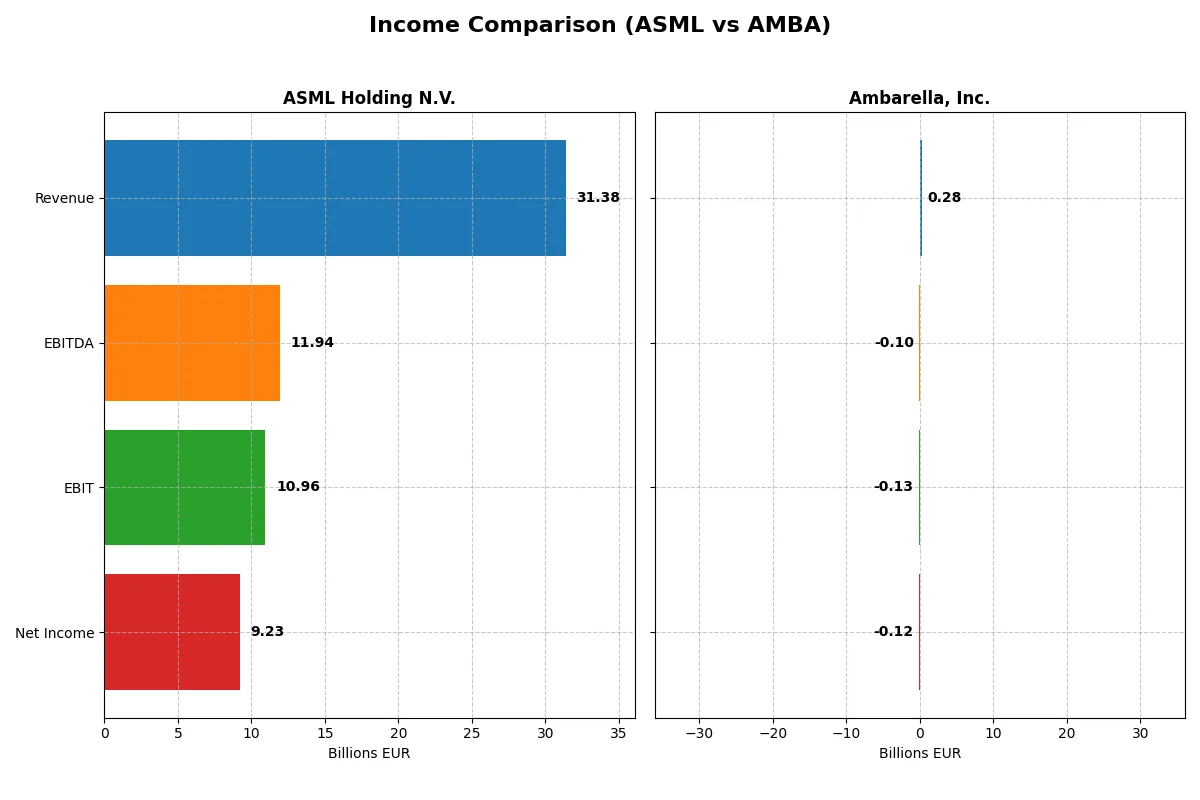
This data dissects the core profitability and scalability of both corporate engines to reveal who dominates the bottom line:
| Metric | ASML Holding N.V. (ASML) | Ambarella, Inc. (AMBA) |
|---|---|---|
| Revenue | 31.4B EUR | 285M USD |
| Cost of Revenue | 14.8B EUR | 113M USD |
| Operating Expenses | 5.72B EUR | 299M USD |
| Gross Profit | 16.6B EUR | 172M USD |
| EBITDA | 11.9B EUR | -101M USD |
| EBIT | 11.0B EUR | -127M USD |
| Interest Expense | 0 | 0 |
| Net Income | 9.23B EUR | -117M USD |
| EPS | 23.76 EUR | -2.84 USD |
| Fiscal Year | 2025 | 2025 |
Income Statement Analysis: The Bottom-Line Duel
This income statement comparison reveals which company efficiently converts revenue into profit, highlighting operational strength and margin discipline.
ASML Holding N.V. Analysis
ASML’s revenue climbed steadily from 18.6B EUR in 2021 to 31.4B EUR in 2025, with net income rising from 5.9B to 9.2B EUR. Its gross margin remains strong at 52.8%, while net margin sits near 29.4%. The latest year shows robust momentum, with EBIT growing 19% and EPS up 23%, signaling operational efficiency and solid profitability.
Ambarella, Inc. Analysis
Ambarella’s revenue varies from 223M USD in 2021 to 285M USD in 2025, showing moderate growth. However, net income stays negative, widening to -117M USD in 2025 despite a 26% rise in gross margin to 60.5%. EBIT and net margins remain deeply negative, reflecting ongoing losses and challenges in controlling expenses despite improving revenue momentum.
Verdict: Profitability Strength vs. Growth Struggles
ASML clearly outperforms Ambarella in profit generation and margin control, boasting high and expanding net margins versus Ambarella’s persistent losses. ASML’s efficient capital allocation and scale make it the fundamental winner. Investors seeking profitability and operational resilience will find ASML’s profile more compelling than Ambarella’s growth-at-a-losses model.
Financial Ratios Comparison
These vital ratios act as a diagnostic tool to expose the underlying fiscal health, valuation premiums, and capital efficiency of the companies analyzed:
| Ratios | ASML Holding N.V. (ASML) | Ambarella, Inc. (AMBA) |
|---|---|---|
| ROE | 47.08% | -20.86% |
| ROIC | 34.14% | -21.96% |
| P/E | 38.33 | -27.05 |
| P/B | 18.05 | 5.64 |
| Current Ratio | 1.26 | 2.65 |
| Quick Ratio | 0.79 | 2.36 |
| D/E | 0.14 | 0.01 |
| Debt-to-Assets | 5.36% | 0.76% |
| Interest Coverage | N/A | N/A |
| Asset Turnover | 0.62 | 0.41 |
| Fixed Asset Turnover | 3.81 | 19.96 |
| Payout ratio | 26.54% | 0% |
| Dividend yield | 0.69% | 0% |
| Fiscal Year | 2025 | 2025 |
Efficiency & Valuation Duel: The Vital Signs
Financial ratios act as a company’s DNA, revealing hidden risks and operational excellence behind headline figures.
ASML Holding N.V.
ASML delivers a strong 47% ROE and a robust 29.4% net margin, signaling exceptional profitability. However, the stock trades at a stretched P/E of 38.3 and a P/B of 18.1, indicating expensive valuation. Shareholders receive a modest 0.69% dividend yield, reflecting a balanced approach between returns and reinvestment in innovation.
Ambarella, Inc.
Ambarella suffers from deeply negative profitability, with a -20.9% ROE and -41.1% net margin, indicating operational challenges. Its P/E is negative, but a P/B of 5.64 remains elevated. The company holds strong liquidity and low leverage, yet offers no dividends, focusing investments heavily on R&D to fuel future growth.
Premium Valuation vs. Operational Safety
ASML commands a premium valuation justified by stellar profitability and disciplined capital allocation. Ambarella shows liquidity strength but struggles with negative returns and no income generation. ASML fits investors seeking operational excellence and steady returns, while Ambarella suits those embracing high-risk growth potential.
Which one offers the Superior Shareholder Reward?
I observe ASML Holding N.V. delivers a balanced distribution with a steady dividend yield near 0.7–1.2% and a sustainable payout ratio around 26–44%. Their buyback program complements this, supported by strong free cash flow exceeding 24/share in 2025. Ambarella, Inc. pays no dividend, focusing all cash flow on reinvestment amid persistent net losses and negative margins. Its buyback activity is minimal or absent, reflecting financial strain and weak profitability. ASML’s model offers a superior total return profile in 2026, blending reliable income with disciplined buybacks and robust free cash flow sustainability. Ambarella’s reinvestment strategy appears riskier without current shareholder rewards.
Comparative Score Analysis: The Strategic Profile
The radar chart reveals the fundamental DNA and trade-offs of ASML Holding N.V. and Ambarella, Inc., highlighting their strategic financial strengths and weaknesses:
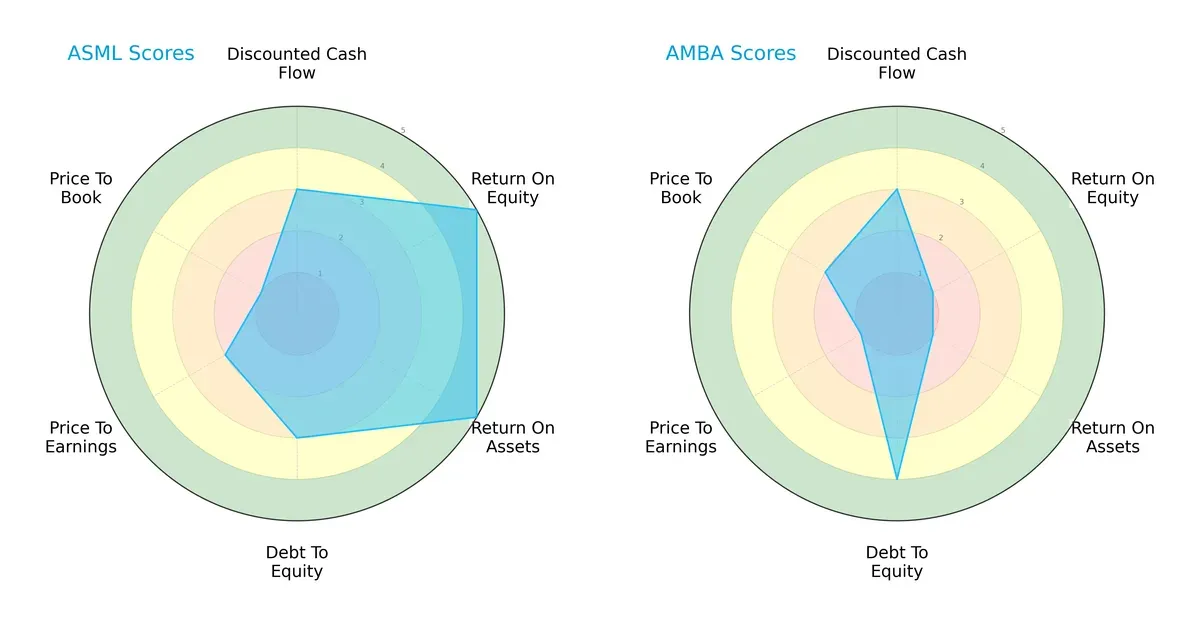
ASML demonstrates a more balanced profile with very favorable ROE and ROA scores (5 each), indicating efficient profit generation and asset utilization. Ambarella relies on a lower debt-to-equity risk (score 4) but shows very unfavorable returns on equity and assets (score 1 each). ASML’s valuation metrics (PE 2, PB 1) suggest moderate to unfavorable pricing, while Ambarella’s are weaker overall. ASML’s broader strengths make it the more robust choice in this comparison.
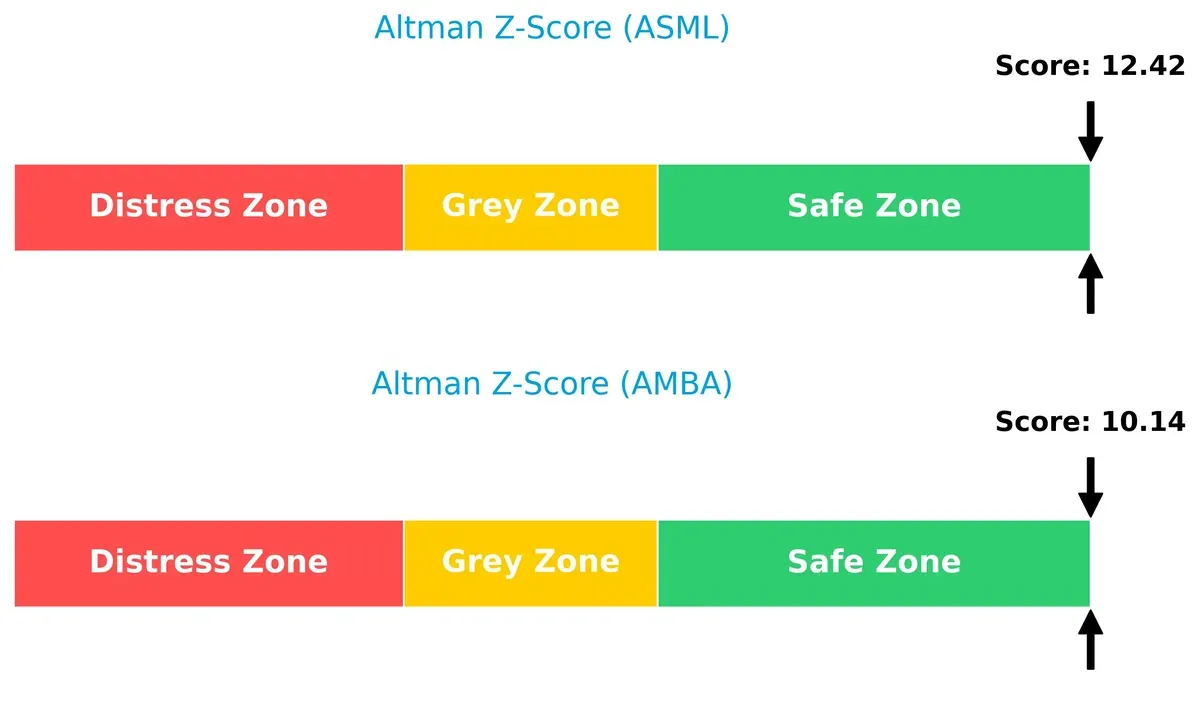
Bankruptcy Risk: Solvency Showdown
ASML’s Altman Z-Score at 12.42 surpasses Ambarella’s 10.14, both comfortably in the safe zone, implying strong long-term survival prospects for each firm in this cycle:
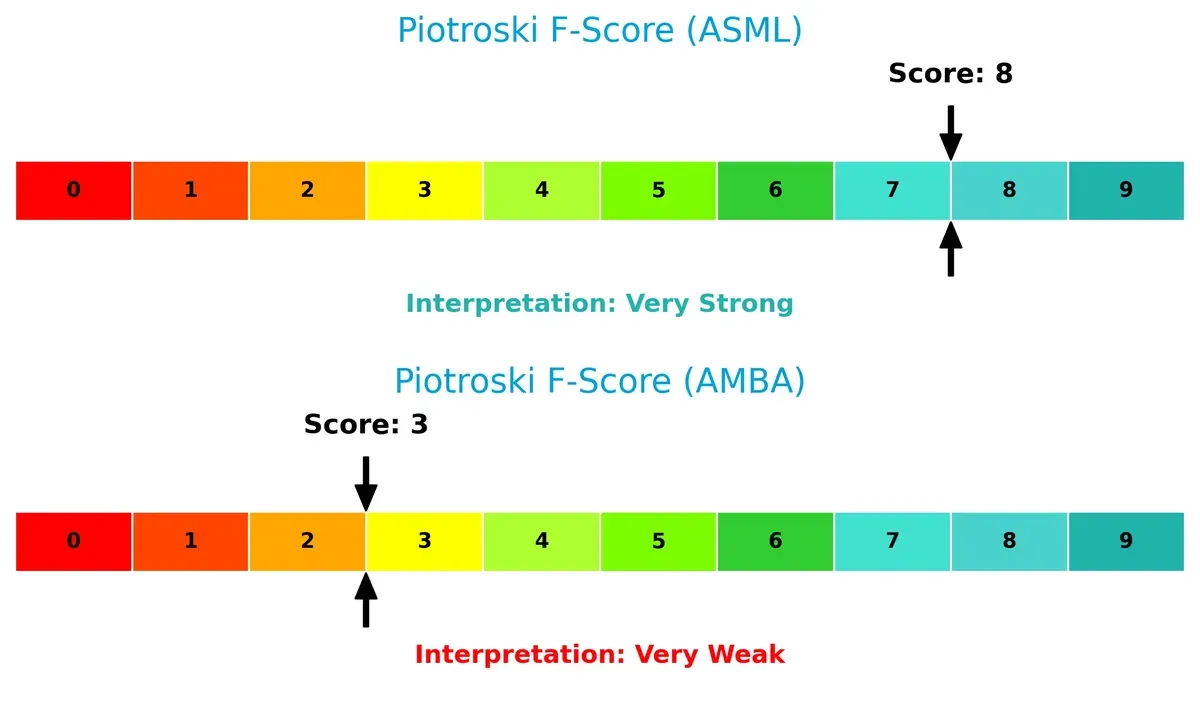
Financial Health: Quality of Operations
ASML’s Piotroski F-Score of 8 signals very strong financial health, while Ambarella’s score of 3 raises red flags about internal operational weaknesses:
How are the two companies positioned?
This section dissects ASML and Ambarella’s operational DNA by comparing revenue distribution and internal dynamics—strengths and weaknesses. The goal is to confront their economic moats to reveal which model offers the most sustainable competitive edge today.
Revenue Segmentation: The Strategic Mix
This comparison dissects how ASML Holding N.V. and Ambarella, Inc. diversify their income streams and reveals where their primary sector bets lie:
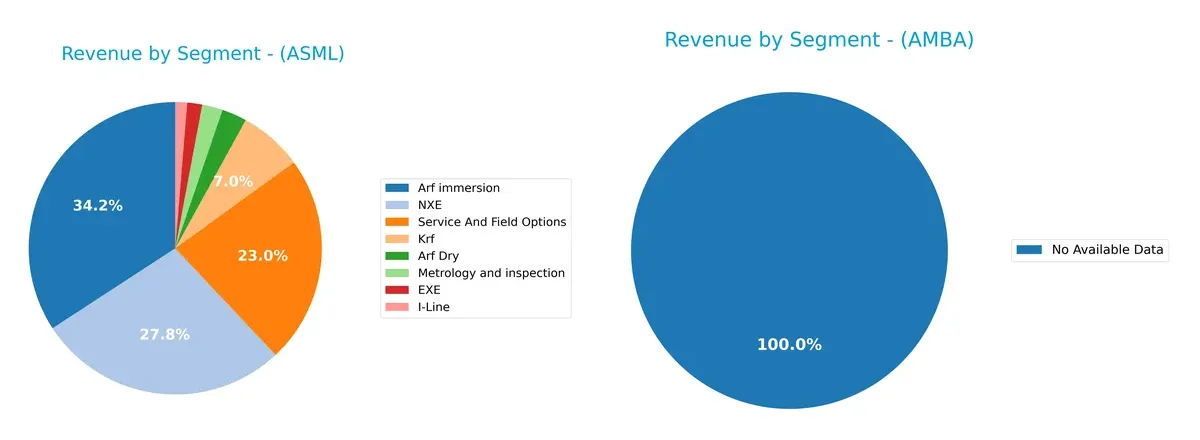
ASML shows a diversified revenue mix anchored by Arf immersion at 9.7B and NXE at 7.9B in 2024. Service and Field Options also contribute a strong 6.5B, highlighting a robust aftermarket ecosystem. Ambarella lacks available data, so I cannot assess its segmentation. ASML’s broad portfolio reduces concentration risk and strengthens its infrastructure dominance in semiconductor lithography. This diversity supports resilience against cyclical downturns.
Strengths and Weaknesses Comparison
This table compares the Strengths and Weaknesses of ASML and AMBA:
ASML Strengths
- High profitability with net margin at 29.42%
- Strong ROE of 47.08% and ROIC of 34.14%
- Low debt-to-assets at 5.36% with favorable interest coverage
- Broad global presence with key markets in China, Korea, Taiwan, and the US
- Diverse product segments including EUV and service options
- Solid fixed asset turnover at 3.81
AMBA Strengths
- Strong liquidity with current ratio 2.65 and quick ratio 2.36
- Very low debt-to-assets at 0.76% and low debt-to-equity
- Favorable PE ratio despite losses
- High fixed asset turnover at 19.96
- Presence in Asia Pacific, Taiwan, Europe, and North America
- Low leverage supports financial flexibility
ASML Weaknesses
- Elevated valuation multiples: PE 38.33, PB 18.05
- Quick ratio below 1 at 0.79 signals weaker short-term liquidity
- WACC at 10.08% exceeds ROIC margin of safety
- Dividend yield low at 0.69%
- Moderate asset turnover at 0.62 limits capital efficiency
AMBA Weaknesses
- Negative profitability with net margin -41.12% and ROE -20.86%
- Negative ROIC at -21.96% far below WACC of 12.99%
- Interest coverage at 0 indicates risk in meeting interest obligations
- Unfavorable PB at 5.64 and negative PE ratio
- Lower asset turnover at 0.41 signals inefficiency
- No dividend yield
Overall, ASML demonstrates robust profitability and global diversification but faces valuation and liquidity scrutiny. AMBA shows strong liquidity and low leverage but struggles with profitability and capital efficiency. These contrasts highlight differing strategic and financial challenges each company must manage going forward.
The Moat Duel: Analyzing Competitive Defensibility
A structural moat is the last barrier protecting long-term profits from erosion by competition and market shifts. Here’s the moat analysis for two semiconductor players:
ASML Holding N.V.: Technological Exclusivity with Scale Economies
ASML’s moat stems from its proprietary extreme ultraviolet lithography technology, creating massive switching costs for chipmakers. This manifests in a high ROIC above WACC by 24%, with stable margins near 30%. Expansion into new nodes and computational lithography in 2026 should deepen this moat.
Ambarella, Inc.: Niche Innovation Amid Margin Pressure
Ambarella relies on specialized system-on-chip designs for video processing, but its moat is narrower and based on product differentiation rather than scale. It suffers a negative ROIC versus WACC, signaling value destruction and margin instability. Growth in AI camera markets offers upside, but the overall moat is vulnerable.
Moat Strength: Proprietary Technology vs. Product Differentiation
ASML’s wide and durable moat, driven by patented tech and scale, outmatches Ambarella’s shrinking, product-based moat. ASML is far better positioned to defend and grow its market share in an intensifying semiconductor landscape.
Which stock offers better returns?
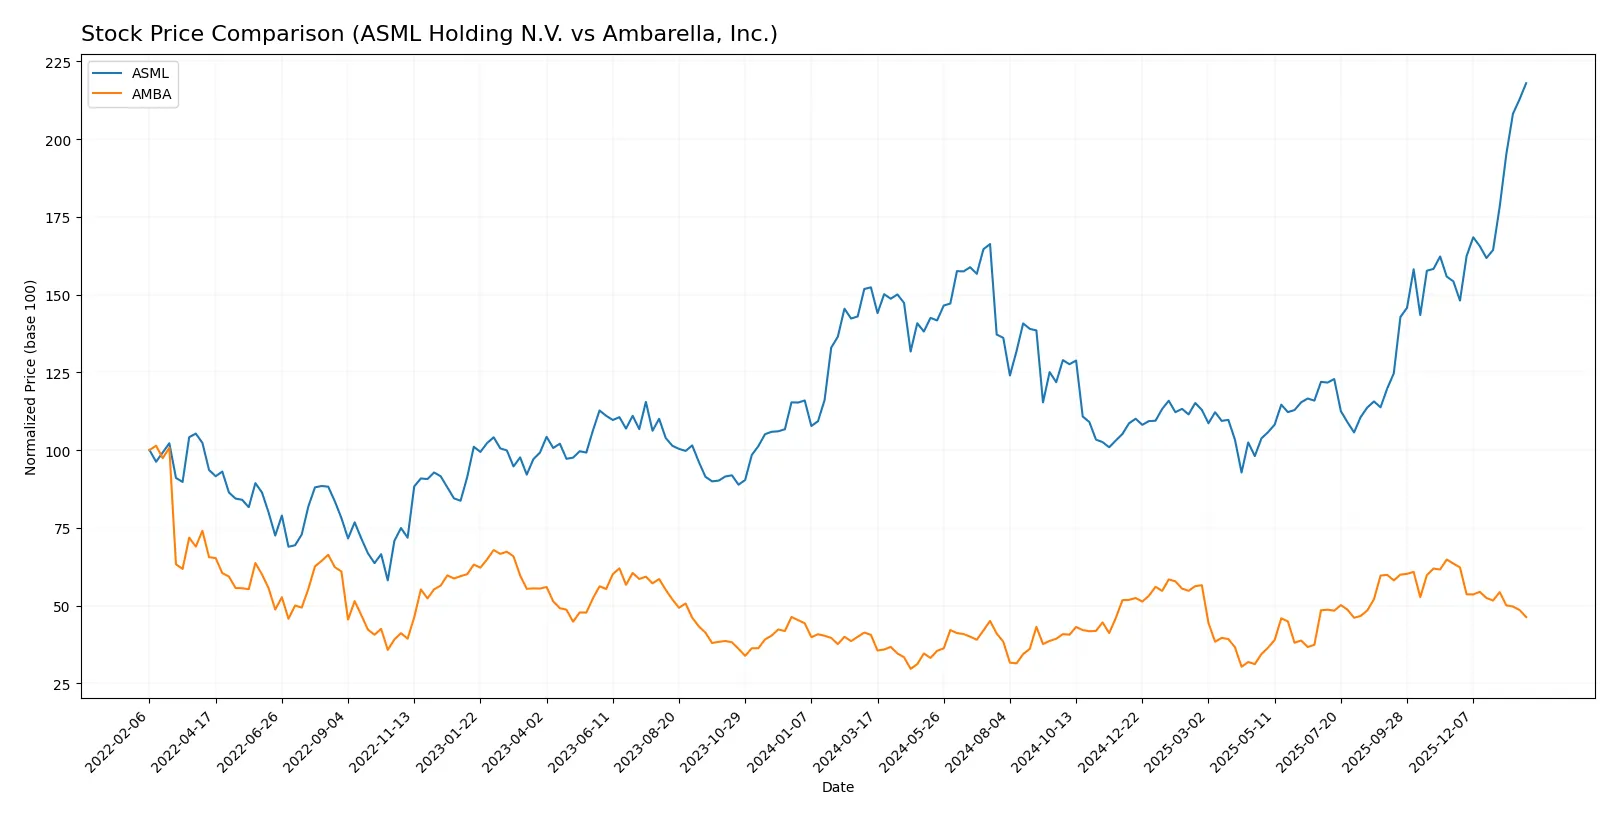
Over the past 12 months, ASML Holding N.V. surged sharply by 43.11%, showing accelerating momentum, while Ambarella, Inc. gained 14.09% overall but has recently declined sharply.
Trend Comparison
ASML’s stock price rose 43.11% over the last year, indicating a bullish trend with accelerating gains and a high volatility of 170.09. The price peaked at 1423.0 and bottomed at 605.55.
Ambarella’s stock increased 14.09% over the same period, marking a bullish but decelerating trend. Recent months saw a 27.09% decline, with much lower volatility at 12.79.
ASML outperformed Ambarella significantly, delivering the highest returns and sustained price acceleration, contrasting with Ambarella’s recent sharp pullback.
Target Prices
Analysts show a cautiously optimistic consensus across both ASML Holding N.V. and Ambarella, Inc.
| Company | Target Low | Target High | Consensus |
|---|---|---|---|
| ASML Holding N.V. | 1150 | 1911 | 1458.5 |
| Ambarella, Inc. | 80 | 115 | 97.5 |
The ASML consensus target of 1458.5 slightly exceeds its current price at 1423, signaling moderate upside potential. Ambarella’s target consensus at 97.5 stands well above its 64.04 price, suggesting significant room for growth based on analyst expectations.

Don’t Let Luck Decide Your Entry Point
Optimize your entry points with our advanced ProRealTime indicators. You’ll get efficient buy signals with precise price targets for maximum performance. Start outperforming now!
How do institutions grade them?
ASML Holding N.V. Grades
Here are the recent institutional grades for ASML Holding N.V.:
| Grading Company | Action | New Grade | Date |
|---|---|---|---|
| Barclays | Upgrade | Overweight | 2026-01-29 |
| Wells Fargo | Maintain | Overweight | 2026-01-29 |
| RBC Capital | Maintain | Outperform | 2026-01-29 |
| Bernstein | Maintain | Outperform | 2026-01-22 |
| KGI Securities | Upgrade | Outperform | 2026-01-15 |
| Wells Fargo | Maintain | Overweight | 2026-01-15 |
| JP Morgan | Maintain | Overweight | 2026-01-14 |
| Bernstein | Upgrade | Outperform | 2026-01-05 |
| B of A Securities | Maintain | Buy | 2025-12-03 |
| JP Morgan | Maintain | Overweight | 2025-12-01 |
Ambarella, Inc. Grades
Here are the recent institutional grades for Ambarella, Inc.:
| Grading Company | Action | New Grade | Date |
|---|---|---|---|
| Stifel | Maintain | Buy | 2025-11-26 |
| Needham | Maintain | Buy | 2025-11-26 |
| B of A Securities | Maintain | Neutral | 2025-11-26 |
| Rosenblatt | Maintain | Buy | 2025-11-26 |
| Rosenblatt | Maintain | Buy | 2025-11-24 |
| Oppenheimer | Maintain | Perform | 2025-08-29 |
| B of A Securities | Maintain | Neutral | 2025-08-29 |
| Needham | Maintain | Buy | 2025-08-29 |
| Rosenblatt | Maintain | Buy | 2025-08-29 |
| Morgan Stanley | Maintain | Overweight | 2025-08-29 |
Which company has the best grades?
ASML Holding N.V. consistently receives higher grades like Outperform and Overweight from top-tier firms. Ambarella, Inc. mostly holds Buy and Neutral ratings. ASML’s stronger grades suggest greater institutional confidence, potentially attracting more investor interest.
Risks specific to each company
The following categories identify critical pressure points and systemic threats facing ASML Holding N.V. and Ambarella, Inc. in the 2026 market environment:
1. Market & Competition
ASML Holding N.V.
- Dominates semiconductor equipment with strong moats but faces high capital intensity and technology cycles.
Ambarella, Inc.
- Faces intense competition in semiconductor video solutions with shrinking margins and innovation pressure.
2. Capital Structure & Debt
ASML Holding N.V.
- Low debt-to-equity (0.14) and strong interest coverage signal solid financial stability.
Ambarella, Inc.
- Minimal debt load but zero interest coverage raises concerns about immediate solvency risks.
3. Stock Volatility
ASML Holding N.V.
- Beta of 1.34 indicates moderate sensitivity to market swings, typical for tech giants.
Ambarella, Inc.
- High beta of 1.95 reflects elevated volatility and risk exposure in a niche market.
4. Regulatory & Legal
ASML Holding N.V.
- Subject to stringent export controls due to advanced tech and geopolitical sensitivities.
Ambarella, Inc.
- Faces regulatory scrutiny in AI and automotive sectors but less exposure than ASML.
5. Supply Chain & Operations
ASML Holding N.V.
- Complex global supply chain vulnerable to component shortages and geopolitical disruptions.
Ambarella, Inc.
- Smaller scale supply chain with higher agility but dependent on key suppliers for specialized chips.
6. ESG & Climate Transition
ASML Holding N.V.
- Increasing focus on sustainable manufacturing; faces pressure to reduce carbon footprint.
Ambarella, Inc.
- Emerging ESG initiatives but limited scale and resources to lead climate transition.
7. Geopolitical Exposure
ASML Holding N.V.
- Significant exposure to Asia-Pacific tensions affecting supply and sales channels.
Ambarella, Inc.
- Primarily US-based but exposed to global markets vulnerable to trade restrictions.
Which company shows a better risk-adjusted profile?
ASML’s dominant market position and robust capital structure outweigh Ambarella’s operational and financial weaknesses. ASML’s Altman Z-score of 12.42 and Piotroski score of 8 confirm strong financial health. Ambarella’s negative margins and weaker scores reflect higher risks. The most impactful risk for ASML is geopolitical exposure disrupting supply chains. For Ambarella, prolonged unprofitability threatens survival. Overall, ASML offers a superior risk-adjusted profile supported by stable cash flows and market moat.
Final Verdict: Which stock to choose?
ASML excels as a powerhouse of innovation with a durable competitive moat rooted in its industry-leading ROIC well above WACC. Its unmatched efficiency in capital allocation and solid profitability make it a cash machine. The point of vigilance remains its lofty valuation multiples. ASML suits portfolios seeking Aggressive Growth with a tolerance for premium pricing.
Ambarella offers a strategic moat based on niche specialization and high R&D intensity, but it currently struggles with value destruction and negative returns. Its stronger liquidity ratios and low leverage signal a safer balance sheet relative to ASML. This profile fits well for GARP investors who prioritize growth potential with moderate risk tolerance.
If you prioritize durable competitive advantages and long-term value creation, ASML outshines with superior profitability and growth visibility despite valuation concerns. However, if you seek a more conservative exposure with an eye on recovery potential amid financial headwinds, Ambarella offers better stability and a less demanding price tag. Each appeals to distinct investor avatars, underscoring the need to align stock choice with individual risk and return objectives.
Disclaimer: Investment carries a risk of loss of initial capital. The past performance is not a reliable indicator of future results. Be sure to understand risks before making an investment decision.
Go Further
I encourage you to read the complete analyses of ASML Holding N.V. and Ambarella, Inc. to enhance your investment decisions: