Home > Comparison > Technology > ASML vs AMD
The strategic rivalry between ASML Holding N.V. and Advanced Micro Devices, Inc. defines the semiconductor sector’s evolution. ASML operates as a capital-intensive lithography equipment leader, while AMD focuses on high-margin, cutting-edge processor design. This head-to-head contrasts manufacturing infrastructure with innovative chip development. I will analyze which company’s trajectory offers superior risk-adjusted returns, guiding investors seeking durable exposure in this critical technology industry.
Table of contents
Companies Overview
ASML Holding N.V. and Advanced Micro Devices, Inc. shape the semiconductor industry with cutting-edge technology and innovation.
ASML Holding N.V.: Advanced Lithography Leader
ASML dominates semiconductor equipment systems with its lithography technology critical to chip manufacturing. Its revenue stems from selling and servicing extreme ultraviolet and deep ultraviolet lithography systems. In 2026, ASML focuses strategically on expanding its inspection and metrology solutions to enhance chip quality for global chipmakers.
Advanced Micro Devices, Inc.: Processor and GPU Innovator
AMD leads in x86 microprocessors and graphics processing units powering desktops, servers, and gaming consoles. Revenue comes from diverse product lines including Ryzen CPUs and Radeon GPUs. The company’s 2026 strategy prioritizes growth in data center processors and semi-custom SoCs, pushing compute performance across enterprise and consumer markets.
Strategic Collision: Similarities & Divergences
ASML and AMD both advance semiconductor technology but differ fundamentally: ASML operates as a supplier of essential manufacturing tools, whereas AMD designs end-user processors and graphics. Their primary battleground lies in the semiconductor value chain’s upstream (ASML) versus downstream (AMD). This distinction creates unique investment profiles—ASML offers exposure to chipmaker capital expenditure cycles, while AMD rides demand for computing power.
Income Statement Comparison
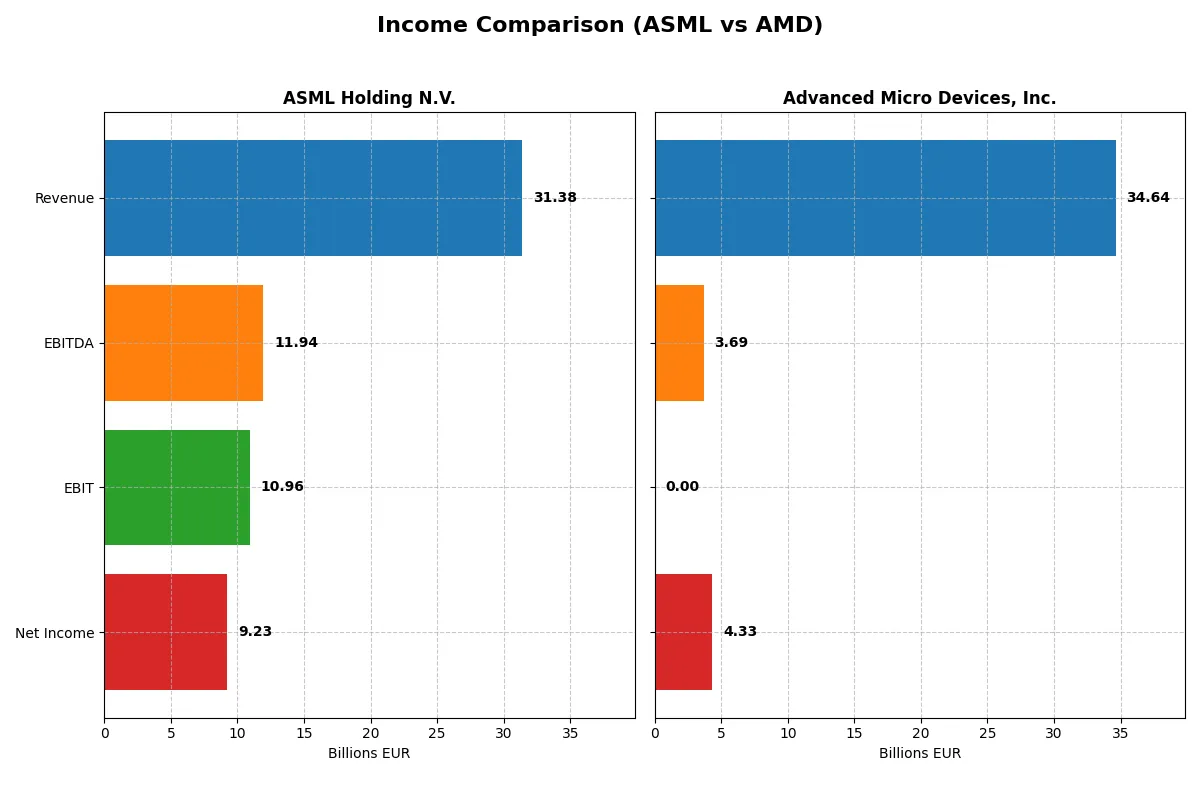
This data dissects the core profitability and scalability of both corporate engines to reveal who dominates the bottom line:
| Metric | ASML Holding N.V. (ASML) | Advanced Micro Devices, Inc. (AMD) |
|---|---|---|
| Revenue | 31.4B EUR | 34.6B USD |
| Cost of Revenue | 14.8B EUR | 17.5B USD |
| Operating Expenses | 5.7B EUR | 13.5B USD |
| Gross Profit | 16.6B EUR | 17.2B USD |
| EBITDA | 11.9B EUR | 3.7B USD |
| EBIT | 11.0B EUR | N/A |
| Interest Expense | 0 | 131M USD |
| Net Income | 9.2B EUR | 4.3B USD |
| EPS | 23.76 EUR | 2.67 USD |
| Fiscal Year | 2025 | 2025 |
Income Statement Analysis: The Bottom-Line Duel
This income statement comparison reveals the true efficiency and profitability of ASML Holding N.V. and Advanced Micro Devices, Inc. over recent years.
ASML Holding N.V. Analysis
ASML’s revenue climbed steadily from 18.6B EUR in 2021 to 31.4B EUR in 2025, with net income rising from 5.9B to 9.2B EUR. Gross margins remain robust above 50%, and net margins near 30%. The 2025 results show strong momentum, with 11% revenue growth and nearly 10% net margin expansion, reflecting operational efficiency and disciplined capital allocation.
Advanced Micro Devices, Inc. Analysis
AMD’s revenue doubled from 16.4B USD in 2021 to 34.6B USD in 2025, supported by aggressive R&D and expanding market share. Gross margin improved to 49.5%, but EBIT margin collapsed to zero in 2025. Despite a 34% revenue surge in 2025, net margin at 12.5% lags ASML’s, indicating profitability challenges amid heavy expenses and restructuring costs.
Margin Power vs. Revenue Scale
ASML dominates in profitability with higher and more stable margins, reflecting superior operational leverage and cost control. AMD’s rapid revenue growth impresses but comes with weaker EBIT performance and thinner net margins. For investors prioritizing consistent profit generation, ASML’s profile offers greater financial resilience and margin power.
Financial Ratios Comparison
These vital ratios act as a diagnostic tool to expose the underlying fiscal health, valuation premiums, and capital efficiency of the companies compared below:
| Ratios | ASML Holding N.V. (ASML) | Advanced Micro Devices, Inc. (AMD) |
|---|---|---|
| ROE | 47.08% | 0% |
| ROIC | 34.14% | 0% |
| P/E | 38.33 | 80.54 |
| P/B | 18.05 | 0 |
| Current Ratio | 1.26 | 0 |
| Quick Ratio | 0.79 | 0 |
| D/E (Debt-to-Equity) | 0.14 | 0 |
| Debt-to-Assets | 5.36% | 0 |
| Interest Coverage | 0 | -28.20 |
| Asset Turnover | 0.62 | 0 |
| Fixed Asset Turnover | 3.81 | 0 |
| Payout ratio | 26.54% | 0% |
| Dividend yield | 0.69% | 0% |
| Fiscal Year | 2025 | 2025 |
Efficiency & Valuation Duel: The Vital Signs
Financial ratios act as a company’s DNA, revealing hidden risks and operational excellence critical for investors’ decision-making.
ASML Holding N.V.
ASML delivers exceptional profitability with a 47.08% ROE and a strong 29.42% net margin, signaling operational efficiency. However, its valuation appears stretched, with a P/E of 38.33 and a P/B of 18.05. Shareholders receive a small 0.69% dividend yield, reflecting a balanced approach between returns and growth investment.
Advanced Micro Devices, Inc.
AMD posts a lower net margin of 12.51% and reports a neutral ROE, reflecting operational challenges. Its valuation is expensive, with a P/E of 80.54 and limited liquidity ratios. AMD does not pay dividends, focusing heavily on R&D, dedicating 23.36% of revenue to innovation to fuel growth.
Premium Valuation vs. Operational Safety
ASML offers a strong profitability and moderate risk profile despite a high valuation. AMD faces operational inefficiencies and a stretched valuation. ASML suits investors seeking stability and solid returns; AMD fits those prioritizing growth and innovation despite higher risk.
Which one offers the Superior Shareholder Reward?
I compare ASML Holding N.V. and Advanced Micro Devices, Inc. on dividends, buybacks, and sustainability of returns. ASML yields ~0.97% with a 34% payout ratio, supported by steady free cash flow (~€24/share) and consistent buybacks. AMD pays no dividends but reinvests heavily in growth with moderate buybacks. ASML’s balanced model offers more sustainable long-term value. I conclude ASML offers the superior total shareholder reward in 2026.
Comparative Score Analysis: The Strategic Profile
The radar chart reveals the fundamental DNA and trade-offs of ASML Holding N.V. and Advanced Micro Devices, Inc., illustrating their core financial strengths and vulnerabilities:
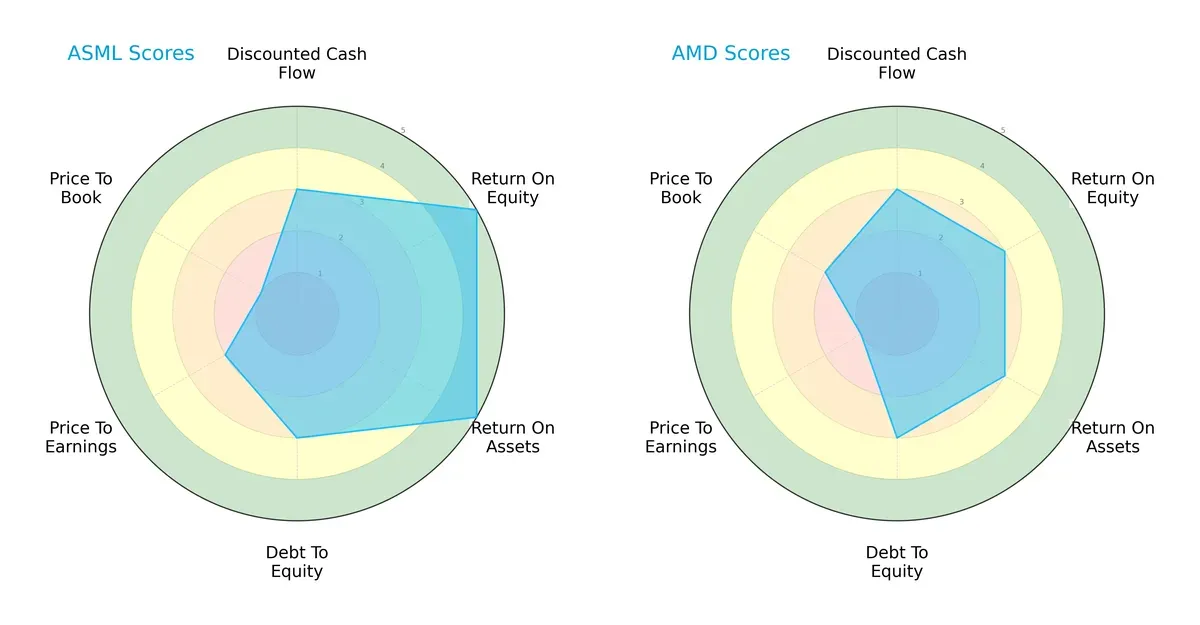
ASML outperforms AMD in profitability metrics, with very favorable ROE and ROA scores of 5 versus AMD’s moderate 3s. Both share moderate DCF and debt-to-equity profiles, but ASML’s valuation scores lag, indicating a premium price. AMD’s valuation scores are weaker, especially its P/E at very unfavorable, showing potential undervaluation. ASML has a more balanced profile, leveraging operational efficiency, while AMD relies more on valuation appeal.
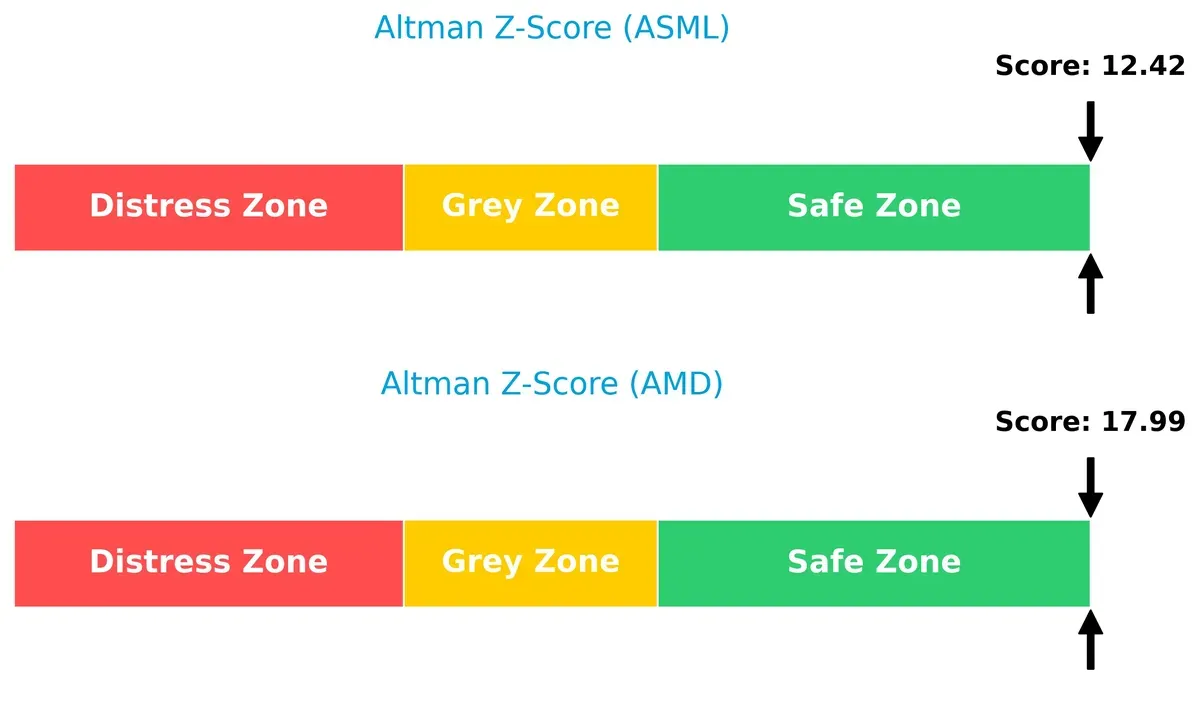
Bankruptcy Risk: Solvency Showdown
ASML’s Altman Z-Score of 12.4 versus AMD’s 18.0 places both firms firmly in the safe zone, reflecting strong solvency and low bankruptcy risk in this cycle:
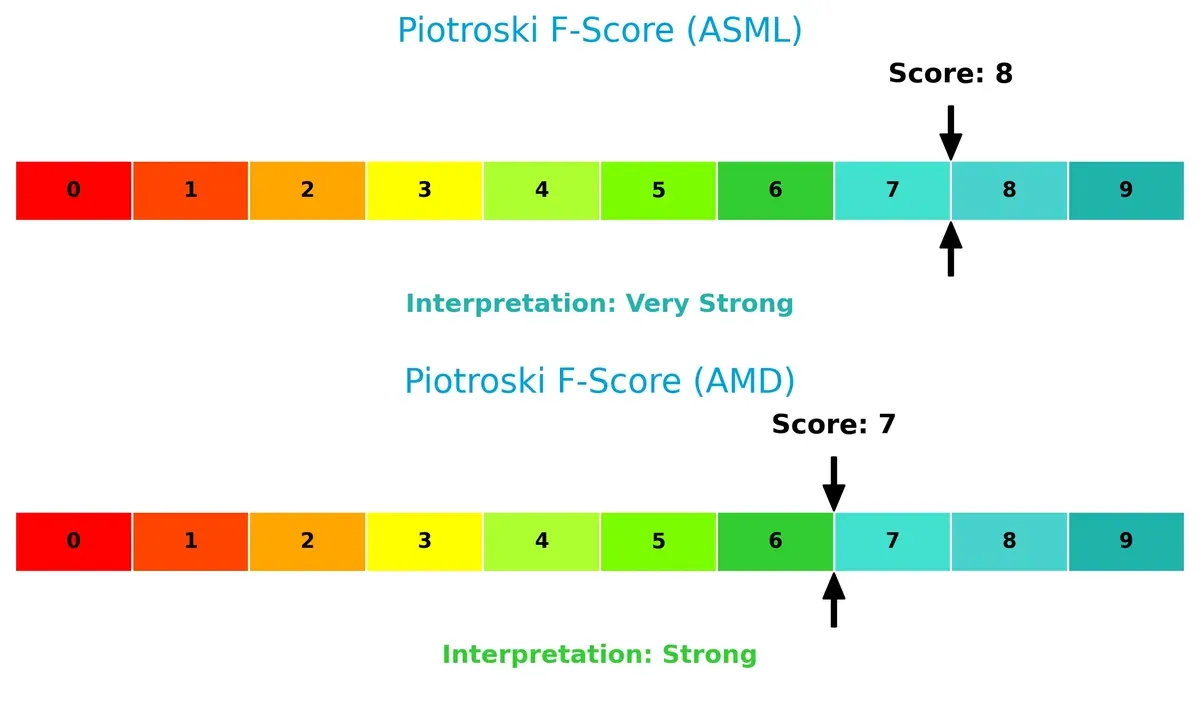
Financial Health: Quality of Operations
ASML leads with a Piotroski F-Score of 8, signaling very strong financial health, compared to AMD’s strong 7. Both show solid internal metrics, but ASML’s higher score suggests fewer red flags and more robust operational quality:
How are the two companies positioned?
This section dissects ASML and AMD’s operational DNA by comparing their revenue distribution and internal dynamics. The goal is to confront their economic moats to identify which model offers a more resilient, sustainable competitive advantage today.
Revenue Segmentation: The Strategic Mix
This visual comparison dissects how ASML Holding N.V. and Advanced Micro Devices, Inc. diversify their income streams and where their primary sector bets lie:
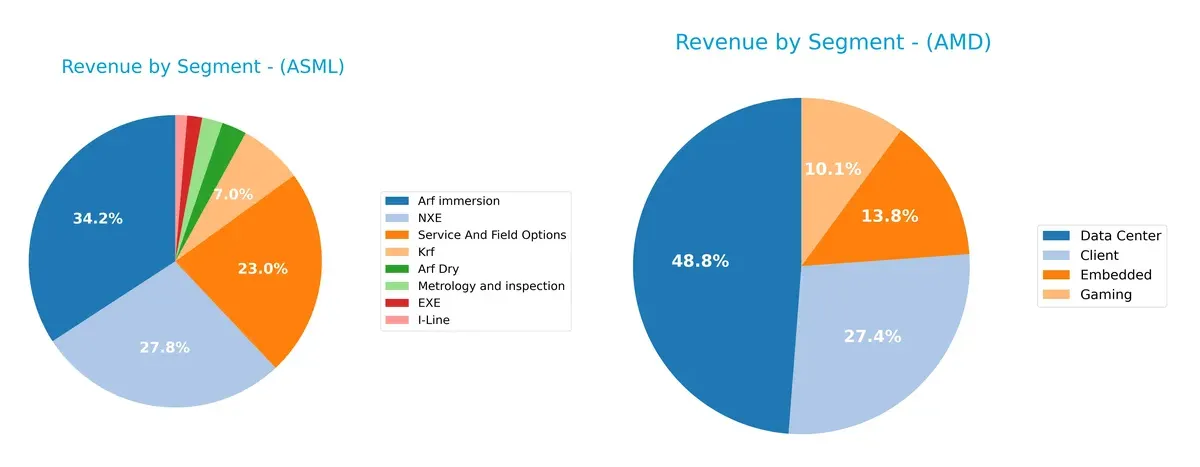
ASML’s revenue pivots around Arf immersion ($9.67B) and NXE ($7.86B), with significant contributions from Service and Field Options ($6.49B). AMD relies heavily on Data Center ($12.58B), dwarfing other segments like Client ($7.05B) and Embedded ($3.56B). ASML’s diversified product portfolio mitigates concentration risk, leveraging ecosystem lock-in. AMD’s reliance on Data Center signals infrastructure dominance but raises exposure to sector cyclicality.
Strengths and Weaknesses Comparison
This table compares the strengths and weaknesses of ASML and AMD based on diversification, profitability, financials, innovation, global presence, and market share:
ASML Strengths
- Strong profitability with 29.4% net margin and 47.1% ROE
- Favorable capital structure with low debt-to-assets at 5.36%
- Diverse product segmentation including EUV and metrology
- Significant global presence, especially in China and South Korea
- High fixed asset turnover indicating efficient use of assets
AMD Strengths
- Diversified revenue streams across client, data center, embedded, and gaming segments
- Favorable price-to-book ratio suggesting undervaluation
- Global footprint with strong US and China sales
- Solid growth in data center revenue segment
- Favorable debt ratios indicating low leverage
ASML Weaknesses
- Elevated valuation multiples with PE at 38.3 and PB at 18.1
- Quick ratio below 1.0 at 0.79 signals weaker short-term liquidity
- Dividend yield low at 0.69%, limiting income appeal
- WACC relatively high at 10.7%, increasing capital costs
AMD Weaknesses
- Zero reported ROE and ROIC raise concerns on profitability efficiency
- Unfavorable current and quick ratios suggest liquidity risks
- PE ratio very high at 80.5, indicating expensive valuation
- Negative interest coverage indicates potential difficulty servicing debt
- Asset turnover at zero reflects poor asset utilization
ASML’s strengths lie in robust profitability, strong global presence, and efficient capital use, though high valuation and liquidity are concerns. AMD shows diversified revenues and low leverage but faces profitability challenges and liquidity risks, impacting its financial stability and valuation profile.
The Moat Duel: Analyzing Competitive Defensibility
A structural moat is the only true shield guarding long-term profits from relentless competitive erosion in dynamic markets:
ASML Holding N.V.: Technological Dominance Through Intangible Assets
ASML’s moat stems from its cutting-edge lithography technology and proprietary EUV systems. It sustains high ROIC above WACC by commanding pricing power and margin stability. In 2026, expanding into new semiconductor nodes will deepen this moat.
Advanced Micro Devices, Inc.: Growth-Driven Market Penetration
AMD relies on product innovation and expanding market share rather than a durable capital moat. Its ROIC trend declined sharply, signaling pressure on capital efficiency. Yet, aggressive revenue growth and new data center GPUs offer disruptive expansion opportunities.
Moat Strength: Innovation Leadership vs. Market Momentum
ASML boasts a wider and more durable moat with very favorable ROIC above WACC and rising profitability. AMD’s declining ROIC and margin volatility suggest a weaker moat. ASML is better positioned to defend its market share amid intensifying competition.
Which stock offers better returns?
Both ASML Holding N.V. and Advanced Micro Devices, Inc. showed strong price gains over the past year, with ASML exhibiting notable acceleration and higher volatility in trading dynamics.
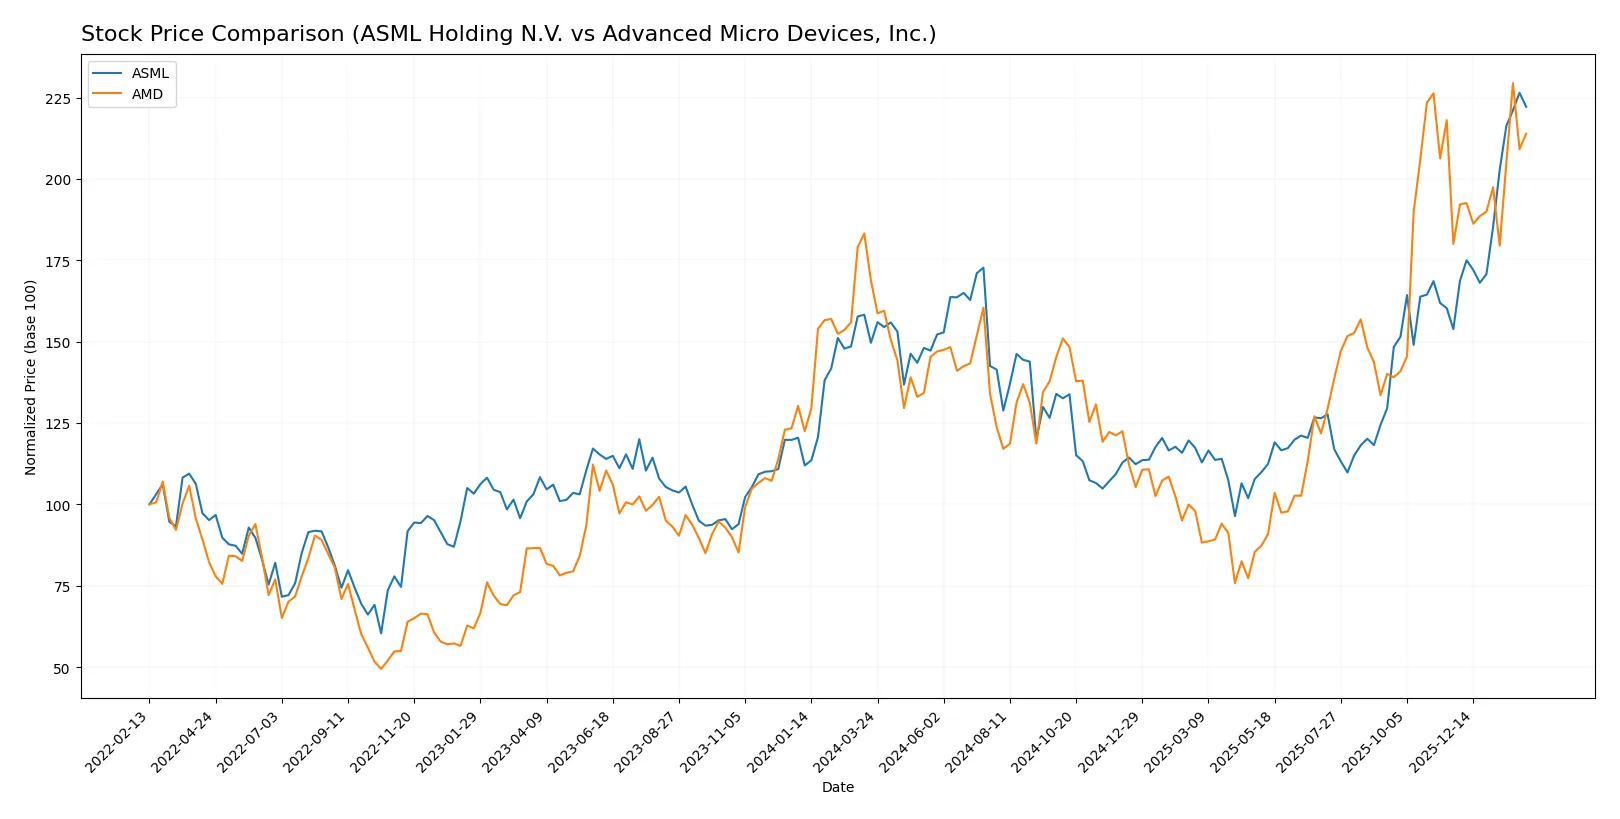
Trend Comparison
ASML Holding N.V. posted a 48.46% price increase over the past 12 months, marking a bullish trend with accelerating momentum and a substantial volatility of 177.74. The stock reached a high of 1423.0 and a low of 605.55.
Advanced Micro Devices, Inc. gained 26.72% over the same period, also bullish with acceleration, but at lower volatility (41.61). The price ranged between 85.76 and 259.68, showing steady upward movement.
Comparing the two, ASML delivered the highest market performance with nearly double the price appreciation and stronger acceleration, indicating superior return potential over the past year.
Target Prices
Analysts present a cautiously optimistic target consensus for both ASML Holding N.V. and Advanced Micro Devices, Inc.
| Company | Target Low | Target High | Consensus |
|---|---|---|---|
| ASML Holding N.V. | 1,150 | 1,911 | 1,458.5 |
| Advanced Micro Devices, Inc. | 225 | 380 | 291.56 |
ASML’s consensus target exceeds its current price of 1,395.88, indicating upside potential. AMD’s target consensus of 291.56 also suggests room for price appreciation from its current 242.11.

Don’t Let Luck Decide Your Entry Point
Optimize your entry points with our advanced ProRealTime indicators. You’ll get efficient buy signals with precise price targets for maximum performance. Start outperforming now!
How do institutions grade them?
I reviewed the latest institutional grades for both ASML Holding N.V. and Advanced Micro Devices, Inc.:
ASML Holding N.V. Grades
Here are the recent grades assigned by major financial institutions to ASML:
| Grading Company | Action | New Grade | Date |
|---|---|---|---|
| Barclays | Upgrade | Overweight | 2026-01-29 |
| Wells Fargo | Maintain | Overweight | 2026-01-29 |
| RBC Capital | Maintain | Outperform | 2026-01-29 |
| Bernstein | Maintain | Outperform | 2026-01-22 |
| KGI Securities | Upgrade | Outperform | 2026-01-15 |
| Wells Fargo | Maintain | Overweight | 2026-01-15 |
| JP Morgan | Maintain | Overweight | 2026-01-14 |
| Bernstein | Upgrade | Outperform | 2026-01-05 |
| B of A Securities | Maintain | Buy | 2025-12-03 |
| JP Morgan | Maintain | Overweight | 2025-12-01 |
Advanced Micro Devices, Inc. Grades
Below are the latest institutional grades for AMD from respected firms:
| Grading Company | Action | New Grade | Date |
|---|---|---|---|
| Wells Fargo | Maintain | Overweight | 2026-01-30 |
| Piper Sandler | Maintain | Overweight | 2026-01-26 |
| UBS | Maintain | Buy | 2026-01-26 |
| Bernstein | Maintain | Market Perform | 2026-01-21 |
| Keybanc | Upgrade | Overweight | 2026-01-13 |
| Truist Securities | Maintain | Buy | 2025-12-19 |
| Cantor Fitzgerald | Maintain | Overweight | 2025-12-16 |
| Morgan Stanley | Maintain | Equal Weight | 2025-11-12 |
| Wedbush | Maintain | Outperform | 2025-11-12 |
| Rosenblatt | Maintain | Buy | 2025-11-12 |
Which company has the best grades?
ASML holds a consistently higher grade profile, with multiple Outperform and Overweight ratings. AMD’s ratings are solid but include Market Perform and Equal Weight, indicating more mixed sentiment. Investors may view ASML’s stronger grades as a sign of greater institutional confidence.
Risks specific to each company
The following categories identify critical pressure points and systemic threats facing ASML Holding N.V. and Advanced Micro Devices, Inc. in the 2026 market environment:
1. Market & Competition
ASML Holding N.V.
- Dominates advanced lithography equipment with high barriers to entry but faces intensifying competition in semiconductor tools.
Advanced Micro Devices, Inc.
- Strong in CPUs and GPUs, yet competes aggressively with Intel and Nvidia in a volatile, innovation-driven market.
2. Capital Structure & Debt
ASML Holding N.V.
- Maintains low debt-to-equity at 0.14, signaling prudent leverage and strong financial stability.
Advanced Micro Devices, Inc.
- Shows zero reported debt but unfavorable interest coverage, indicating potential liquidity or earnings challenges.
3. Stock Volatility
ASML Holding N.V.
- Beta at 1.46 suggests moderate volatility, consistent with industry norms for semiconductor equipment makers.
Advanced Micro Devices, Inc.
- Higher beta of 1.95 reflects greater stock price volatility, increasing investment risk.
4. Regulatory & Legal
ASML Holding N.V.
- Faces export controls and IP protection risks amid geopolitical tensions affecting technology transfers.
Advanced Micro Devices, Inc.
- Subject to US regulatory scrutiny and antitrust risks due to market consolidation and patent disputes.
5. Supply Chain & Operations
ASML Holding N.V.
- Relies on complex, global supply chains vulnerable to component shortages and geopolitical disruptions.
Advanced Micro Devices, Inc.
- Operates extensive manufacturing partnerships; susceptible to supply chain bottlenecks and fab capacity constraints.
6. ESG & Climate Transition
ASML Holding N.V.
- Increasing pressure to reduce carbon footprint in energy-intensive manufacturing processes.
Advanced Micro Devices, Inc.
- Faces challenges in sustainable materials sourcing and energy efficiency improvements in high-performance chips.
7. Geopolitical Exposure
ASML Holding N.V.
- Significant exposure to Asia-Pacific markets, vulnerable to trade restrictions and regional conflicts.
Advanced Micro Devices, Inc.
- US-based but globally diversified; geopolitical tensions impact supply chains and market access.
Which company shows a better risk-adjusted profile?
ASML’s most impactful risk is geopolitical exposure, notably export controls restricting technology sales in Asia. AMD’s primary risk is its elevated stock volatility coupled with weak liquidity metrics. ASML’s strong balance sheet, favorable profitability ratios, and lower volatility provide a superior risk-adjusted profile. The recent surge in AMD’s beta to 1.95 highlights market nervousness, underscoring its higher investment risk compared to ASML’s steadier profile.
Final Verdict: Which stock to choose?
ASML’s superpower lies in its durable competitive advantage, driven by a consistently growing ROIC well above its cost of capital. It excels in capital efficiency and profitability, making it a powerhouse in the semiconductor equipment space. A point of vigilance is its relatively high valuation multiples, which may pressure returns if growth slows. ASML suits portfolios targeting aggressive growth with a tolerance for premium pricing.
AMD’s strength is its strategic moat anchored in rapid innovation and expanding market share in CPUs and GPUs. Its substantial R&D investment fosters a pipeline of competitive products, underpinning revenue growth. Compared to ASML, AMD offers a more volatile safety profile due to weaker capital returns and less consistent profitability. It fits well in growth-at-a-reasonable-price (GARP) portfolios willing to accept higher operational risks for potential upside.
If you prioritize strong capital efficiency and a proven economic moat, ASML outshines AMD with superior value creation and financial stability despite its premium. However, if you seek higher revenue growth fueled by innovation and can handle more volatility, AMD offers a compelling growth trajectory with room for multiple expansion. Each presents a distinct risk-reward profile aligned with different investor appetites.
Disclaimer: Investment carries a risk of loss of initial capital. The past performance is not a reliable indicator of future results. Be sure to understand risks before making an investment decision.
Go Further
I encourage you to read the complete analyses of ASML Holding N.V. and Advanced Micro Devices, Inc. to enhance your investment decisions: