In the fast-evolving software application industry, Workday, Inc. and Asana, Inc. stand out as innovative leaders. Workday focuses on enterprise cloud solutions for finance and human capital management, while Asana specializes in work management platforms for teams and organizations. Both companies target overlapping markets with distinct approaches to digital transformation. In this article, I will analyze their strengths and risks to help you decide which stock deserves a place in your portfolio.
Table of contents
Companies Overview
I will begin the comparison between Workday, Inc. and Asana, Inc. by providing an overview of these two companies and their main differences.
Workday Overview
Workday, Inc. is a leading provider of enterprise cloud applications, focusing on financial management, human capital management, and analytics. Founded in 2005 and headquartered in Pleasanton, California, it serves a wide range of industries including healthcare, education, and financial services. Workday’s mission centers on helping organizations plan, execute, and analyze business operations through integrated cloud solutions.
Asana Overview
Asana, Inc. operates a work management platform designed to help teams manage daily tasks and strategic initiatives. Established in 2008 and based in San Francisco, California, Asana serves diverse sectors such as technology, retail, and government. Its platform focuses on improving collaboration and orchestration of work across various organizational levels, from individuals to executives.
Key similarities and differences
Both Workday and Asana operate in the software applications industry, offering cloud-based solutions to improve business productivity. Workday emphasizes comprehensive enterprise applications for finance and human capital management, targeting complex organizational needs. In contrast, Asana specializes in task and project management tools aimed at enhancing team collaboration and workflow execution, serving a somewhat narrower market scope.
Income Statement Comparison
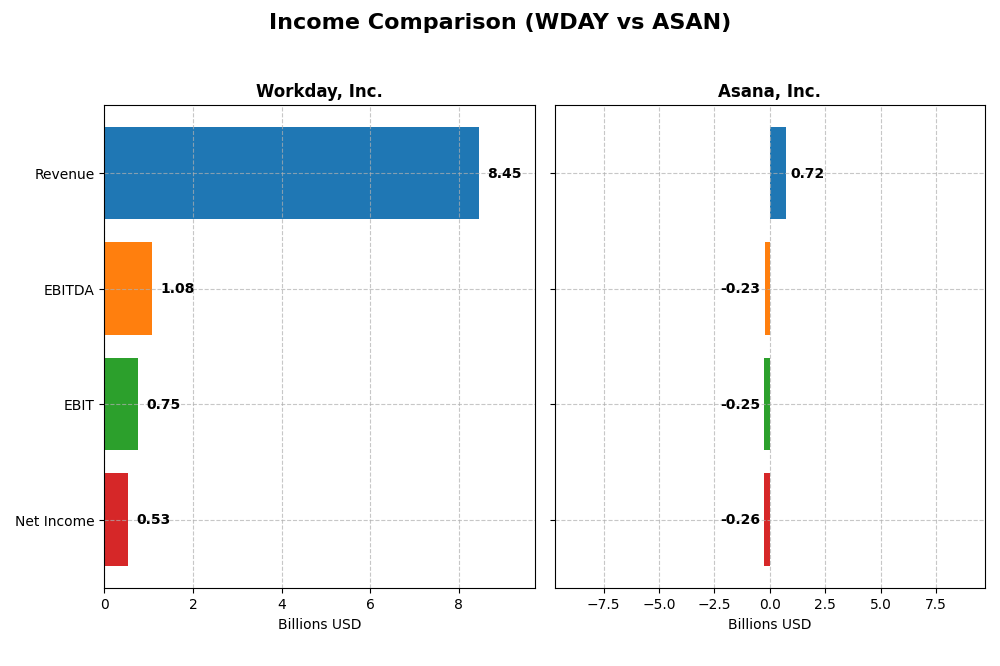
The table below compares the key income statement metrics for Workday, Inc. and Asana, Inc. in their most recent fiscal year, 2025.
| Metric | Workday, Inc. (WDAY) | Asana, Inc. (ASAN) |
|---|---|---|
| Market Cap | 49.9B | 2.6B |
| Revenue | 8.45B | 724M |
| EBITDA | 1.08B | -230M |
| EBIT | 752M | -247M |
| Net Income | 526M | -256M |
| EPS | 1.98 | -1.11 |
| Fiscal Year | 2025 | 2025 |
Income Statement Interpretations
Workday, Inc.
Workday demonstrated strong revenue growth from $4.32B in 2021 to $8.45B in 2025, nearly doubling over five years. Net income swung from a loss of $282M in 2021 to a positive $526M in 2025, reflecting a solid recovery and expansion. Margins were favorable overall, with a 75.5% gross margin and a net margin of 6.23% in 2025. Despite a 62.6% EPS decline in 2025, operating income grew 60%, indicating improving operational efficiency.
Asana, Inc.
Asana’s revenue rose from $227M in 2021 to $724M in 2025, tripling over the period. However, it remained unprofitable with a net loss of $256M in 2025, albeit with improving net margin trends. The company maintained a high gross margin of 89.34% but suffered from a negative EBIT margin of -34.13%. The latest year showed modest revenue and profit margin improvements, with net margin and EPS growth turning favorable.
Which one has the stronger fundamentals?
Workday shows stronger fundamentals with sustained revenue and net income growth, positive net margins, and improving operating income despite EPS volatility. Asana exhibits rapid revenue growth and high gross margins but continues to face losses and negative operating margins. Workday’s more consistent profitability and margin stability present a more favorable income statement profile compared to Asana’s ongoing net losses.
Financial Ratios Comparison
The table below presents a side-by-side comparison of key financial ratios for Workday, Inc. and Asana, Inc. based on their most recent fiscal year data for 2025.
| Ratios | Workday, Inc. (WDAY) | Asana, Inc. (ASAN) |
|---|---|---|
| ROE | 5.8% | -112.3% |
| ROIC | 2.7% | -53.0% |
| P/E | 132.2 | -19.2 |
| P/B | 7.7 | 21.5 |
| Current Ratio | 1.85 | 1.44 |
| Quick Ratio | 1.85 | 1.44 |
| D/E (Debt-to-Equity) | 0.37 | 1.18 |
| Debt-to-Assets | 18.7% | 30.1% |
| Interest Coverage | 3.64 | -72.42 |
| Asset Turnover | 0.47 | 0.81 |
| Fixed Asset Turnover | 5.36 | 2.76 |
| Payout ratio | 0 | 0 |
| Dividend yield | 0 | 0 |
Interpretation of the Ratios
Workday, Inc.
Workday exhibits a mixed profile with favorable liquidity ratios (current and quick ratios at 1.85) and manageable debt levels (debt-to-equity 0.37, debt to assets 18.7%), yet shows weaknesses in profitability metrics such as return on equity (5.82%) and return on invested capital (2.73%). The high price-to-earnings ratio (132.15) signals a premium valuation. Workday does not pay dividends, suggesting it prioritizes reinvestment and growth over shareholder distributions.
Asana, Inc.
Asana’s ratios reveal challenges, including negative net margin (-35.3%), return on equity (-112.31%), and return on invested capital (-53.03%), reflecting ongoing losses and operational inefficiencies. Its debt-to-equity is high at 1.18, and interest coverage is negative, indicating financial strain. Asana also pays no dividends, consistent with its negative earnings and focus on development and expansion in a high-growth phase.
Which one has the best ratios?
Workday presents a more balanced financial position with favorable liquidity and debt management, despite some profitability concerns and high valuation multiples. Asana’s ratios are generally weaker, with significant losses and financial risks. Overall, Workday’s ratios are comparatively stronger, while Asana’s profile remains slightly unfavorable due to operational and financial challenges.
Strategic Positioning
This section compares the strategic positioning of Workday and Asana, focusing on market position, key segments, and exposure to technological disruption:
Workday, Inc.
- Large market cap of 49.9B with diversified industry presence across multiple sectors.
- Revenue driven by subscription services and professional services targeting enterprise cloud applications.
- Provides advanced analytics, machine learning, and cloud solutions, indicating moderate exposure to tech disruption.
Asana, Inc.
- Smaller market cap of 2.6B, operating mainly in work management software.
- Focused on a work management platform for teams managing tasks to strategic initiatives.
- Platform-oriented, likely adapting to evolving digital collaboration trends, but specific disruptions not detailed.
Workday, Inc. vs Asana, Inc. Positioning
Workday demonstrates a diversified approach with broad enterprise cloud applications and multiple revenue streams, offering scale advantages. Asana is more concentrated on work management software, implying narrower business drivers but potentially more focused innovation.
Which has the best competitive advantage?
Workday shows a slightly unfavorable moat with growing ROIC, indicating improving profitability despite current value shedding. Asana has a very unfavorable moat with declining ROIC, signaling worsening profitability and weaker competitive advantage.
Stock Comparison
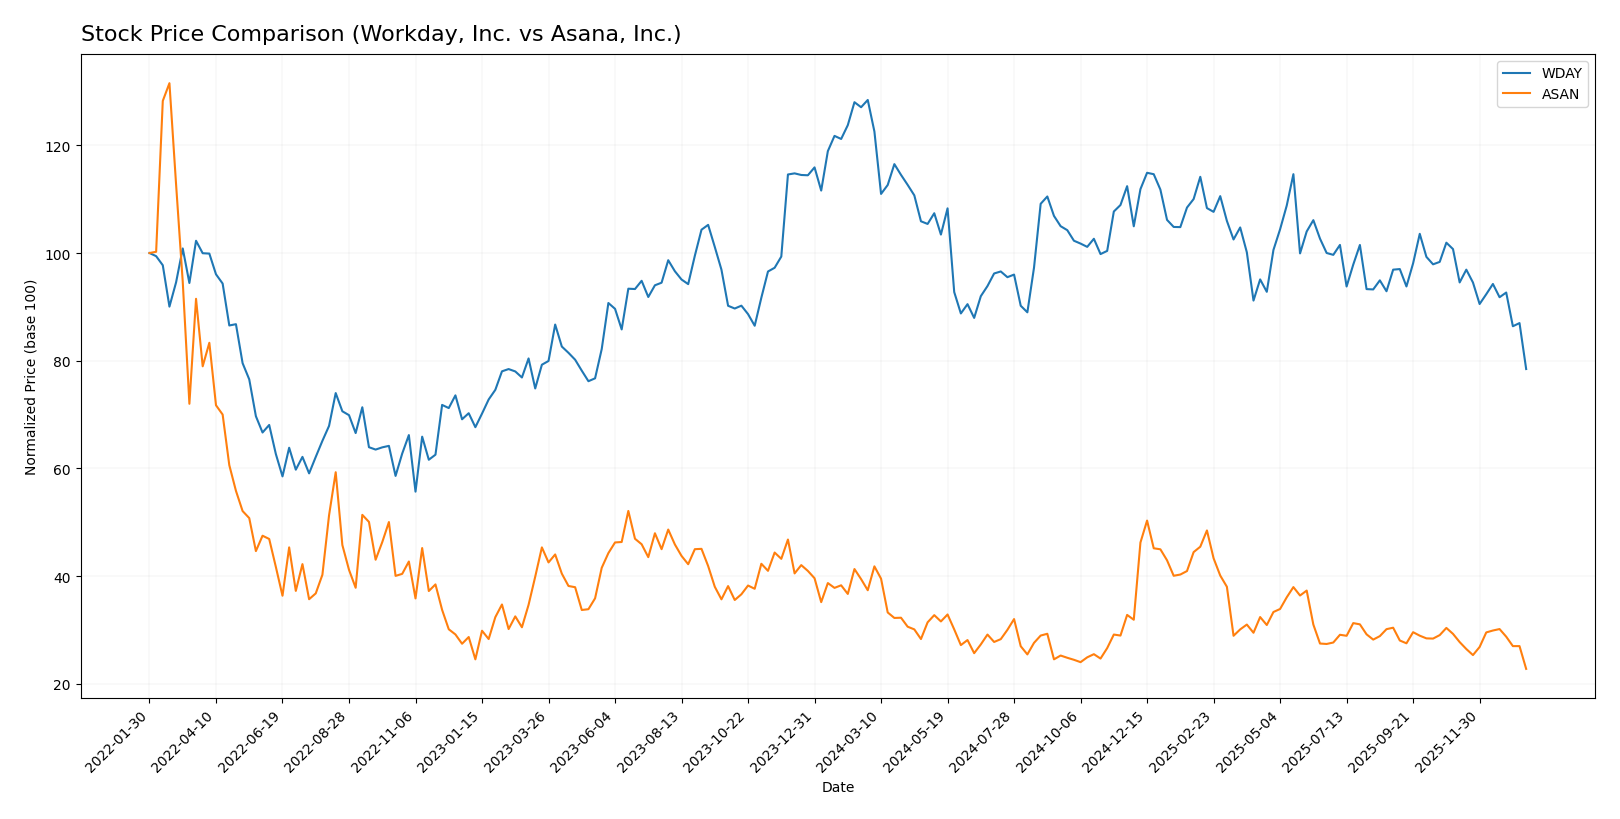
The stock price movements of Workday, Inc. (WDAY) and Asana, Inc. (ASAN) over the past year reveal pronounced bearish trends with significant price declines and decelerating momentum, alongside shifts in trading volumes and buyer-seller dynamics.
Trend Analysis
Workday, Inc. experienced a bearish trend with a -38.91% price change over the last 12 months, showing deceleration in decline and high volatility with a standard deviation of 20.22. The stock reached a high of 305.88 and a low of 186.86.
Asana, Inc. also showed a bearish trend with a -39.07% price drop during the same period, with deceleration and lower volatility (std deviation 2.87). The stock’s highest price was 24.15 and the lowest 10.93.
Comparing both, Workday and Asana delivered similarly poor market performances, with ASAN’s decline slightly exceeding WDAY’s, reflecting nearly equivalent bearish trends in the last year.
Target Prices
The current analyst consensus indicates moderate upside potential for both Workday, Inc. and Asana, Inc.
| Company | Target High | Target Low | Consensus |
|---|---|---|---|
| Workday, Inc. | 320 | 235 | 274.47 |
| Asana, Inc. | 18 | 14 | 15.75 |
Analysts expect Workday’s stock to rise significantly above its current price of $186.86, while Asana’s target consensus at $15.75 suggests a noticeable increase from its $10.93 market price.
Analyst Opinions Comparison
This section compares analysts’ ratings and grades for Workday, Inc. and Asana, Inc.:
Rating Comparison
Workday, Inc. Rating
- Rating: B-, considered very favorable by analysts.
- Discounted Cash Flow Score: 4, indicating favorable value.
- ROE Score: 3, a moderate measure of equity profitability.
- ROA Score: 3, moderate asset utilization efficiency.
- Debt To Equity Score: 2, moderate financial risk.
- Overall Score: 2, moderate overall financial standing.
Asana, Inc. Rating
- Rating: D+, also noted as very favorable in analyst status.
- Discounted Cash Flow Score: 1, very unfavorable valuation.
- ROE Score: 1, very unfavorable return on equity.
- ROA Score: 1, very unfavorable asset utilization.
- Debt To Equity Score: 1, very unfavorable debt profile.
- Overall Score: 1, very unfavorable financial standing.
Which one is the best rated?
Workday, Inc. is better rated overall, showing moderate to favorable scores across key financial metrics. Asana, Inc. exhibits very unfavorable scores in all categories, reflecting weaker financial metrics based on the data provided.
Scores Comparison
Here is a comparison of the Altman Z-Score and Piotroski Score for Workday, Inc. and Asana, Inc.:
WDAY Scores
- Altman Z-Score: 4.41, indicating safe zone status, low bankruptcy risk.
- Piotroski Score: 6, reflecting average financial strength.
ASAN Scores
- Altman Z-Score: -0.27, indicating distress zone, high bankruptcy risk.
- Piotroski Score: 4, reflecting average financial strength.
Which company has the best scores?
Based on the data, Workday has a significantly higher Altman Z-Score in the safe zone, while Asana is in distress. Both have average Piotroski Scores, but Workday’s overall scores indicate stronger financial stability.
Grades Comparison
Here is a detailed comparison of the latest grades assigned to Workday, Inc. and Asana, Inc.:
Workday, Inc. Grades
The following table summarizes recent reliable grades from established financial institutions for Workday, Inc.:
| Grading Company | Action | New Grade | Date |
|---|---|---|---|
| Barclays | Maintain | Overweight | 2026-01-12 |
| RBC Capital | Maintain | Outperform | 2026-01-05 |
| TD Cowen | Maintain | Buy | 2025-11-26 |
| DA Davidson | Maintain | Neutral | 2025-11-26 |
| Wells Fargo | Maintain | Overweight | 2025-11-26 |
| Barclays | Maintain | Overweight | 2025-11-26 |
| Keybanc | Maintain | Overweight | 2025-11-26 |
| Citigroup | Maintain | Neutral | 2025-11-26 |
| JP Morgan | Maintain | Overweight | 2025-11-26 |
| UBS | Maintain | Neutral | 2025-11-26 |
Workday’s grades predominantly reflect a positive outlook, with multiple “Overweight” and “Buy/Outperform” ratings and some “Neutral” assessments.
Asana, Inc. Grades
The table below shows recent reliable grades for Asana, Inc. from recognized grading firms:
| Grading Company | Action | New Grade | Date |
|---|---|---|---|
| Citigroup | Upgrade | Buy | 2026-01-15 |
| RBC Capital | Maintain | Underperform | 2026-01-05 |
| Keybanc | Upgrade | Overweight | 2025-12-15 |
| DA Davidson | Maintain | Neutral | 2025-12-04 |
| Citigroup | Maintain | Neutral | 2025-12-03 |
| RBC Capital | Maintain | Underperform | 2025-12-03 |
| UBS | Maintain | Neutral | 2025-12-03 |
| Baird | Maintain | Neutral | 2025-09-04 |
| Morgan Stanley | Maintain | Underweight | 2025-09-04 |
| Piper Sandler | Maintain | Overweight | 2025-09-04 |
Asana’s grades show a mixed pattern, including upgrades to “Buy” and “Overweight,” but also multiple “Underperform” and “Neutral” ratings.
Which company has the best grades?
Workday, Inc. has received consistently stronger and more positive grades, with a majority suggesting Outperform or Overweight positions, indicating higher analyst confidence. Asana, Inc. displays a more divided outlook with both upgrades and multiple underperform ratings. This divergence may impact investor perception of risk and potential return differently for each stock.
Strengths and Weaknesses
Below is a comparison table summarizing the key strengths and weaknesses of Workday, Inc. (WDAY) and Asana, Inc. (ASAN) based on the latest financial data and market positioning.
| Criterion | Workday, Inc. (WDAY) | Asana, Inc. (ASAN) |
|---|---|---|
| Diversification | Strong revenue diversification with $7.72B in subscription and $728M in professional services (2025) | Limited diversification; primarily focused on project management software |
| Profitability | Slightly favorable net margin (6.23%) but overall value destroying (ROIC < WACC) | Unfavorable profitability with -35.3% net margin and declining ROIC |
| Innovation | Growing ROIC trend indicates improving operational efficiency and innovation | Declining ROIC trend signals weakening innovation and competitiveness |
| Global presence | Established global footprint in enterprise cloud solutions | Smaller global presence, focused on niche market segments |
| Market Share | Strong presence in enterprise SaaS with solid subscription growth | Smaller market share with challenges in scaling profitability |
Key takeaways: Workday shows improving profitability and strong subscription revenue growth, despite some value destruction. Asana faces significant profitability challenges with declining returns and weaker financial health. Investors should weigh Workday’s growth and diversification against Asana’s current financial difficulties.
Risk Analysis
The table below compares the key risk metrics for Workday, Inc. (WDAY) and Asana, Inc. (ASAN) based on the most recent 2025 data.
| Metric | Workday, Inc. (WDAY) | Asana, Inc. (ASAN) |
|---|---|---|
| Market Risk (Beta) | 1.14 (moderate) | 0.92 (lower) |
| Debt Level (Debt/Equity) | 0.37 (favorable) | 1.18 (unfavorable) |
| Regulatory Risk | Moderate | Moderate |
| Operational Risk | Moderate | Higher (due to smaller size and growth phase) |
| Environmental Risk | Low | Low |
| Geopolitical Risk | Moderate | Moderate |
The most impactful risk for Asana is its high debt level and negative profitability, with an Altman Z-score in the distress zone (-0.27), indicating significant financial distress risk. Workday shows moderate market risk and favorable debt levels, with a safe zone Altman Z-score (4.41) suggesting stronger financial stability. Investors should be cautious with Asana’s financial health, while Workday presents a more balanced risk profile.
Which Stock to Choose?
Workday, Inc. (WDAY) shows a favorable income evolution with 16.35% revenue growth in 2025 and strong overall income statement performance. Despite a neutral global financial ratios evaluation, it maintains favorable liquidity and debt metrics. Its profitability is moderate with a 6.23% net margin. The company has a slightly unfavorable MOAT due to value destruction but improving ROIC, and a very favorable B- rating.
Asana, Inc. (ASAN) demonstrates favorable revenue growth of 10.94% in 2025 and a high gross margin, but profitability remains negative with a -35.3% net margin. Financial ratios are mostly unfavorable, reflecting high leverage and negative returns. The MOAT is very unfavorable with declining ROIC, and it holds a very unfavorable D+ rating. Its Altman Z-Score places it in the distress zone.
Investors focused on stability and moderate profitability may find Workday’s profile more favorable due to its improving income and stronger ratings. Conversely, those with higher risk tolerance and interest in high-growth potential despite current losses might see Asana’s performance differently, though its financial and moat indicators suggest caution.
Disclaimer: Investment carries a risk of loss of initial capital. The past performance is not a reliable indicator of future results. Be sure to understand risks before making an investment decision.
Go Further
I encourage you to read the complete analyses of Workday, Inc. and Asana, Inc. to enhance your investment decisions: