Unity Software Inc. and Asana, Inc. are two prominent players in the software application industry, each driving innovation in distinct yet overlapping markets. Unity focuses on real-time 2D and 3D content creation for multiple platforms, while Asana offers a comprehensive work management platform for teams across industries. Comparing these companies reveals insights into their growth strategies and market potential. In this article, I will help you determine which company presents the most compelling investment opportunity.
Table of contents
Companies Overview
I will begin the comparison between Unity Software Inc. and Asana, Inc. by providing an overview of these two companies and their main differences.
Unity Software Inc. Overview
Unity Software Inc. operates an interactive real-time 3D content platform designed to create, run, and monetize 2D and 3D content across multiple devices including mobile phones, PCs, consoles, and AR/VR devices. Founded in 2004 and headquartered in San Francisco, Unity targets content creators and developers globally, offering software solutions through online stores and distributors. The company is positioned as a leader in the real-time 3D application software industry.
Asana, Inc. Overview
Asana, Inc. provides a work management platform facilitating task orchestration for individuals, teams, and executives across various industries such as technology, retail, and healthcare. Established in 2008 and based in San Francisco, Asana supports project management from daily tasks to strategic initiatives. Its platform serves a broad customer base internationally, emphasizing productivity and collaboration within organizations.
Key similarities and differences
Both Unity and Asana operate in the software application industry and are headquartered in San Francisco, serving global markets through digital platforms. Unity focuses on interactive 3D content creation for multimedia and gaming, while Asana centers on work management and productivity software. Unity’s market cap is significantly larger at $17.5B compared to Asana’s $2.6B, reflecting their differing scales and business models within technology software sectors.
Income Statement Comparison
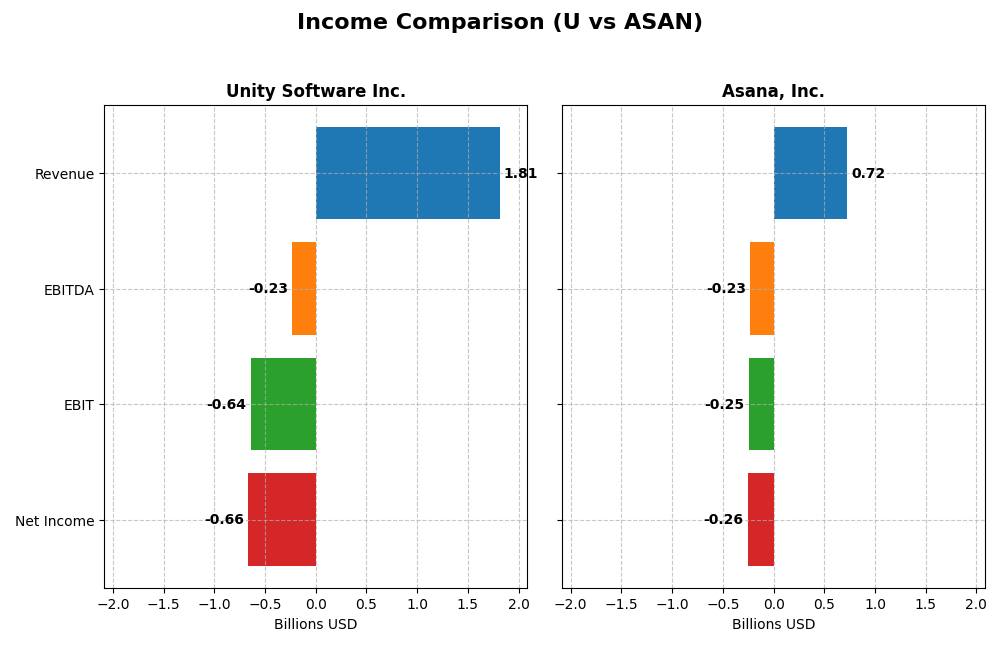
Below is a side-by-side comparison of key income statement metrics for Unity Software Inc. and Asana, Inc. for their most recent fiscal years.
| Metric | Unity Software Inc. (2024) | Asana, Inc. (2025) |
|---|---|---|
| Market Cap | 17.5B | 2.6B |
| Revenue | 1.81B | 724M |
| EBITDA | -235M | -230M |
| EBIT | -644M | -247M |
| Net Income | -664M | -256M |
| EPS | -1.68 | -1.11 |
| Fiscal Year | 2024 | 2025 |
Income Statement Interpretations
Unity Software Inc.
Unity Software’s revenue rose significantly from 2020 to 2023, peaking at $2.19B before declining 17.1% to $1.81B in 2024. Net income remained negative throughout, though losses lessened from -$919M in 2022 to -$664M in 2024. Gross margin held favorably high at 73.48%, but net and EBIT margins stayed negative. The latest year saw slower revenue and gross profit growth but improved EBIT and EPS.
Asana, Inc.
Asana demonstrated steady revenue growth over 2021-2025, reaching $724M in 2025, a 10.94% increase from 2024. Despite consistent net losses, net margin improved notably to -35.3%, supported by a favorable gross margin of 89.34%. Operating expenses grew proportionally with revenue, and EBIT margin remained negative but stable. The latest year marked positive growth in revenue, gross profit, net margin, and EPS.
Which one has the stronger fundamentals?
Asana presents stronger income statement fundamentals with 71.43% favorable indicators, including robust revenue and margin improvements, and manageable interest expenses. Unity shows mixed results, with only 35.71% favorable metrics and ongoing net losses despite revenue growth. Asana’s positive margin trends and consistent growth outweigh Unity’s declining revenue and persistent negative profitability.
Financial Ratios Comparison
The table below presents key financial ratios for Unity Software Inc. and Asana, Inc. based on their most recent fiscal year data for 2024 and 2025 respectively.
| Ratios | Unity Software Inc. (2024) | Asana, Inc. (2025) |
|---|---|---|
| ROE | -20.8% | -112.3% |
| ROIC | -12.8% | -53.0% |
| P/E | -13.4 | -19.2 |
| P/B | 2.79 | 21.52 |
| Current Ratio | 2.50 | 1.44 |
| Quick Ratio | 2.50 | 1.44 |
| D/E | 0.74 | 1.18 |
| Debt-to-Assets | 34.9% | 30.1% |
| Interest Coverage | -32.1 | -72.4 |
| Asset Turnover | 0.27 | 0.81 |
| Fixed Asset Turnover | 18.35 | 2.76 |
| Payout ratio | 0 | 0 |
| Dividend yield | 0 | 0 |
Interpretation of the Ratios
Unity Software Inc.
Unity Software shows mixed financial ratios with several unfavorable indicators such as negative net margin (-36.63%), ROE (-20.81%), and ROIC (-12.78%), signaling weak profitability and returns. However, liquidity ratios like current and quick ratios stand strong at 2.5, indicating good short-term financial health. The company does not pay dividends, likely due to ongoing negative earnings and reinvestment priorities.
Asana, Inc.
Asana’s ratios also reflect challenges, with unfavorable net margin (-35.3%), ROE (-112.31%), and ROIC (-53.03%) pointing to significant profitability and efficiency issues. Its liquidity, represented by a current ratio of 1.44 and a quick ratio of 1.44, is less robust but still acceptable. Asana does not pay dividends, which aligns with its high debt-to-equity ratio (1.18) and a probable focus on growth and reinvestment.
Which one has the best ratios?
Both companies display a slightly unfavorable overall ratios profile, each with 50% unfavorable ratios. Unity boasts stronger liquidity and a lower debt-to-equity ratio than Asana, but Asana has a lower weighted average cost of capital. Neither company pays dividends, reflecting ongoing reinvestment and growth strategies amid persistent profitability challenges.
Strategic Positioning
This section compares the strategic positioning of Unity Software Inc. and Asana, Inc., focusing on market position, key segments, and exposure to technological disruption:
Unity Software Inc.
- Established market presence in interactive real-time 3D content, facing competitive pressures in software applications.
- Key segments include Create Solutions and Operate Solutions targeting content creators and developers globally.
- Exposure to disruption from advances in augmented and virtual reality technologies in 3D content creation.
Asana, Inc.
- Operates in the work management software space with competition in productivity platforms.
- Focuses on work orchestration for teams across industries like technology, retail, and healthcare.
- Faces disruption risks related to evolving collaboration and project management technologies.
Unity Software Inc. vs Asana, Inc. Positioning
Unity has a diversified product base with Create and Operate Solutions serving a broad developer audience, while Asana concentrates on work management software across multiple industries. Unity’s broader segment focus contrasts with Asana’s more specialized platform approach, each with distinct market dynamics.
Which has the best competitive advantage?
Both companies show very unfavorable MOAT evaluations with declining ROIC below WACC, indicating value destruction and decreasing profitability, suggesting neither currently holds a sustainable competitive advantage based on capital efficiency metrics.
Stock Comparison
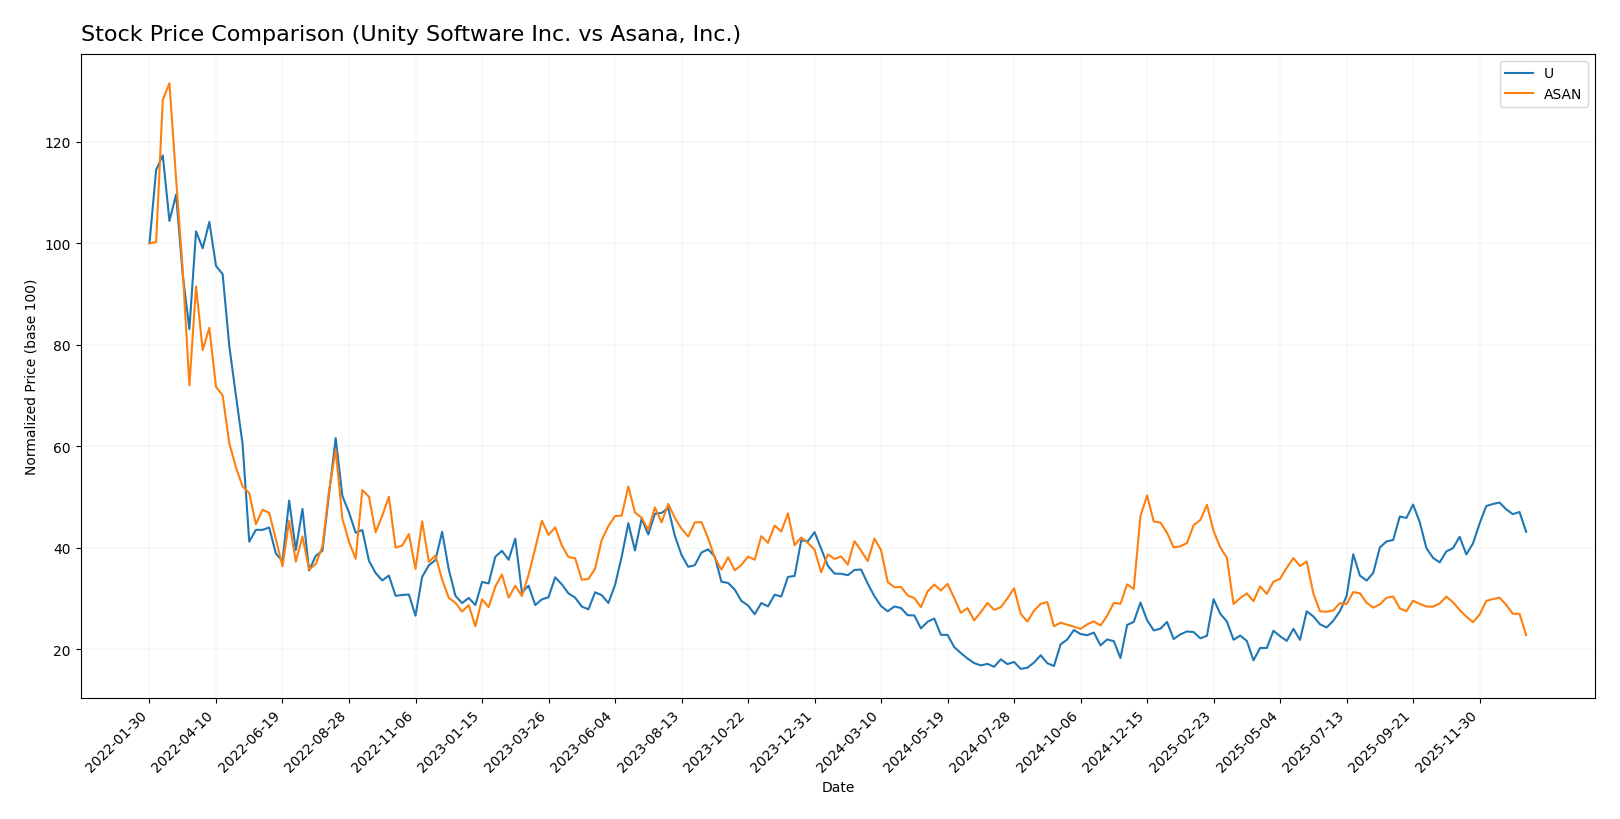
The stock price movements over the past year reveal a bullish acceleration for Unity Software Inc. with a 31.0% gain, while Asana, Inc. experiences a bearish deceleration marked by a 39.07% decline.
Trend Analysis
Unity Software Inc. shows a bullish trend over the past 12 months with a 31.0% price increase, accelerating momentum, and a notable price range between 15.32 and 46.42. Recent months indicate continued positive slope and reduced volatility.
Asana, Inc. exhibits a bearish trend with a 39.07% price drop over the past year, decelerating further. The stock traded between 10.93 and 24.15, with recent data showing steeper decline and low volatility.
Comparatively, Unity Software Inc. has delivered the strongest market performance, outperforming Asana, Inc. by a wide margin in price appreciation and trend acceleration.
Target Prices
Analysts present a balanced target price consensus for both Unity Software Inc. and Asana, Inc.
| Company | Target High | Target Low | Consensus |
|---|---|---|---|
| Unity Software Inc. | 60 | 39 | 50.98 |
| Asana, Inc. | 18 | 14 | 15.75 |
The consensus target price for Unity Software Inc. at 50.98 suggests upside potential from the current price of 40.95 USD. For Asana, Inc., the target consensus of 15.75 indicates a notable expected increase from its current 10.93 USD stock price.
Analyst Opinions Comparison
This section compares analysts’ ratings and grades for Unity Software Inc. and Asana, Inc.:
Rating Comparison
Unity Software Inc. Rating
- Rating: Both companies hold a D+ rating, rated as Very Favorable.
- Discounted Cash Flow Score: Both score 1, indicating a Very Unfavorable valuation.
- ROE Score: Each has a score of 1, reflecting Very Unfavorable profitability from equity.
- ROA Score: Both companies have a score of 1, indicating Very Unfavorable asset utilization.
- Debt To Equity Score: Unity scores 1 (Very Unfavorable), same as Asana, indicating high financial risk.
- Overall Score: Both companies have an overall score of 1, classified as Very Unfavorable.
Asana, Inc. Rating
- Rating: Both companies hold a D+ rating, rated as Very Favorable.
- Discounted Cash Flow Score: Both score 1, indicating a Very Unfavorable valuation.
- ROE Score: Each has a score of 1, reflecting Very Unfavorable profitability from equity.
- ROA Score: Both companies have a score of 1, indicating Very Unfavorable asset utilization.
- Debt To Equity Score: Unity scores 1 (Very Unfavorable), same as Asana, indicating high financial risk.
- Overall Score: Both companies have an overall score of 1, classified as Very Unfavorable.
Which one is the best rated?
Unity Software and Asana share identical ratings and financial scores, each rated D+ with very unfavorable scores across key metrics. Neither stands out as better rated based on the available data.
Scores Comparison
Here is a comparison of the Altman Z-Score and Piotroski Score for the two companies:
Unity Software Inc. Scores
- Altman Z-Score: 2.93, indicating moderate bankruptcy risk in the grey zone.
- Piotroski Score: 4, reflecting average financial strength.
Asana, Inc. Scores
- Altman Z-Score: -0.27, indicating high bankruptcy risk in the distress zone.
- Piotroski Score: 4, reflecting average financial strength.
Which company has the best scores?
Unity Software shows a significantly higher Altman Z-Score in the grey zone, suggesting lower bankruptcy risk than Asana, which is in the distress zone. Both companies have the same average Piotroski Score of 4.
Grades Comparison
Here is a comparison of the recent grades assigned to Unity Software Inc. and Asana, Inc.:
Unity Software Inc. Grades
The following table summarizes recent grades from reputable financial institutions for Unity Software Inc.:
| Grading Company | Action | New Grade | Date |
|---|---|---|---|
| Morgan Stanley | Maintain | Overweight | 2026-01-13 |
| Goldman Sachs | Maintain | Neutral | 2026-01-13 |
| Wells Fargo | Maintain | Overweight | 2026-01-08 |
| Jefferies | Maintain | Buy | 2026-01-05 |
| Piper Sandler | Upgrade | Overweight | 2025-12-11 |
| BTIG | Upgrade | Buy | 2025-12-11 |
| Wells Fargo | Upgrade | Overweight | 2025-12-05 |
| Arete Research | Upgrade | Buy | 2025-12-01 |
| Citigroup | Maintain | Buy | 2025-11-11 |
| Wells Fargo | Maintain | Equal Weight | 2025-11-07 |
Unity Software Inc. shows a strong positive trend with several upgrades from Neutral and Equal Weight to Buy or Overweight ratings.
Asana, Inc. Grades
The following table details recent grades from recognized grading companies for Asana, Inc.:
| Grading Company | Action | New Grade | Date |
|---|---|---|---|
| Citigroup | Upgrade | Buy | 2026-01-15 |
| RBC Capital | Maintain | Underperform | 2026-01-05 |
| Keybanc | Upgrade | Overweight | 2025-12-15 |
| DA Davidson | Maintain | Neutral | 2025-12-04 |
| Citigroup | Maintain | Neutral | 2025-12-03 |
| RBC Capital | Maintain | Underperform | 2025-12-03 |
| UBS | Maintain | Neutral | 2025-12-03 |
| Baird | Maintain | Neutral | 2025-09-04 |
| Morgan Stanley | Maintain | Underweight | 2025-09-04 |
| Piper Sandler | Maintain | Overweight | 2025-09-04 |
Asana, Inc. presents a more mixed picture, with some upgrades but also several maintains at Underperform and Neutral ratings.
Which company has the best grades?
Unity Software Inc. has received consistently more positive grades, including multiple upgrades to Buy and Overweight, indicating stronger analyst confidence compared to Asana, Inc., which shows a more cautious stance with several Underperform and Neutral ratings. This contrast could influence investor perception of risk and growth potential between the two.
Strengths and Weaknesses
Below is a comparison table highlighting the key strengths and weaknesses of Unity Software Inc. (U) and Asana, Inc. (ASAN) based on their latest financial and operational data.
| Criterion | Unity Software Inc. (U) | Asana, Inc. (ASAN) |
|---|---|---|
| Diversification | Moderate: Revenue split between Create Solutions (614M) and Operate Solutions (1.2B) segments, showing some product diversification. | Limited: Primarily focused on workplace productivity software with less product diversification. |
| Profitability | Weak: Negative net margin (-36.63%) and declining ROIC (-12.78%) indicate ongoing losses and value destruction. | Weak: More severe negative net margin (-35.3%) and ROIC (-53.03%), indicating larger losses and value destruction. |
| Innovation | Strong: Operate Solutions growing, supported by fixed asset turnover high at 18.35, indicating efficient use of assets in innovation areas. | Moderate: Innovation efforts present but less efficient with neutral fixed asset turnover (2.76). |
| Global presence | Strong: Large revenue scale (1.8B total in 2024) and diversified geographic reach implied by product scale. | Moderate: Smaller scale, no detailed segmentation data, likely more limited global reach. |
| Market Share | Established: Operate Solutions revenue nearly doubled since 2020, indicating gaining traction in its market niche. | Emerging: Smaller scale and less efficient capital use, suggests smaller market share or challenges in growth. |
Key takeaways: Both companies are currently value destroyers with negative profitability and declining ROIC trends. Unity shows better diversification and asset efficiency, while Asana faces heavier losses and capital inefficiency. Caution is warranted for investors; Unity’s operational scale and innovation efficiency offer a relatively stronger foundation.
Risk Analysis
Below is a comparative table highlighting key risks for Unity Software Inc. (U) and Asana, Inc. (ASAN) based on the most recent data from 2025-2026.
| Metric | Unity Software Inc. (U) | Asana, Inc. (ASAN) |
|---|---|---|
| Market Risk | High (Beta 2.05, volatile) | Moderate (Beta 0.92) |
| Debt Level | Moderate (Debt/Equity 0.74) | High (Debt/Equity 1.18) |
| Regulatory Risk | Moderate (US & global tech) | Moderate (US & global tech) |
| Operational Risk | Moderate (platform reliance) | Moderate (work management SaaS) |
| Environmental Risk | Low | Low |
| Geopolitical Risk | Moderate (global reach) | Moderate (global reach) |
Unity faces higher market risk due to its elevated beta, indicating greater stock volatility. Asana carries a higher debt burden, raising financial risk and interest coverage concerns. Both companies operate in competitive, regulated tech sectors with moderate operational and geopolitical risks. Unity’s Altman Z-score in the grey zone suggests moderate financial distress risk, while Asana’s score in the distress zone signals a higher bankruptcy risk. Investors should prioritize risk management, especially monitoring debt levels and market volatility.
Which Stock to Choose?
Unity Software Inc. (U) shows a mixed income evolution with strong revenue growth but declining profitability and negative returns on equity and assets. Financial ratios are slightly unfavorable overall, with moderate debt and a strong current ratio. Its rating remains very favorable despite challenges.
Asana, Inc. (ASAN) reports favorable income growth and gross margin but suffers from very negative returns on equity and invested capital. Financial ratios are also slightly unfavorable, with higher debt and weaker current liquidity. The company’s rating is very favorable, yet its financial stability is more strained.
From an investor’s perspective, Unity’s stronger income growth and more balanced financial ratios might appeal to growth-oriented investors, while Asana’s metrics could be interpreted as riskier with less financial efficiency. Both have very unfavorable global ratings and value destruction signals, suggesting cautious evaluation depending on risk tolerance and investment strategy.
Disclaimer: Investment carries a risk of loss of initial capital. The past performance is not a reliable indicator of future results. Be sure to understand risks before making an investment decision.
Go Further
I encourage you to read the complete analyses of Unity Software Inc. and Asana, Inc. to enhance your investment decisions: