In the dynamic landscape of technology-driven software applications, Uber Technologies, Inc. and Asana, Inc. stand out as prominent players innovating in distinct yet overlapping markets. Uber revolutionizes mobility, delivery, and freight services globally, while Asana enhances productivity through its collaborative work management platform. This article will analyze their strategies and performance to help you decide which company offers the most compelling investment opportunity in 2026.
Table of contents
Companies Overview
I will begin the comparison between Uber Technologies, Inc. and Asana, Inc. by providing an overview of these two companies and their main differences.
Uber Technologies, Inc. Overview
Uber Technologies, Inc. develops and operates proprietary technology applications globally, connecting consumers with independent providers of ride services and delivery services. It operates through three segments: Mobility, Delivery, and Freight, offering a broad range of transportation and logistics solutions. Founded in 2009 and headquartered in San Francisco, Uber is a leading player in the software application industry with a market cap of $176B.
Asana, Inc. Overview
Asana, Inc. operates a work management platform designed to help teams organize and track work from daily tasks to strategic initiatives. It serves a diverse customer base across sectors such as technology, retail, education, and healthcare. Incorporated in 2008 and also based in San Francisco, Asana focuses on software applications for collaborative productivity with a market cap of $2.6B.
Key similarities and differences
Both Uber and Asana are technology companies listed on the NYSE, operating in the software application industry with headquarters in San Francisco. However, Uber’s business model centers on connecting consumers with mobility and delivery services worldwide, while Asana focuses on providing digital work management tools aimed at improving team productivity. They differ significantly in scale, with Uber commanding a substantially larger market capitalization and employee base.
Income Statement Comparison
This table presents a side-by-side comparison of key income statement metrics for Uber Technologies, Inc. and Asana, Inc. based on their most recent fiscal year data.
| Metric | Uber Technologies, Inc. | Asana, Inc. |
|---|---|---|
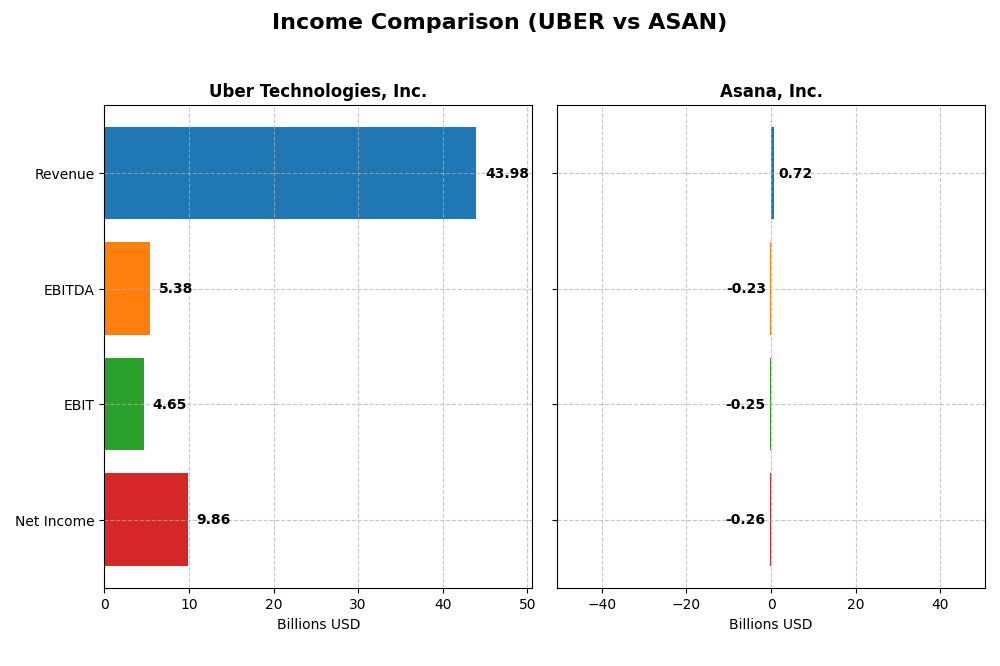
| Market Cap | 176.3B | 2.6B |
| Revenue | 43.98B | 724M |
| EBITDA | 5.39B | -230M |
| EBIT | 4.65B | -247M |
| Net Income | 9.81B | -256M |
| EPS | 4.71 | -1.11 |
| Fiscal Year | 2024 | 2025 |
Income Statement Interpretations
Uber Technologies, Inc.
Uber has shown strong upward trends in revenue and net income from 2020 to 2024, with revenue reaching $44B and net income nearly $9.8B in 2024. Margins improved significantly, with a gross margin of 39.4% and net margin of 22.41% in the latest year. The company’s 2024 growth accelerated, with net income surging over 400% year-on-year, reflecting improved profitability and operational efficiency.
Asana, Inc.
Asana experienced steady revenue growth from $227M in 2021 to $724M in 2025, yet net income remained negative, at -$256M in 2025. While gross margin is high at 89.34%, EBIT and net margins are unfavorable, reflecting ongoing operating losses. The 2025 performance saw revenue growth of nearly 11%, with modest improvements in net margin and EPS, but profitability challenges persist.
Which one has the stronger fundamentals?
Uber demonstrates stronger fundamentals, with consistent revenue and net income growth, favorable margins, and significant profitability improvements in 2024. Asana’s revenue growth is notable but overshadowed by persistent net losses and negative margins. Uber’s robust income statement metrics and margin expansions provide a more favorable financial profile compared to Asana’s ongoing profitability struggles.
Financial Ratios Comparison
The table below presents a side-by-side comparison of key financial ratios for Uber Technologies, Inc. and Asana, Inc. based on their most recent fiscal year data.
| Ratios | Uber Technologies, Inc. (2024) | Asana, Inc. (2025) |
|---|---|---|
| ROE | 45.7% | -112.3% |
| ROIC | 6.79% | -53.0% |
| P/E | 12.8 | -19.2 |
| P/B | 5.86 | 21.52 |
| Current Ratio | 1.07 | 1.44 |
| Quick Ratio | 1.07 | 1.44 |
| D/E (Debt to Equity) | 0.53 | 1.18 |
| Debt-to-Assets | 22.3% | 30.1% |
| Interest Coverage | 5.35 | -72.42 |
| Asset Turnover | 0.86 | 0.81 |
| Fixed Asset Turnover | 14.14 | 2.76 |
| Payout ratio | 0 | 0 |
| Dividend yield | 0 | 0 |
Interpretation of the Ratios
Uber Technologies, Inc.
Uber’s financial ratios reveal a generally strong profile with a favorable net margin of 22.41% and an impressive return on equity at 45.72%. The company shows neutral to favorable liquidity and leverage metrics, including a current ratio of 1.07 and debt-to-assets ratio at 22.32%. However, the price-to-book ratio is unfavorable at 5.86. Uber does not pay dividends, likely prioritizing growth and reinvestment.
Asana, Inc.
Asana displays weaker financial ratios with a notably negative net margin of -35.3% and a highly unfavorable return on equity of -112.31%. Its debt-to-equity ratio is elevated at 1.18, and interest coverage is negative, signaling financial stress. The price-to-book ratio is also unfavorable at 21.52. Asana does not pay dividends, which aligns with its continued investment in R&D and growth initiatives.
Which one has the best ratios?
Between Uber and Asana, Uber holds a more favorable ratio profile with half of its key metrics rated positively, including strong profitability and solvency measures. Asana’s ratios are largely unfavorable, reflecting operational and financial challenges. Uber’s balanced liquidity and leverage contrast with Asana’s higher risk indicators, making Uber’s ratios comparatively stronger.
Strategic Positioning
This section compares the strategic positioning of Uber and Asana, including market position, key segments, and exposure to technological disruption:
Uber Technologies, Inc.
- Large market cap of 176B with diversified competitive pressures in ride-sharing, delivery, and freight logistics
- Operates three main segments: Mobility, Delivery, and Freight, driving revenue diversification and growth
- Exposed to technological disruption through proprietary apps linking consumers and providers across global regions
Asana, Inc.
- Smaller market cap of 2.6B focused on work management software with less direct competition pressure
- Concentrated on a single platform serving multiple industries such as tech, retail, and healthcare
- Faces disruption risks inherent in SaaS market, focusing on workflow orchestration and team collaboration
Uber vs Asana Positioning
Uber follows a diversified business model across multiple transportation and delivery services, providing broad revenue streams but facing complex operational challenges. Asana maintains a concentrated approach in work management software, offering targeted solutions but with narrower market scope.
Which has the best competitive advantage?
Uber shows a slightly unfavorable moat with growing profitability, indicating improving competitive positioning despite current value destruction. Asana exhibits a very unfavorable moat with declining returns, signaling weaker competitive advantage and deteriorating profitability.
Stock Comparison
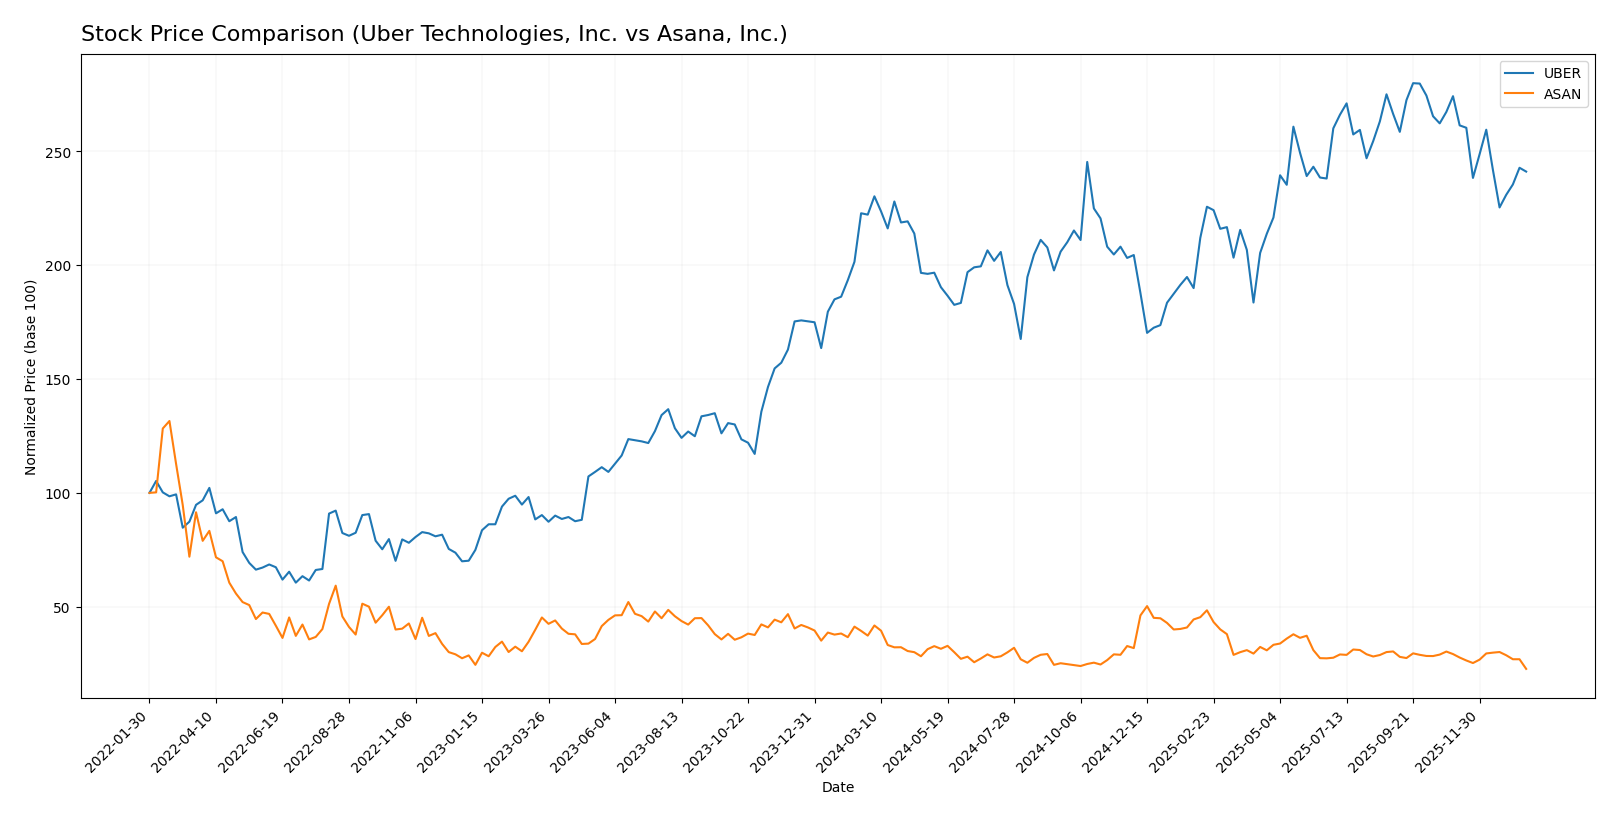
The stock price movements over the past 12 months reveal contrasting dynamics between Uber Technologies, Inc. and Asana, Inc., with Uber showing modest gains amid decelerating momentum and Asana experiencing a significant decline with slowing bearish pressure.
Trend Analysis
Uber Technologies, Inc. exhibited a bullish trend over the past year with an 8.5% price increase, but the trend shows deceleration. The stock ranged from a low of 58.99 to a high of 98.51, with high volatility indicated by a 10.29 standard deviation.
Asana, Inc. recorded a bearish trend with a 39.07% price drop over the same period, also decelerating. Prices fluctuated between 10.93 and 24.15, with lower volatility reflected in a 2.87 standard deviation.
Comparatively, Uber delivered the highest market performance over the last 12 months, outperforming Asana’s significant negative price movement despite decelerating trends for both stocks.
Target Prices
Analysts present a clear consensus on target prices for Uber Technologies, Inc. and Asana, Inc.
| Company | Target High | Target Low | Consensus |
|---|---|---|---|
| Uber Technologies, Inc. | 140 | 73 | 111.26 |
| Asana, Inc. | 18 | 14 | 15.75 |
The consensus target for Uber at 111.26 suggests significant upside compared to its current price of 84.85. Asana’s target consensus of 15.75 also indicates potential growth from its current price of 10.93.
Analyst Opinions Comparison
This section compares analysts’ ratings and grades for Uber Technologies, Inc. and Asana, Inc.:
Rating Comparison
Uber Rating
- Rating: B, considered very favorable by analysts.
- Discounted Cash Flow Score: 1, indicating a very unfavorable valuation outlook.
- ROE Score: 5, very favorable, showing strong profit generation from equity.
- ROA Score: 5, very favorable, reflecting efficient asset utilization.
- Debt To Equity Score: 2, moderate, suggesting some financial leverage risk.
- Overall Score: 3, moderate overall financial standing.
Asana Rating
- Rating: D+, also stated as very favorable despite the low grade.
- Discounted Cash Flow Score: 1, very unfavorable valuation outlook.
- ROE Score: 1, very unfavorable, indicating weak profit generation from equity.
- ROA Score: 1, very unfavorable, showing poor asset utilization.
- Debt To Equity Score: 1, very unfavorable, indicating high financial risk.
- Overall Score: 1, very unfavorable overall financial standing.
Which one is the best rated?
Based strictly on the provided data, Uber holds a higher overall rating and stronger financial scores, particularly in ROE and ROA, compared to Asana, which shows uniformly low scores across all metrics.
Scores Comparison
Here is a comparison of the financial health scores for Uber and Asana:
Uber Scores
- Altman Z-Score: 4.44, indicating a safe zone with low bankruptcy risk.
- Piotroski Score: 6, classified as average financial strength.
Asana Scores
- Altman Z-Score: -0.27, indicating distress zone and high bankruptcy risk.
- Piotroski Score: 4, also classified as average financial strength.
Which company has the best scores?
Based strictly on the provided data, Uber shows stronger financial health with a safe-zone Altman Z-Score, while Asana falls in the distress zone. Both have average Piotroski Scores, but Uber’s higher Altman Z-Score indicates better financial stability.
Grades Comparison
Here is a detailed comparison of the recent grades assigned to Uber Technologies, Inc. and Asana, Inc.:
Uber Technologies, Inc. Grades
The following table summarizes recent grades from major financial institutions for Uber:
| Grading Company | Action | New Grade | Date |
|---|---|---|---|
| BTIG | Maintain | Buy | 2026-01-15 |
| Wells Fargo | Maintain | Overweight | 2026-01-08 |
| Cantor Fitzgerald | Maintain | Overweight | 2026-01-08 |
| Wolfe Research | Maintain | Outperform | 2026-01-06 |
| Wedbush | Maintain | Neutral | 2025-12-19 |
| Morgan Stanley | Maintain | Overweight | 2025-12-08 |
| Arete Research | Upgrade | Buy | 2025-12-03 |
| Wells Fargo | Maintain | Overweight | 2025-11-05 |
| Guggenheim | Maintain | Buy | 2025-11-05 |
| DA Davidson | Maintain | Buy | 2025-11-05 |
Uber’s grades show a generally positive trend with multiple buy and overweight ratings sustained, alongside a recent upgrade from Arete Research.
Asana, Inc. Grades
The recent grades assigned to Asana by financial analysts are as follows:
| Grading Company | Action | New Grade | Date |
|---|---|---|---|
| Citigroup | Upgrade | Buy | 2026-01-15 |
| RBC Capital | Maintain | Underperform | 2026-01-05 |
| Keybanc | Upgrade | Overweight | 2025-12-15 |
| DA Davidson | Maintain | Neutral | 2025-12-04 |
| Citigroup | Maintain | Neutral | 2025-12-03 |
| RBC Capital | Maintain | Underperform | 2025-12-03 |
| UBS | Maintain | Neutral | 2025-12-03 |
| Baird | Maintain | Neutral | 2025-09-04 |
| Morgan Stanley | Maintain | Underweight | 2025-09-04 |
| Piper Sandler | Maintain | Overweight | 2025-09-04 |
Asana’s grades are more mixed, featuring upgrades to buy and overweight but also several underperform and neutral ratings, indicating a less uniform outlook.
Which company has the best grades?
Uber Technologies, Inc. has received more consistently positive grades, with numerous buy and overweight ratings and fewer neutral ratings compared to Asana, Inc. This stronger grading consensus for Uber could reflect greater confidence among analysts, potentially impacting investor sentiment and perceived risk.
Strengths and Weaknesses
Below is a comparative table highlighting the key strengths and weaknesses of Uber Technologies, Inc. and Asana, Inc. based on their latest financial and strategic data.
| Criterion | Uber Technologies, Inc. (UBER) | Asana, Inc. (ASAN) |
|---|---|---|
| Diversification | Strong diversification with Delivery ($13.75B), Mobility ($25.1B), and Freight ($5.14B) revenue streams. | Limited diversification, primarily focused on collaborative work management software. |
| Profitability | Favorable net margin (22.41%) and ROE (45.72%), but ROIC slightly below WACC, indicating mild value destruction. | Unfavorable profitability with negative net margin (-35.3%), ROE (-112.31%), and ROIC (-53.03%). |
| Innovation | Moderate innovation with growing ROIC trend (139.4%), though currently slightly value destructive. | Declining ROIC (-74.0%) signals weakening profitability and innovation challenges. |
| Global presence | Extensive global footprint supported by diverse service lines and strong asset turnover. | More limited global presence as a SaaS company, with weaker financial leverage indicators. |
| Market Share | Significant market share in ride-hailing and food delivery sectors. | Smaller market share with growing competition in the productivity software space. |
Key takeaways: Uber shows robust diversification and improving profitability, although it currently slightly destroys value. Asana struggles with profitability and innovation, facing significant challenges to create shareholder value. Investors should weigh Uber’s scale and growth against Asana’s riskier profile.
Risk Analysis
Below is a comparative table highlighting key risks for Uber Technologies, Inc. and Asana, Inc. based on their latest financial and operational data from 2025-2026.
| Metric | Uber Technologies, Inc. | Asana, Inc. |
|---|---|---|
| Market Risk | Moderate (Beta 1.20) | Moderate (Beta 0.92) |
| Debt Level | Moderate (Debt/Equity 0.53) | High (Debt/Equity 1.18) |
| Regulatory Risk | Moderate (Global operations face varying regulations) | Moderate (Tech sector regulatory scrutiny) |
| Operational Risk | Moderate (Complex logistics and platform management) | Moderate (Reliance on platform adoption) |
| Environmental Risk | Low (Service-oriented, minimal direct emissions) | Low (Software-based, low direct environmental impact) |
| Geopolitical Risk | Moderate (Global presence in diverse regions) | Low (Primarily US-focused) |
Uber faces moderate market and geopolitical risks due to its global footprint and regulatory environments. Its manageable debt and solid profitability mitigate financial risks. Asana, however, carries higher financial risk with significant debt and negative profitability metrics, placing it in distress territory for bankruptcy risk, warranting cautious consideration.
Which Stock to Choose?
Uber Technologies, Inc. shows a strong income evolution with 295% revenue growth over five years and consistently favorable profitability metrics, including a 22.41% net margin in 2024. Financial ratios are slightly favorable overall, supported by a robust ROE of 45.72%, neutral debt levels, and a very favorable rating of B. The company carries moderate debt with a net debt to EBITDA ratio below 1 and demonstrates improving profitability despite a slightly unfavorable moat status.
Asana, Inc. displays favorable revenue growth of 219% over its period but struggles with profitability, posting a -35.3% net margin and unfavorable returns on equity and invested capital. Its financial ratios are slightly unfavorable overall, with high debt-to-equity and negative interest coverage. The rating is very unfavorable (D+), reflecting financial distress and declining profitability, confirmed by a very unfavorable moat evaluation and scores indicating distress zone risk.
Which stock is the most favorable for an investor might appear to depend on the investor’s risk tolerance and strategy: those seeking companies with improving profitability and solid financial health could find Uber’s profile more aligned, while investors with higher risk tolerance interested in turnaround potential might consider Asana’s growth trajectory despite its current financial challenges. The ratings and income statements suggest Uber maintains a stronger financial footing, whereas Asana exhibits significant risks.
Disclaimer: Investment carries a risk of loss of initial capital. The past performance is not a reliable indicator of future results. Be sure to understand risks before making an investment decision.
Go Further
I encourage you to read the complete analyses of Uber Technologies, Inc. and Asana, Inc. to enhance your investment decisions: