In the ever-evolving software industry, Tyler Technologies, Inc. and Asana, Inc. stand out as key players with distinct yet overlapping market focuses. Tyler specializes in integrated management solutions for the public sector, while Asana offers a dynamic work management platform for teams across various industries. Both companies innovate to improve operational efficiency, making their comparison crucial for investors seeking growth and stability. Join me as we explore which company presents the most compelling investment opportunity in 2026.
Table of contents
Companies Overview
I will begin the comparison between Tyler Technologies and Asana by providing an overview of these two companies and their main differences.
Tyler Technologies Overview
Tyler Technologies, Inc. provides integrated information management solutions and services primarily for the public sector. Its offerings include financial management, utility billing, judicial solutions, public safety software, and property appraisal systems. Founded in 1966 and headquartered in Plano, Texas, Tyler has a comprehensive portfolio serving government agencies and K-12 schools, positioning itself as a key player in public sector software with a market cap of approximately 18.9B USD.
Asana Overview
Asana, Inc. operates a work management platform designed to help teams coordinate daily tasks and strategic initiatives across various industries such as technology, retail, and healthcare. Founded in 2008 and based in San Francisco, California, Asana focuses on enabling collaboration and productivity for individuals and organizations globally. The company is publicly traded with a market cap near 2.6B USD and serves a broad customer base through its cloud-based platform.
Key similarities and differences
Both Tyler Technologies and Asana operate within the software application industry and are listed on the NYSE. They provide cloud-enabled software solutions to improve organizational efficiency, though Tyler focuses on public sector management tools, while Asana targets workflow and task management across multiple industries. Tyler’s product suite is more specialized in government functions, contrasting with Asana’s broader, cross-sector collaboration platform.
Income Statement Comparison
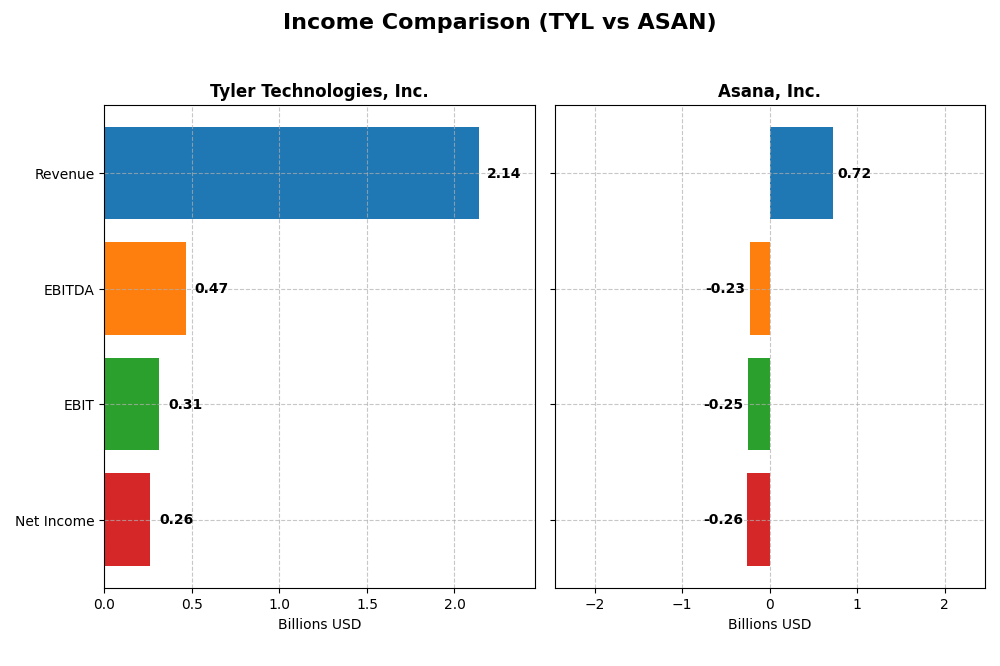
This table presents a side-by-side comparison of the latest fiscal year income statement metrics for Tyler Technologies, Inc. and Asana, Inc., highlighting key financial performance indicators.
| Metric | Tyler Technologies, Inc. (TYL) | Asana, Inc. (ASAN) |
|---|---|---|
| Market Cap | 18.9B | 2.6B |
| Revenue | 2.14B | 724M |
| EBITDA | 466M | -230M |
| EBIT | 314M | -247M |
| Net Income | 263M | -256M |
| EPS | 6.17 | -1.11 |
| Fiscal Year | 2024 | 2025 |
Income Statement Interpretations
Tyler Technologies, Inc.
Tyler Technologies demonstrated consistent revenue growth from 2020 to 2024, increasing from $1.12B to $2.14B, with net income rising from $195M to $263M. Margins largely remained stable, with a slight decline in net margin over the period. In 2024, revenue growth slowed moderately to 9.5%, while net income and EBIT margins improved notably, signaling operational efficiency gains.
Asana, Inc.
Asana’s revenue surged significantly from $227M in 2021 to $724M in 2025, reflecting rapid expansion. However, net losses persisted, with a net income of -$256M in 2025 despite improved gross margins above 89%. The latest year showed revenue growth at 10.9%, with slight improvements in net margin and EPS, though EBIT margin remained deeply negative, highlighting ongoing profitability challenges.
Which one has the stronger fundamentals?
Tyler Technologies exhibits stronger fundamentals, with stable profitability, positive net income, and favorable margin trends alongside steady revenue growth. In contrast, Asana’s high revenue growth is offset by persistent net losses and negative EBIT margins, indicating higher operational risks despite improving efficiency. Tyler’s consistent earnings and margin stability suggest a more robust income statement profile.
Financial Ratios Comparison
This table presents the most recent key financial ratios for Tyler Technologies, Inc. and Asana, Inc., offering a side-by-side view of their fiscal year 2024 and 2025 metrics respectively.
| Ratios | Tyler Technologies, Inc. (2024) | Asana, Inc. (2025) |
|---|---|---|
| ROE | 7.76% | -112.31% |
| ROIC | 6.20% | -53.03% |
| P/E | 93.42 | -19.16 |
| P/B | 7.25 | 21.52 |
| Current Ratio | 1.35 | 1.44 |
| Quick Ratio | 1.35 | 1.44 |
| D/E (Debt-to-Equity) | 0.19 | 1.18 |
| Debt-to-Assets | 12.32% | 30.11% |
| Interest Coverage | 50.50 | -72.42 |
| Asset Turnover | 0.41 | 0.81 |
| Fixed Asset Turnover | 10.95 | 2.76 |
| Payout Ratio | 0 | 0 |
| Dividend Yield | 0 | 0 |
Interpretation of the Ratios
Tyler Technologies, Inc.
Tyler Technologies shows a mixed ratio profile with strengths in net margin (12.3%) and interest coverage (52.96), indicating solid profitability and debt service capacity. However, its high PE (93.42) and PB (7.25) ratios suggest potentially overvalued shares, while ROE (7.76%) is weak. The company does not pay dividends, reflecting a possible reinvestment strategy or growth focus.
Asana, Inc.
Asana’s ratios reveal significant challenges, including a negative net margin (-35.3%) and very weak ROE (-112.31%), highlighting ongoing losses and poor profitability. Leverage is high with a debt-to-equity ratio of 1.18, and interest coverage is deeply negative (-67.09). Asana also does not distribute dividends, consistent with its growth phase and reinvestment priorities.
Which one has the best ratios?
Tyler Technologies presents a more favorable overall ratio profile, balancing profitability and financial stability despite some valuation concerns. In contrast, Asana faces unfavorable profitability and leverage metrics, reflecting operational struggles. Tyler’s ratios suggest a more stable financial footing compared to Asana’s weaker and more volatile metrics.
Strategic Positioning
This section compares the strategic positioning of Tyler Technologies and Asana, including market position, key segments, and exposure to technological disruption:
Tyler Technologies, Inc.
- Established market player focusing on public sector software with steady competitive pressure.
- Focused on public sector solutions: enterprise software, appraisal, tax, SaaS, and professional services.
- Limited direct mention of disruption; strategic AWS collaboration suggests cloud adoption focus.
Asana, Inc.
- Emerging player in work management software facing intense competition.
- Concentrated on work management platform serving diverse industries globally.
- No specific disruption details; operates in fast-evolving SaaS work management sector.
Tyler Technologies, Inc. vs Asana, Inc. Positioning
Tyler Technologies pursues a diversified public sector software approach, leveraging multiple segments and long-term contracts. Asana concentrates on a single SaaS platform for work management across industries, which may limit diversification but focuses innovation.
Which has the best competitive advantage?
Both companies show very unfavorable MOAT evaluations with declining ROIC below WACC, indicating value destruction and weak sustainable competitive advantages based on current data.
Stock Comparison
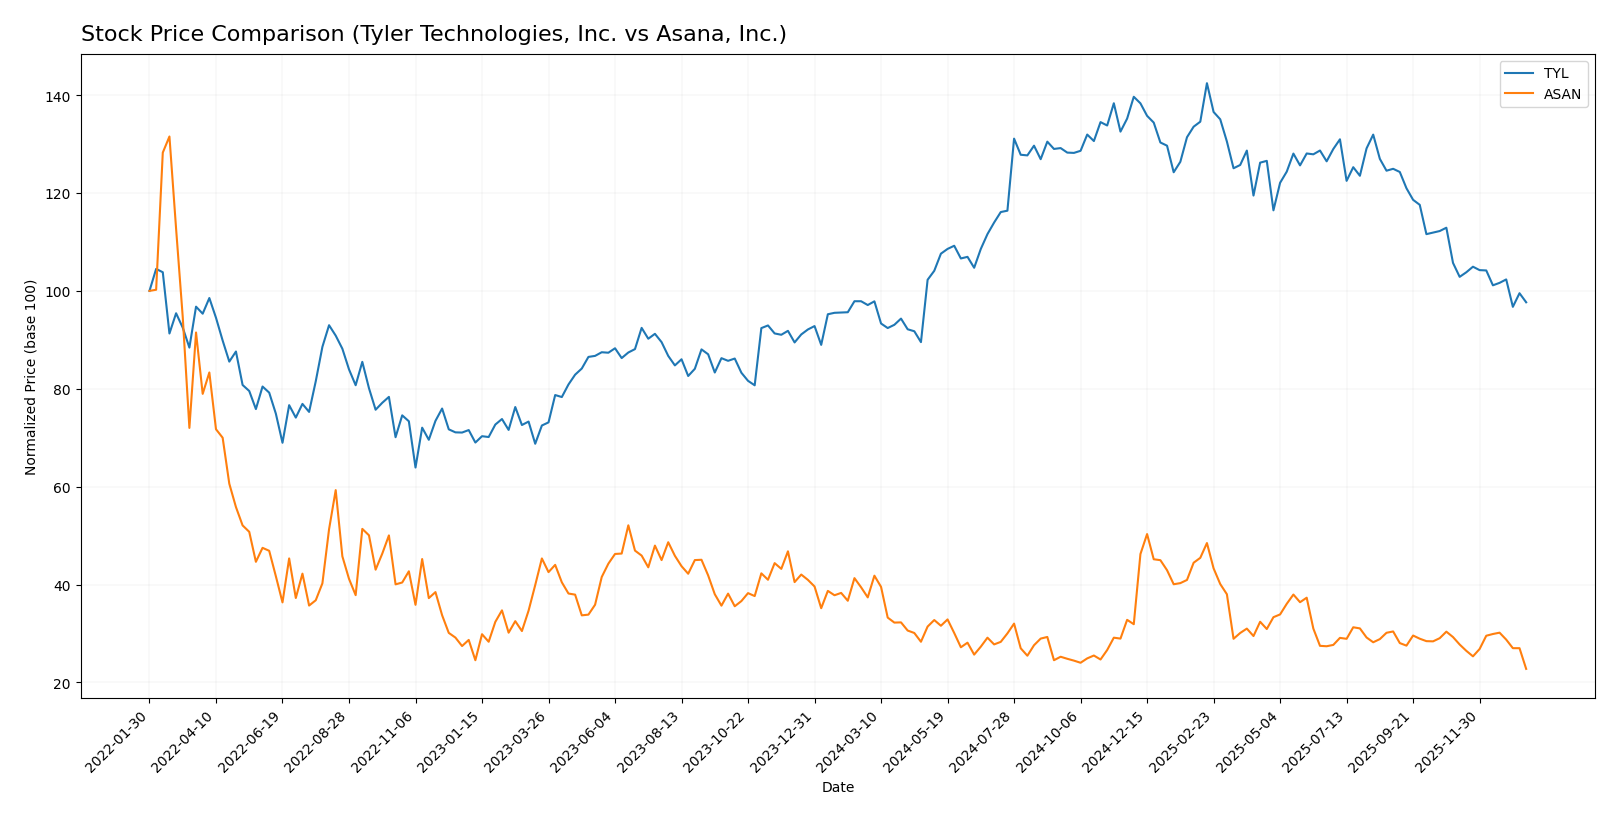
The stock prices of Tyler Technologies, Inc. (TYL) and Asana, Inc. (ASAN) have exhibited contrasting trajectories over the past 12 months, with TYL showing mild positive growth and ASAN experiencing significant decline amid changing trading dynamics.
Trend Analysis
Tyler Technologies, Inc. (TYL) experienced a slight bullish trend over the past year with a 0.58% price increase, though the trend is decelerating. The stock ranged between 403.35 and 641.7, showing moderate volatility (std. dev. 61.82).
Asana, Inc. (ASAN) demonstrated a bearish trend with a 39.07% price decrease over the past year, accompanied by deceleration in the downtrend. Its price fluctuated between 10.93 and 24.15, with low volatility (std. dev. 2.87).
Comparing the two, TYL delivered the highest market performance with a positive albeit modest price change, while ASAN showed a significant negative return, reflecting weaker market momentum.
Target Prices
Here is the current analyst target price consensus for Tyler Technologies, Inc. and Asana, Inc.
| Company | Target High | Target Low | Consensus |
|---|---|---|---|
| Tyler Technologies, Inc. | 675 | 470 | 584 |
| Asana, Inc. | 18 | 14 | 15.75 |
Analysts expect Tyler Technologies’ stock to appreciate significantly from its current price of $440.01, indicating strong growth potential. Asana’s consensus target price of $15.75 also suggests upside from its $10.93 level, reflecting moderate market optimism.
Analyst Opinions Comparison
This section compares analysts’ ratings and grades for Tyler Technologies, Inc. and Asana, Inc.:
Rating Comparison
TYL Rating
- Rating: B, evaluated as Very Favorable status.
- Discounted Cash Flow Score: 4, indicating favorable valuation based on future cash flows.
- ROE Score: 3, reflecting moderate efficiency in generating profit from equity.
- ROA Score: 4, showing favorable asset utilization for earnings.
- Debt To Equity Score: 3, indicating moderate financial risk.
- Overall Score: 3, considered moderate overall financial standing.
ASAN Rating
- Rating: D+, evaluated as Very Unfavorable status.
- Discounted Cash Flow Score: 1, showing very unfavorable valuation.
- ROE Score: 1, indicating very unfavorable profitability from equity.
- ROA Score: 1, reflecting very unfavorable asset efficiency.
- Debt To Equity Score: 1, suggesting very unfavorable financial risk.
- Overall Score: 1, indicating very unfavorable overall financial standing.
Which one is the best rated?
Tyler Technologies holds a significantly better rating profile than Asana, with higher scores in discounted cash flow, profitability, asset efficiency, and financial risk metrics. Overall, TYL’s scores are moderate to favorable, while ASAN’s are very unfavorable.
Scores Comparison
This table compares the Altman Z-Score and Piotroski Score for Tyler Technologies and Asana, reflecting their financial stability and strength:
TYL Scores
- Altman Z-Score: 7.42, indicating a safe zone with low bankruptcy risk.
- Piotroski Score: 6, reflecting average financial strength.
ASAN Scores
- Altman Z-Score: -0.27, indicating distress zone with high bankruptcy risk.
- Piotroski Score: 4, reflecting average financial strength.
Which company has the best scores?
Tyler Technologies exhibits a significantly stronger Altman Z-Score in the safe zone, whereas Asana is in the distress zone. Both have average Piotroski Scores, but Tyler’s overall financial stability is better based on these scores.
Grades Comparison
The following presents the latest reliable grades from recognized financial institutions for Tyler Technologies, Inc. and Asana, Inc.:
Tyler Technologies, Inc. Grades
This table summarizes recent grades assigned by established grading companies for Tyler Technologies, Inc.
| Grading Company | Action | New Grade | Date |
|---|---|---|---|
| Piper Sandler | Maintain | Overweight | 2026-01-13 |
| Wells Fargo | Maintain | Equal Weight | 2026-01-08 |
| DA Davidson | Maintain | Neutral | 2025-12-09 |
| Evercore ISI Group | Maintain | In Line | 2025-10-31 |
| DA Davidson | Maintain | Neutral | 2025-10-31 |
| DA Davidson | Maintain | Neutral | 2025-10-10 |
| DA Davidson | Maintain | Neutral | 2025-08-05 |
| Barclays | Maintain | Overweight | 2025-07-31 |
| Needham | Maintain | Buy | 2025-05-13 |
| Barclays | Maintain | Overweight | 2025-04-25 |
Overall, Tyler Technologies has consistently received neutral to overweight ratings, with a consensus rating of “Buy” based on 21 buy and 12 hold recommendations, indicating generally positive analyst sentiment.
Asana, Inc. Grades
This table summarizes recent grades assigned by established grading companies for Asana, Inc.
| Grading Company | Action | New Grade | Date |
|---|---|---|---|
| Citigroup | Upgrade | Buy | 2026-01-15 |
| RBC Capital | Maintain | Underperform | 2026-01-05 |
| Keybanc | Upgrade | Overweight | 2025-12-15 |
| DA Davidson | Maintain | Neutral | 2025-12-04 |
| Citigroup | Maintain | Neutral | 2025-12-03 |
| RBC Capital | Maintain | Underperform | 2025-12-03 |
| UBS | Maintain | Neutral | 2025-12-03 |
| Baird | Maintain | Neutral | 2025-09-04 |
| Morgan Stanley | Maintain | Underweight | 2025-09-04 |
| Piper Sandler | Maintain | Overweight | 2025-09-04 |
Asana’s ratings demonstrate mixed opinions, ranging from underperform to buy, with a consensus rating also at “Buy” supported by 8 buy, 7 hold, and 3 sell ratings, reflecting moderate analyst confidence with some caution.
Which company has the best grades?
Tyler Technologies holds stronger and more consistent positive ratings compared to Asana, which shows a wider spread including underperform and underweight grades. This may imply relatively lower analyst risk perception for Tyler Technologies, potentially affecting investor confidence differently between the two.
Strengths and Weaknesses
Below is a comparison of key strengths and weaknesses for Tyler Technologies, Inc. (TYL) and Asana, Inc. (ASAN) based on their most recent financial and operational data.
| Criterion | Tyler Technologies, Inc. (TYL) | Asana, Inc. (ASAN) |
|---|---|---|
| Diversification | Strong revenue mix: SaaS, transaction fees, maintenance, services, and hardware segments. | Limited diversification; primarily software-focused. |
| Profitability | Positive net margin (12.3%) and neutral ROIC (6.2%), but ROE is below average (7.76%). | Negative net margin (-35.3%) and deeply negative ROIC (-53.03%) and ROE (-112.31%). |
| Innovation | Moderate innovation with consistent software segment growth. | Innovation-driven but struggling with profitability and value creation. |
| Global presence | Established in US public sector with expanding platform technologies. | Focused on global SaaS market but smaller scale and less mature. |
| Market Share | Leading position in government software solutions. | Competing in a crowded project management software space with smaller market share. |
Key takeaways: Tyler Technologies demonstrates a more diversified revenue base and better profitability metrics, despite some concerns about capital efficiency. Asana is highly innovative but faces significant challenges in profitability and value creation, making it a riskier investment at this time.
Risk Analysis
Below is a comparative risk table for Tyler Technologies, Inc. (TYL) and Asana, Inc. (ASAN) based on the most recent fiscal data.
| Metric | Tyler Technologies, Inc. (TYL) | Asana, Inc. (ASAN) |
|---|---|---|
| Market Risk | Moderate (Beta 0.916) | Moderate (Beta 0.916) |
| Debt level | Low (Debt/Equity 0.19, favorable) | High (Debt/Equity 1.18, unfavorable) |
| Regulatory Risk | Moderate (Public sector contracts) | Moderate (Tech industry regulations) |
| Operational Risk | Low (Stable segments, diverse public sector software) | High (Early-stage SaaS, negative margins) |
| Environmental Risk | Low (Software industry, minimal impact) | Low (Software industry, minimal impact) |
| Geopolitical Risk | Moderate (US-focused government contracts) | Moderate (Global SaaS platform exposure) |
The most impactful risks are Asana’s financial distress, visible in its negative net margin (-35.3%), high debt level, and low Altman Z-Score (-0.27, distress zone), indicating a higher bankruptcy risk. Tyler shows stronger financial stability with a safe Altman Z-Score (7.42) and lower leverage, though its valuation remains high, which investors should monitor cautiously.
Which Stock to Choose?
Tyler Technologies, Inc. (TYL) shows steady income growth with a favorable net margin of 12.3% and strong gross and EBIT margins. Financial ratios are slightly favorable overall, with low debt and good liquidity. However, ROE and valuation multiples remain less attractive. The company’s rating is very favorable, supported by a safe Altman Z-Score, though its economic moat is very unfavorable due to declining ROIC.
Asana, Inc. (ASAN) experienced rapid revenue growth but posts negative profitability metrics, including a -35.3% net margin and unfavorable ROE and ROIC ratios. Financial ratios are mostly unfavorable, with high debt levels and weak interest coverage. The rating is very unfavorable, with distress zone Altman Z-Score and a very unfavorable economic moat reflecting value destruction and deteriorating profitability.
Investors focused on quality and financial stability might find Tyler Technologies’ stronger income statement and rating more appealing, despite its challenged moat. Conversely, those prioritizing high growth potential but accepting higher risk could view Asana’s rapid revenue expansion as a possible opportunity, though its financial health and profitability remain concerning.
Disclaimer: Investment carries a risk of loss of initial capital. The past performance is not a reliable indicator of future results. Be sure to understand risks before making an investment decision.
Go Further
I encourage you to read the complete analyses of Tyler Technologies, Inc. and Asana, Inc. to enhance your investment decisions: