Home > Comparison > Technology > MSTR vs ASAN
The strategic rivalry between Strategy Inc and Asana, Inc. shapes the evolving landscape of the technology sector. Strategy Inc operates as a bitcoin treasury company with AI-powered enterprise analytics, blending finance and software innovation. In contrast, Asana, Inc. delivers a high-margin work management platform driving productivity across diverse industries. This analysis contrasts their distinct models to identify which offers a superior risk-adjusted return for a diversified portfolio in 2026.
Table of contents
Companies Overview
Strategy Inc and Asana, Inc. define critical niches in the software application industry with distinct market approaches and scale.
Strategy Inc: Bitcoin Treasury Pioneer and AI Analytics Provider
Strategy Inc holds a leading position as a bitcoin treasury company while also offering AI-powered enterprise analytics software. Its core revenue stems from securities providing Bitcoin exposure and advanced analytics products like Strategy One and Strategy Mosaic. In 2025, it strategically rebranded from MicroStrategy to emphasize its dual focus on digital assets and data intelligence.
Asana, Inc.: Work Management Platform Innovator
Asana, Inc. operates a versatile work management platform used globally by teams to coordinate tasks and strategic initiatives. Its revenue derives from platform subscriptions across diverse industries such as technology, retail, and healthcare. The company maintains a clear strategic focus on expanding cross-functional orchestration capabilities to optimize organizational productivity.
Strategic Collision: Similarities & Divergences
Both firms compete in the software application sector but pursue different philosophies: Strategy Inc embraces a crypto-anchored, data analytics hybrid model, while Asana champions collaborative work orchestration. Their primary battleground is enterprise software adoption, with Strategy targeting data-driven decision-making and Asana focused on workflow efficiency. These distinctions create diverse investment profiles shaped by exposure to digital assets versus SaaS subscription growth.
Income Statement Comparison
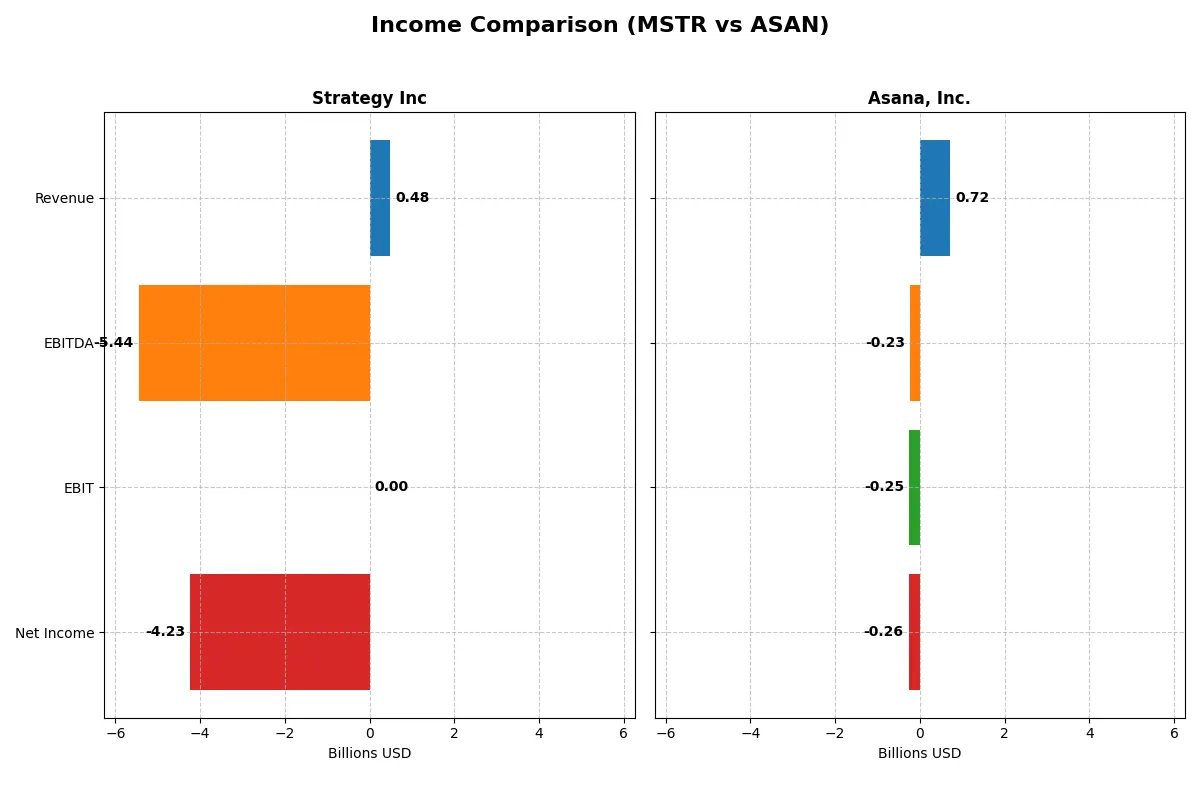
This data dissects the core profitability and scalability of both corporate engines to reveal who dominates the bottom line:
| Metric | Strategy Inc (MSTR) | Asana, Inc. (ASAN) |
|---|---|---|
| Revenue | 477M | 724M |
| Cost of Revenue | 149M | 77M |
| Operating Expenses | 5.62B | 913M |
| Gross Profit | 328M | 647M |
| EBITDA | -5.44B | -230M |
| EBIT | 0 | -247M |
| Interest Expense | 65M | 4M |
| Net Income | -4.23B | -256M |
| EPS | -15.23 | -1.11 |
| Fiscal Year | 2025 | 2025 |
Income Statement Analysis: The Bottom-Line Duel
The following income statement comparison reveals which company runs a more efficient and sustainable business engine over recent years.
Strategy Inc Analysis
Strategy Inc’s revenue slightly declined over five years, ending at $477M in 2025. Gross margin remains strong at nearly 69%, but net margins plunged to -886%, reflecting heavy losses. The 2025 net loss widened sharply to $4.2B, driven by soaring operating and other expenses, signaling deteriorating profitability and efficiency.
Asana, Inc. Analysis
Asana, Inc. shows robust revenue growth, reaching $724M in 2025, with a stellar gross margin above 89%. Despite a persistent net loss of $256M in 2025, Asana improved net margin by over 10% year-over-year. Operating expenses grew proportionally, supporting a scaling model with improving earnings momentum.
Margin Strength vs. Growth Traction
Strategy Inc suffers deep net losses despite solid gross margins, reflecting poor cost control and mounting expenses. In contrast, Asana balances rapid revenue growth with high gross margins and improving net margin trends. Asana’s profile suits investors seeking growth with improving efficiency, while Strategy Inc’s results raise caution on sustainable profitability.
Financial Ratios Comparison
These vital ratios act as a diagnostic tool to expose the underlying fiscal health, valuation premiums, and capital efficiency of the companies compared below:
| Ratios | Strategy Inc (MSTR) | Asana, Inc. (ASAN) |
|---|---|---|
| ROE | -6.4% (2024) | -112.3% (2025) |
| ROIC | -4.4% (2024) | -53.0% (2025) |
| P/E | -47.8 (2024) | -19.2 (2025) |
| P/B | 3.06 (2024) | 21.5 (2025) |
| Current Ratio | 0.71 (2024) | 1.44 (2025) |
| Quick Ratio | 0.71 (2024) | 1.44 (2025) |
| D/E | 0.40 (2024) | 1.18 (2025) |
| Debt-to-Assets | 28.1% (2024) | 30.1% (2025) |
| Interest Coverage | -29.9 (2024) | -72.4 (2025) |
| Asset Turnover | 0.018 (2024) | 0.81 (2025) |
| Fixed Asset Turnover | 5.73 (2024) | 2.76 (2025) |
| Payout ratio | 0% (2024) | 0% (2025) |
| Dividend yield | 0% (2024) | 0% (2025) |
| Fiscal Year | 2024 | 2025 |
Efficiency & Valuation Duel: The Vital Signs
Financial ratios act as a company’s DNA, exposing hidden risks and revealing operational strengths that raw numbers often mask.
Strategy Inc
Strategy Inc shows weak profitability with a negative ROE of -6.4% and deeply unfavorable margins. The stock trades at a negative P/E, suggesting earnings challenges but a potentially undervalued price. Its low current ratio of 0.71 signals liquidity stress. Strategy Inc neither pays dividends nor returns capital, instead allocating heavily to R&D, aiming for growth despite operational inefficiencies.
Asana, Inc.
Asana posts a severely negative ROE of -112.3% and a net margin of -35.3%, reflecting unprofitable operations. Valuation appears stretched with a high price-to-book of 21.5 and a negative P/E, indicating market skepticism. It maintains a healthy current ratio of 1.44 but suffers from weak interest coverage. Asana reinvests aggressively into R&D, foregoing dividends to fuel expansion.
Valuation Strain Meets Operational Struggle
Both companies suffer from poor profitability and negative returns on invested capital, with Strategy Inc showing more liquidity risk. Strategy Inc offers a cheaper valuation but weaker balance sheet health. Asana’s stronger liquidity and reinvestment focus suit growth-oriented investors, while Strategy Inc fits those seeking undervalued stocks despite operational headwinds.
Which one offers the Superior Shareholder Reward?
I compare Strategy Inc (MSTR) and Asana, Inc. (ASAN) on shareholder returns through dividends and buybacks. Neither pays dividends, so reinvestment is key. MSTR shows no dividend yield and no payout ratio, focusing on buybacks but with negative free cash flow (-$115/share in 2024). ASAN also pays no dividends but delivers positive free cash flow ($0.04/share in 2025) and maintains a modest buyback program. MSTR’s buyback intensity is hampered by weak cash ratios (0.11) and negative operating margins, raising sustainability concerns. ASAN’s stronger free cash flow and healthier liquidity (cash ratio 0.44) suggest a more sustainable capital return model. I conclude ASAN offers a superior total shareholder reward in 2026 due to its balance of growth reinvestment and disciplined buybacks.
Comparative Score Analysis: The Strategic Profile
The radar chart reveals the fundamental DNA and trade-offs of Strategy Inc and Asana, Inc., highlighting their distinct financial strengths and weaknesses:
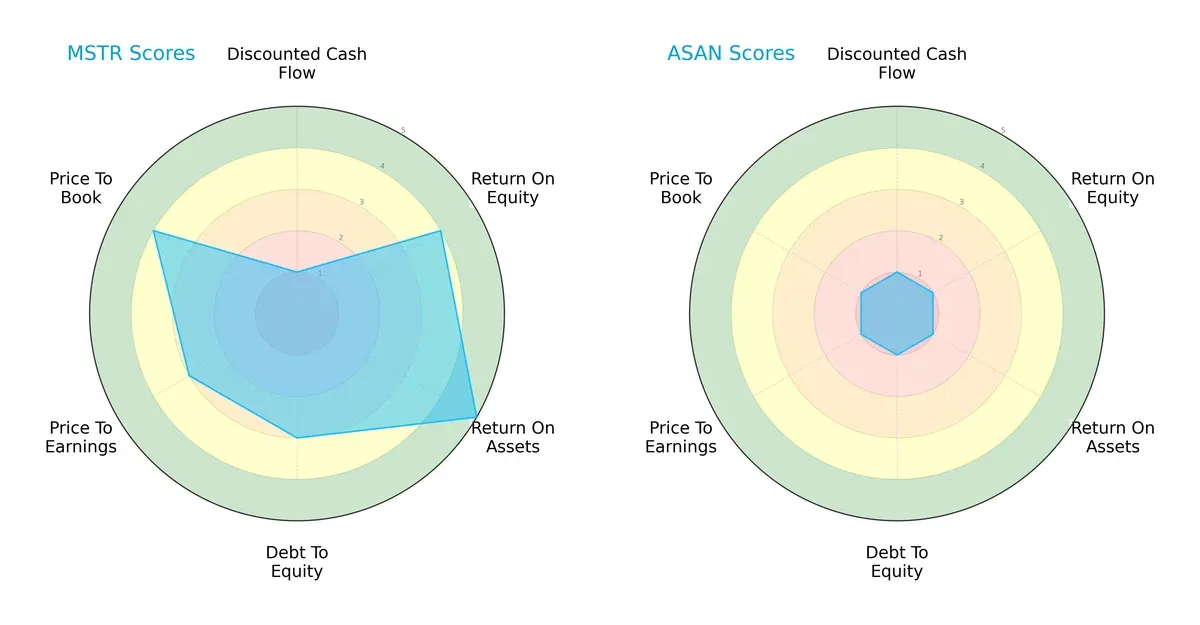
Strategy Inc shows a balanced profile with strong ROE (4) and ROA (5) scores, moderate debt management (3), and favorable valuation metrics (PE 3, PB 4). In contrast, Asana, Inc. scores uniformly low (1 across all metrics), indicating significant operational and financial challenges. Strategy Inc leverages asset efficiency and equity returns, while Asana lacks a clear competitive edge.
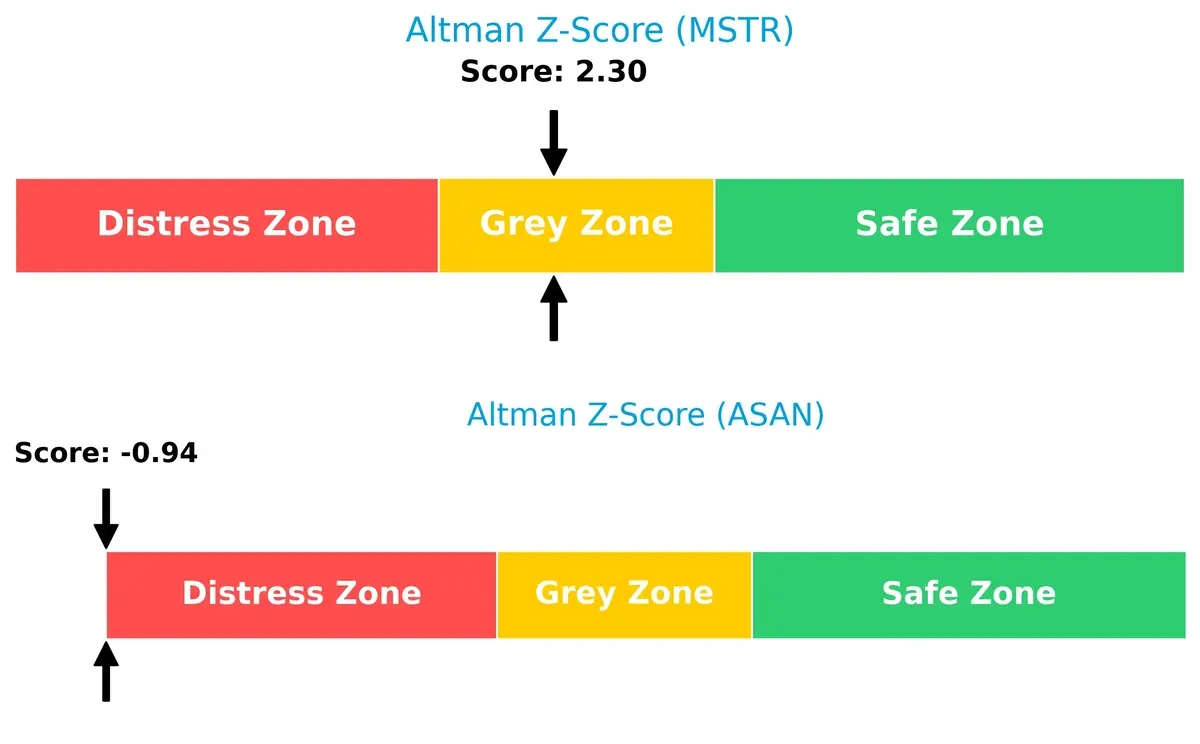
Bankruptcy Risk: Solvency Showdown
Strategy Inc’s Altman Z-Score of 2.3 places it in the grey zone, indicating moderate bankruptcy risk in this cycle. Asana’s score of -0.9 signals distress and high insolvency risk:
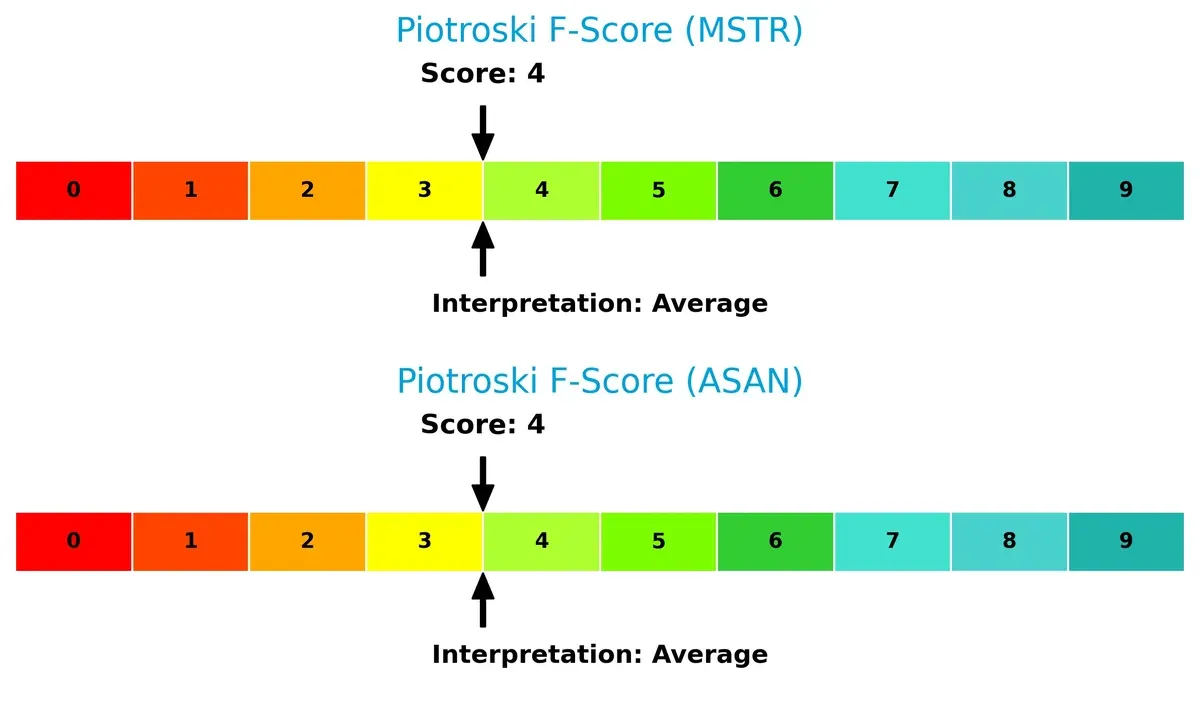
Financial Health: Quality of Operations
Both companies have a Piotroski F-Score of 4, reflecting average financial health. Neither firm demonstrates peak operational quality, suggesting internal metrics remain a concern:
How are the two companies positioned?
This section dissects the operational DNA of Strategy Inc and Asana, Inc. by comparing their revenue distribution and internal dynamics. The goal is to confront their economic moats and identify which business model offers the most resilient competitive advantage today.
Revenue Segmentation: The Strategic Mix
This visual comparison dissects how Strategy Inc and Asana, Inc. diversify their income streams and highlights their primary sector bets:
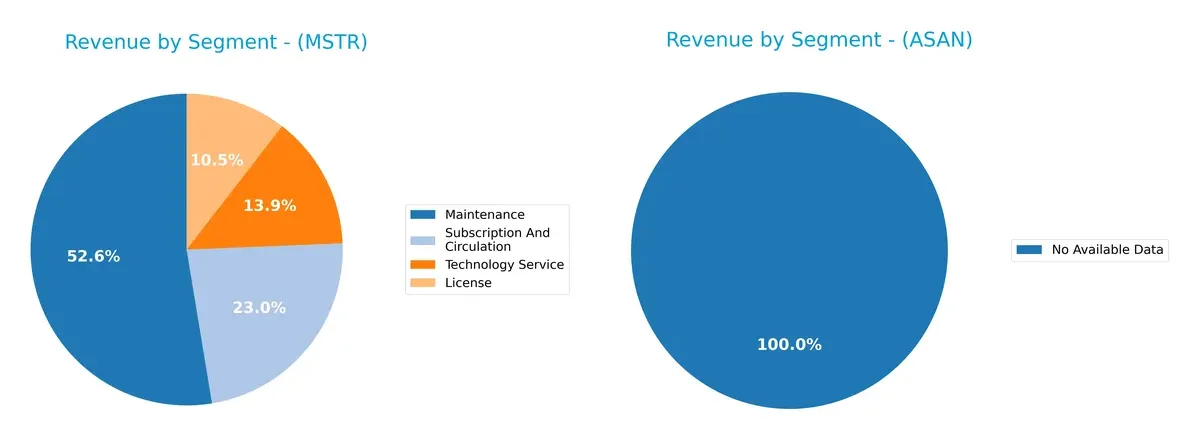
Strategy Inc anchors its revenue in Maintenance at $244M, dwarfing other streams like Subscription ($107M) and Technology Service ($64M). License revenue trails at $49M. In contrast, Asana, Inc. lacks available segment data, preventing direct comparison. Strategy Inc’s heavy Maintenance reliance suggests infrastructure dominance but raises concentration risk. Its moderate Subscription and Technology bets indicate a pivot toward recurring, scalable income despite dependency on legacy licenses.
Strengths and Weaknesses Comparison
This table compares the Strengths and Weaknesses of Strategy Inc and Asana, Inc.:
Strategy Inc Strengths
- Diversified revenue streams with License, Maintenance, Subscription, and Technology Service
- Strong global presence with significant North America and EMEA sales
- Favorable debt-to-assets and debt-to-equity ratios indicate prudent leverage
- Fixed asset turnover is high, showing efficient asset use
Asana, Inc. Strengths
- Favorable weighted average cost of capital (7.74%) supports investment returns
- Positive price-to-earnings ratio despite losses
- Quick ratio suggests good short-term liquidity
- Growing global revenues with strong US and Non-US sales
Strategy Inc Weaknesses
- Negative net margin, ROE, and ROIC indicate weak profitability
- Low current and quick ratios reflect liquidity concerns
- Negative interest coverage signals difficulty servicing debt
- Unfavorable price-to-book ratio questions valuation
- Low asset turnover limits operational efficiency
Asana, Inc. Weaknesses
- Negative net margin, ROE, and ROIC reflect poor profitability
- High debt-to-equity ratio increases financial risk
- Negative interest coverage highlights debt servicing issues
- Unfavorable price-to-book ratio suggests valuation concerns
- Asset turnover and fixed asset turnover are only neutral
Both companies struggle with profitability and valuation metrics, highlighting operational and financial challenges. Strategy Inc shows stronger asset efficiency and leverage management, while Asana maintains better liquidity and cost of capital. Each faces distinct weaknesses that could affect future strategic decisions.
The Moat Duel: Analyzing Competitive Defensibility
A structural moat is the sole guard against long-term profit erosion from competition. Let’s dissect the core moats protecting these firms:
Strategy Inc: Intangible Assets and Data Governance Moat
Strategy Inc leverages proprietary AI analytics and blockchain exposure, reflected in stable gross margins near 69%. Yet, declining ROIC signals risks to sustaining this moat in 2026.
Asana, Inc.: Network Effects and Workflow Integration Moat
Asana’s platform fosters deep user engagement and collaboration, driving robust 89% gross margins and 11% revenue growth. However, a steep ROIC decline warns of margin pressure ahead.
Intangible Assets vs. Network Effects: Which Moat Holds Stronger?
Both firms face declining capital returns, but Asana’s higher margins and growth suggest a wider moat. Strategy Inc’s moat leans on niche data assets, while Asana’s ecosystem lock-in better defends market share.
Which stock offers better returns?
The past year shows significant declines for both stocks, with Strategy Inc facing a milder drop and Asana, Inc. experiencing deeper losses and shifting trading dynamics.
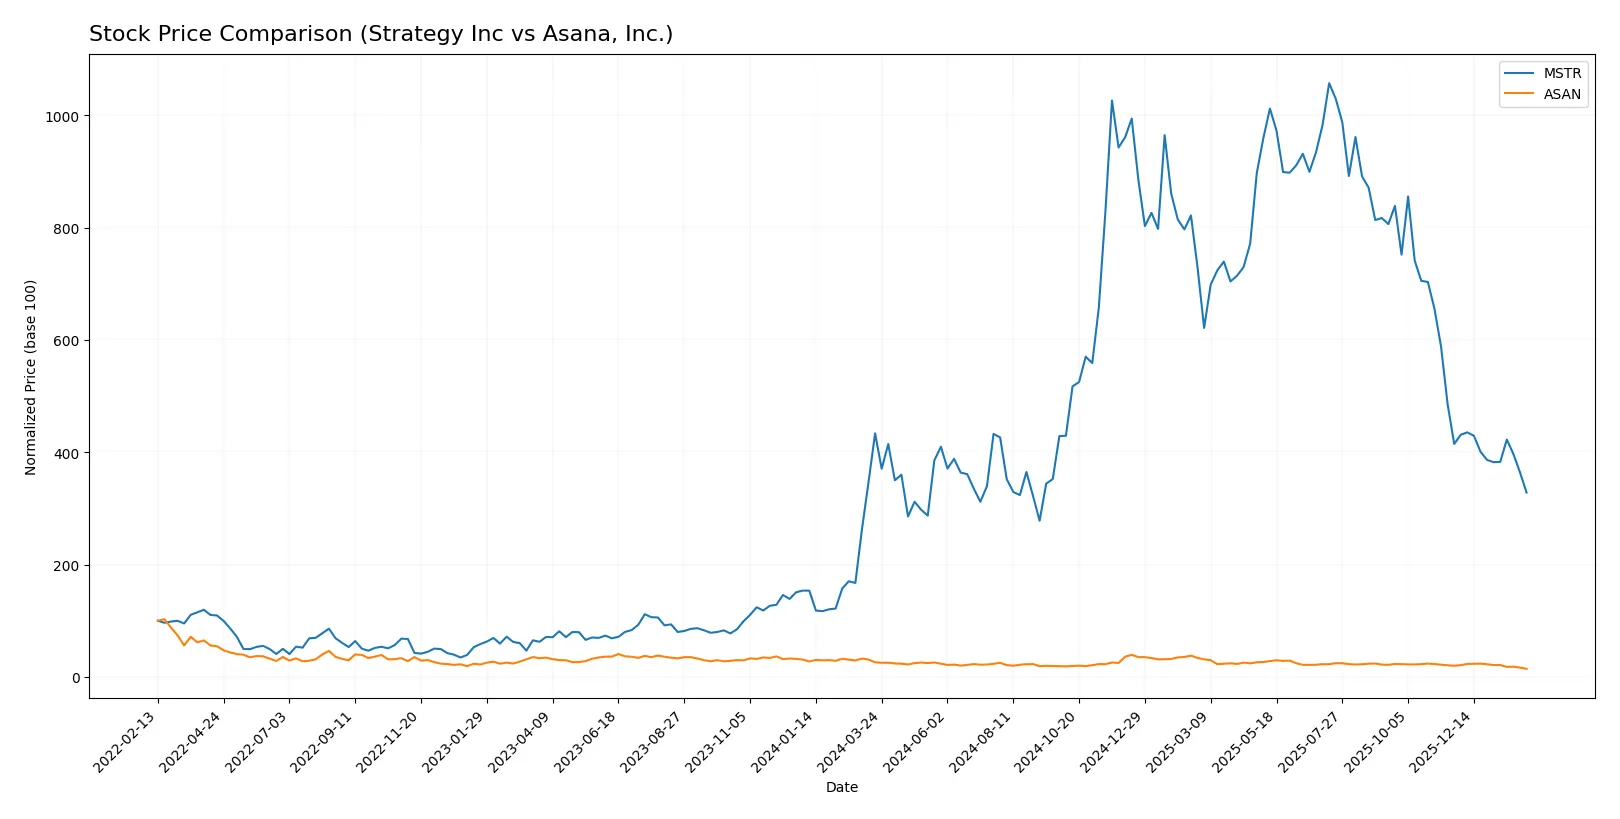
Trend Comparison
Strategy Inc’s stock fell 24.3% over the past 12 months, exhibiting a bearish trend with decelerating losses and high volatility, peaking at 434.58 and bottoming at 114.3.
Asana, Inc.’s stock dropped 45.1% in the same period, also bearish with decelerating declines, lower volatility, a high of 24.15, and a low near 8.76.
Strategy Inc outperformed Asana, Inc. by delivering a smaller percentage loss and higher market stability over the past year.
Target Prices
Analysts present a wide range of target prices, indicating varied market expectations for these technology companies.
| Company | Target Low | Target High | Consensus |
|---|---|---|---|
| Strategy Inc | 175 | 705 | 374.5 |
| Asana, Inc. | 14 | 18 | 15.4 |
Strategy Inc’s consensus target of 374.5 far exceeds its current price of 134.93, signaling strong upside potential. Asana’s target consensus at 15.4 also suggests upside from its current 8.76 price, though with a narrower range.

Don’t Let Luck Decide Your Entry Point
Optimize your entry points with our advanced ProRealTime indicators. You’ll get efficient buy signals with precise price targets for maximum performance. Start outperforming now!
How do institutions grade them?
Strategy Inc Grades
Here are the recent grades issued by recognized financial institutions for Strategy Inc:
| Grading Company | Action | New Grade | Date |
|---|---|---|---|
| BTIG | Maintain | Buy | 2026-02-06 |
| Canaccord Genuity | Maintain | Buy | 2026-02-04 |
| Mizuho | Maintain | Outperform | 2026-01-16 |
| TD Cowen | Maintain | Buy | 2026-01-15 |
| Citigroup | Maintain | Buy | 2025-12-22 |
| Bernstein | Maintain | Outperform | 2025-12-08 |
| Monness, Crespi, Hardt | Upgrade | Neutral | 2025-11-10 |
| HC Wainwright & Co. | Maintain | Buy | 2025-11-03 |
| Canaccord Genuity | Maintain | Buy | 2025-11-03 |
| TD Cowen | Maintain | Buy | 2025-10-31 |
Asana, Inc. Grades
The following table summarizes the latest grades from reputable firms for Asana, Inc.:
| Grading Company | Action | New Grade | Date |
|---|---|---|---|
| Piper Sandler | Maintain | Overweight | 2026-02-03 |
| Citigroup | Upgrade | Buy | 2026-01-15 |
| RBC Capital | Maintain | Underperform | 2026-01-05 |
| Keybanc | Upgrade | Overweight | 2025-12-15 |
| DA Davidson | Maintain | Neutral | 2025-12-04 |
| RBC Capital | Maintain | Underperform | 2025-12-03 |
| Citigroup | Maintain | Neutral | 2025-12-03 |
| UBS | Maintain | Neutral | 2025-12-03 |
| Morgan Stanley | Maintain | Underweight | 2025-09-04 |
| Piper Sandler | Maintain | Overweight | 2025-09-04 |
Which company has the best grades?
Strategy Inc consistently receives Buy and Outperform ratings from top-tier analysts, indicating strong institutional confidence. Asana, Inc. shows mixed grades, including Underperform and Neutral, with some upgrades to Overweight and Buy. Investors may view Strategy Inc’s more favorable grades as a signal of relative strength.
Risks specific to each company
The following categories identify the critical pressure points and systemic threats facing both firms in the 2026 market environment:
1. Market & Competition
Strategy Inc
- Operates in bitcoin treasury and AI analytics, facing volatility and crypto market competition.
Asana, Inc.
- Competes in work management software with established players and evolving client demands.
2. Capital Structure & Debt
Strategy Inc
- Debt-to-equity ratio favorable at 0.4; moderate leverage supports financial stability.
Asana, Inc.
- High debt-to-equity of 1.18 signals higher financial risk and reliance on borrowing.
3. Stock Volatility
Strategy Inc
- Beta of 3.535 indicates extreme volatility and sensitivity to market swings.
Asana, Inc.
- Beta near 1 (0.957) reflects average market volatility and steadier price movements.
4. Regulatory & Legal
Strategy Inc
- Exposure to complex cryptocurrency regulations globally poses compliance risks.
Asana, Inc.
- Faces standard tech sector regulations; less regulatory complexity than crypto-focused firms.
5. Supply Chain & Operations
Strategy Inc
- Relies on digital infrastructure and data governance; operational risks linked to AI platform integration.
Asana, Inc.
- Depends on cloud infrastructure; risks include service outages and customer retention in SaaS.
6. ESG & Climate Transition
Strategy Inc
- Cryptocurrency mining and blockchain activities face ESG scrutiny due to energy consumption.
Asana, Inc.
- SaaS business model has lower direct environmental impact but must maintain social governance standards.
7. Geopolitical Exposure
Strategy Inc
- Global bitcoin exposure subjects it to geopolitical risks, including sanctions and regulatory shifts.
Asana, Inc.
- Primarily US-based with international clients; geopolitical risks less direct but present in data privacy laws.
Which company shows a better risk-adjusted profile?
Strategy Inc’s key risk is extreme stock volatility due to bitcoin exposure. Asana, Inc. struggles with a risky capital structure and negative profitability metrics. I view Strategy Inc as having a marginally better risk-adjusted profile, supported by stronger debt management and a more favorable rating score despite market turbulence. Asana’s distress-level Altman Z-score and heavy debt raise red flags.
Final Verdict: Which stock to choose?
Strategy Inc’s superpower lies in its operational resilience and efficient asset use despite financial headwinds. Its weak liquidity ratios remain a point of vigilance. It suits investors with an appetite for high-risk, aggressive growth bets who can tolerate volatility.
Asana, Inc. holds a strategic moat in its recurring revenue model and strong gross margins, offering more financial stability than Strategy Inc. However, ongoing profitability challenges temper enthusiasm. It aligns with growth-at-a-reasonable-price investors seeking a balance between innovation and risk control.
If you prioritize operational efficiency and are comfortable with aggressive exposure, Strategy Inc. outshines due to its robust asset turnover and favorable ratings. However, if you seek steadier growth with a clearer revenue moat, Asana offers better stability despite its valuation premium. Both present high-risk profiles that demand careful risk management.
Disclaimer: Investment carries a risk of loss of initial capital. The past performance is not a reliable indicator of future results. Be sure to understand risks before making an investment decision.
Go Further
I encourage you to read the complete analyses of Strategy Inc and Asana, Inc. to enhance your investment decisions: